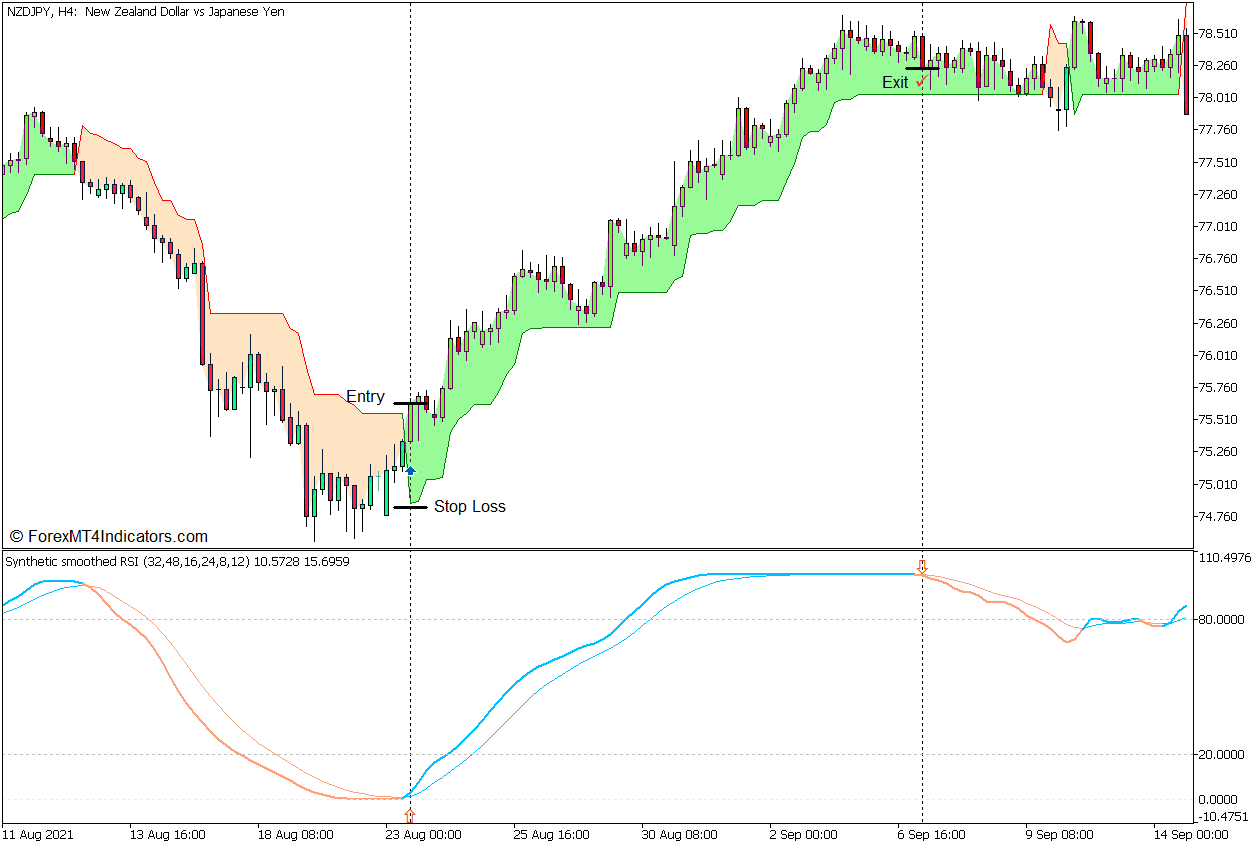
Trend Reversals are market conditions wherein the market quickly reverses against a prior trend. These market conditions are excellent trading opportunities as it allow traders to profit from a huge market swing if done correctly.
In this strategy, we will examine how we can trade Trend Reversals objectively using two technical indicators, which are the Synthetic Smoothed RSI and the Supertrend indicator.
Synthetic Smoothed RSI Indicator
The Synthetic Smoothed RSI is a long-term momentum direction indicator that is based on the Relative Strength Index (RSI) oscillator. This indicator calculates three instances of an RSI. These RSI calculations also differ from regular RSI calculations because the values that they use are also pre-filtered using Exponential Moving Averages (EMA). This means that the indicator would first calculate for three individual EMA calculations, and then use these EMA values as an input for its subsequent RSI calculation. After which, the indicator then proceeds to calculate for its main oscillator line which is derived from the three RSI instances. Its calculation however is not a simple average of the three RSI instances, but instead, it uses a different formula to create a smoothed oscillator line. This indicator also uses an Ehlers smoothed RSI calculation instead of the standard RSI calculation, creating an even smoother RSI oscillation.
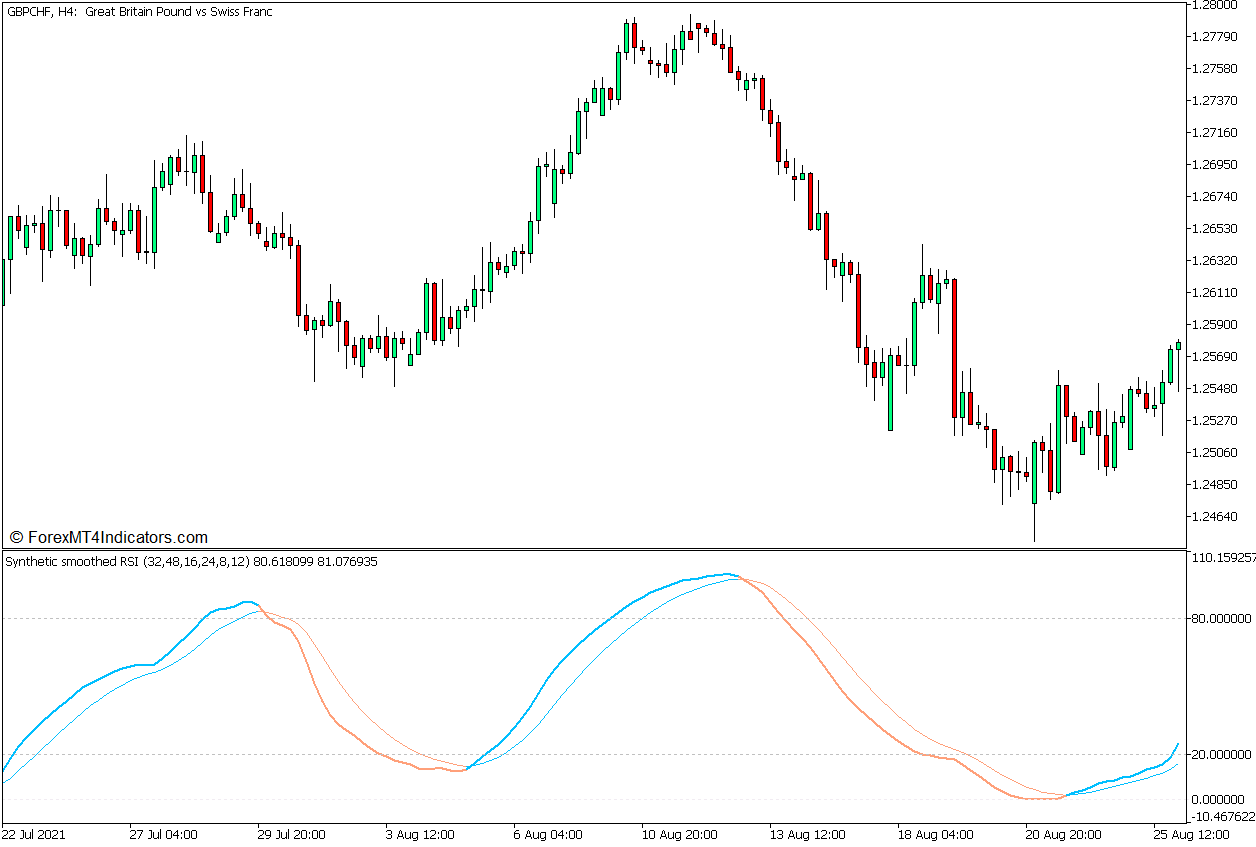
This indicator plots two lines which oscillate within the range of 0 to 100. One is the main Smoothed RSI Line while the other is a Signal Line. The oscillator lines rise whenever the momentum is rising and drop whenever the market momentum is dropping.
Traders may identify the direction of the momentum based on how the two lines overlap. Momentum is bullish whenever the Smoothed RSI Line is above the Signal Line, and bearish whenever the Smoothed RSI Line is below the Signal Line.
The range of the oscillator also has markers at levels 20 and 80, which act as thresholds for the market’s normal range. The market is considered oversold whenever the oscillator lines drop below 20 and overbought whenever the oscillator lines breach above 80. Crossovers that develop beyond these levels tend to be high probability mean reversal signals.
Supertrend Indicator
One of the theories that traders use when looking for trend reversals and trend directions is that price should not go against the direction of the current trend by more than a multiple of 2 or 3 times the Average True Range (ATR). For example, if the market is moving in an uptrend, the price should not drop by more than twice or thrice the ATR, and vice versa for a downtrend. If the price does move against the current trend by more than twice or thrice the ATR, then the market is considered to have reversed.
The Supertrend indicator is a trend-following technical indicator that is based on the concept of using the Average True Range as a basis for identifying trend reversals and trend directions. This indicator simply plots a line that marks as the threshold wherein if the price breaches and closes beyond the line, this indicator will detect a market reversal.
The Supertrend indicator uses two variables, which are the ATR and the multiplier. First, it calculates the product of the ATR and the multiplier. In an uptrend, the indicator would subtract the product of the two variables from the most recent highest high. It would then plot a line based on the resulting value, which would serve as a marker for the uptrend threshold. The indicator would then detect a market reversal whenever the price drops and closes below the line.
Inversely, in an uptrend, the indicator would add the product of the ATR and the multiplier to the lowest low of price action. It then plots a line based on the resulting value, which also serves as the threshold for pullbacks against the downtrend. The indicator detects market reversals whenever the price breaches and closes above the said line.
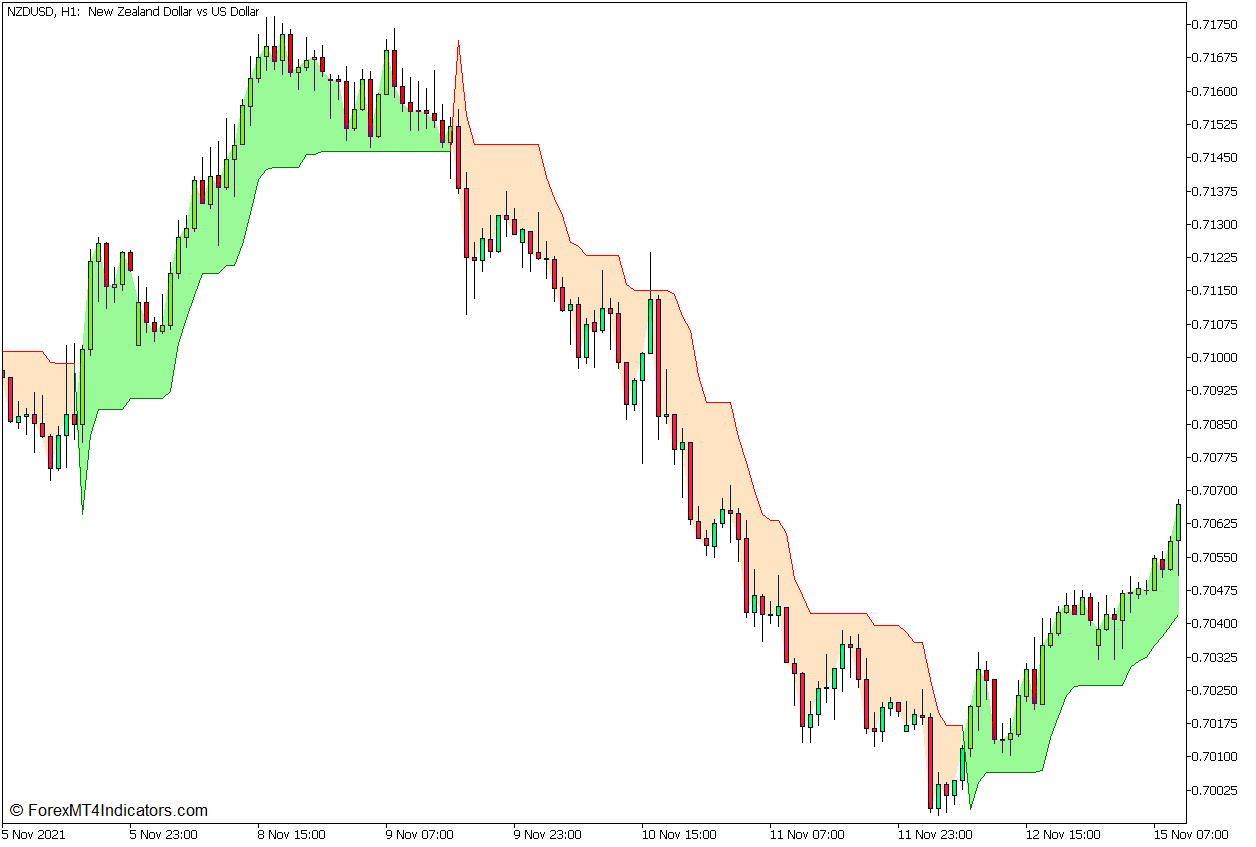
The Supertrend indicator plots a green line below the price action and shades the area between the line and price pale green whenever it detects an uptrend. It also plots a red line above price action and shades the area between price and the line bisque whenever it detects a downtrend.
Trading Strategy Concept
This trading strategy is a trend reversal trading strategy that trades in confluence with an oversold or overbought market condition.
The Synthetic Smoothed RSI oscillator is used to identify the oversold and overbought markets based on its oscillator lines breaching the 20 to 80 range. Mean Reversal Signals are also confirmed whenever its main Smoothed RSI Line crosses over its Signal Line while beyond the range.
The Supertrend indicator is then used to confirm the trend reversal. This is based on the shifting of its line and the changing of the color of its shaded area. This setup also uses a multiplier of 2 for its Supertrend calculation.
Buy Trade Setup
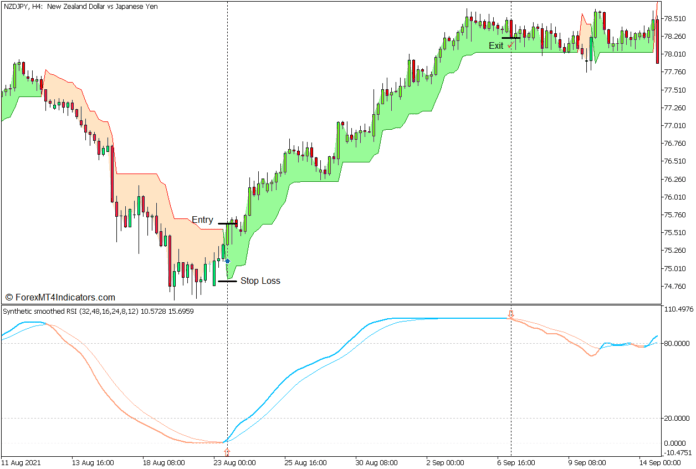
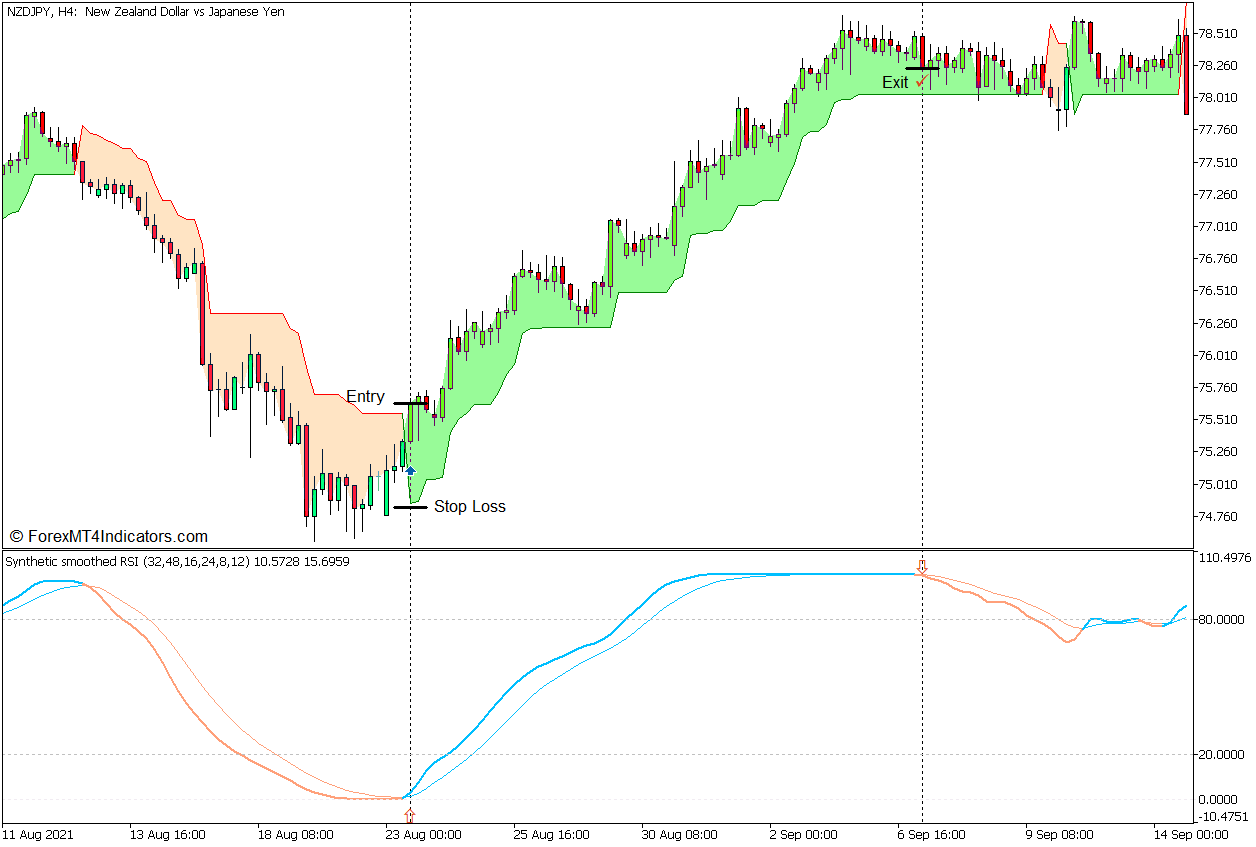
Entry
- The Synthetic Smoothed RSI lines should drop below 20.
- The Smoothed RSI Line should cross above the Signal Line.
- The Supertrend line should shift below price action and change to green.
Stop Loss
- Set the stop loss below the Supertrend line.
Exit
- Close the trade as soon as the Smoothed RSI Line crosses below the Signal Line.
Sell Trade Setup
Entry
- The Synthetic Smoothed RSI lines should breach above 80.
- The Smoothed RSI Line should cross below the Signal Line.
- The Supertrend line should shift above the price action and change to red.
Stop Loss
- Set the stop loss above the Supertrend line.
Exit
- Close the trade as soon as the Smoothed RSI Line crosses above the Signal Line.
Conclusion
This trading strategy can be an effective trade entry signal if used in the right market context. It works well whenever the trade entry is a clear trend reversal coming from an opposite market trend. It does not work as well if it is used in a ranging market wherein the market’s direction is unclear.
This strategy also works best as an entry signal whenever there is an expected market reversal in the area due to certain factors such as a reversal from a supply and demand zone or a bounce from a support or resistance level.
Traders may use this strategy in conjunction with other technical analysis setups from a higher timeframe.
Recommended MT5 Brokers
XM Broker
- Free $50 To Start Trading Instantly! (Withdraw-able Profit)
- Deposit Bonus up to $5,000
- Unlimited Loyalty Program
- Award Winning Forex Broker
- Additional Exclusive Bonuses Throughout The Year
>> Sign Up for XM Broker Account here <<
FBS Broker
- Trade 100 Bonus: Free $100 to kickstart your trading journey!
- 100% Deposit Bonus: Double your deposit up to $10,000 and trade with enhanced capital.
- Leverage up to 1:3000: Maximizing potential profits with one of the highest leverage options available.
- ‘Best Customer Service Broker Asia’ Award: Recognized excellence in customer support and service.
- Seasonal Promotions: Enjoy a variety of exclusive bonuses and promotional offers all year round.
>> Sign Up for FBS Broker Account here <<
Click here below to download:


