


Oversold and Overbought Markets are conditions in a tradeable instrument market wherein there is an imbalance between buyers and sellers causing prices to rapidly drop or rise to an extreme price level. These market conditions are prime conditions for a Mean Reversal. This is a scenario wherein the price would reverse from an extreme price level in order to rebalance the market.
The strategy we are about to discuss shows us how we can systematically trade Mean Reversals using the Stochastic RSI Indicator and the Bollinger Bands.
Stochastic RSI Indicator
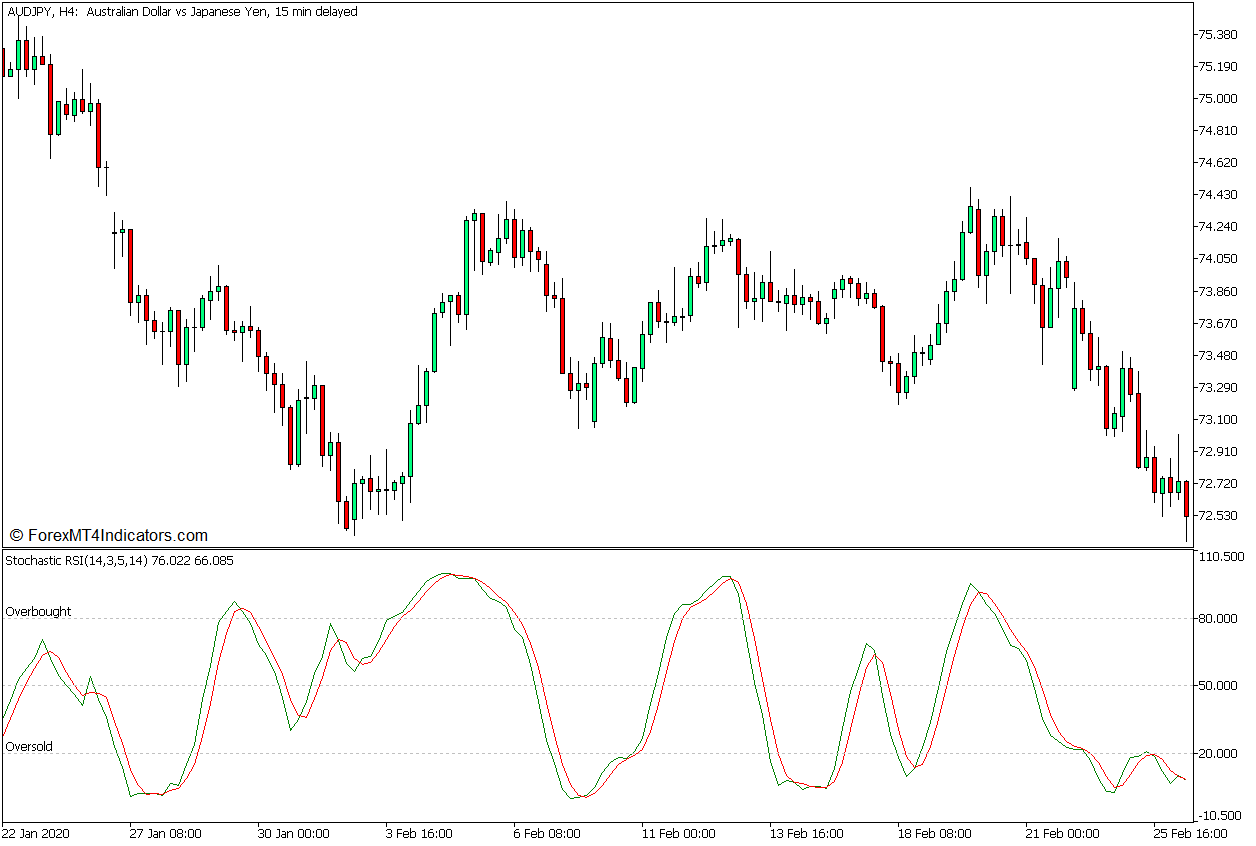
The Stochastic RSI Indicator is a momentum technical indicator that presents the direction of the momentum of price, as well as overbought and oversold market levels, using a pair of oscillator lines. This technical indicator is based on two widely used oscillators, particularly the Stochastic Oscillator and the Relative Strength Index (RSI).
The Stochastic RSI Indicator uses an algorithm that first calculates the Relative Strength Index, which itself is also a widely used and very effective momentum oscillator. The RSI is also used to help traders identify the direction of the market’s momentum or trend, as well as potential oversold and overbought markets.
The Stochastic RSI Indicator then uses the underlying RSI values as an input to a modified Stochastic Oscillator formula, which is also a popular momentum indicator and is also used for identifying oversold and overbought markets.
Given that the Stochastic RSI Indicator plots a Stochastic Oscillator line which is derived from the RSI, the oscillator lines that this indicator plots tend to be very responsive to price action while having a smoother oscillator line pair.
The oscillator lines that this indicator plot oscillates within the range of 0 to 100. Traders may identify the direction of the market momentum based on how the two lines overlap. It indicates a bullish momentum whenever the green line is above the red line. Inversely, it also indicates a bearish momentum whenever the green line is below the red line.
This indicator also has markers at levels 20 and 80 of its range. The area below 20 is considered to be oversold levels, while the area above 80 is considered to be overbought levels. Crossovers between the two oscillator lines that occur in these areas are considered to be high-probability mean reversal signals.
Bollinger Bands
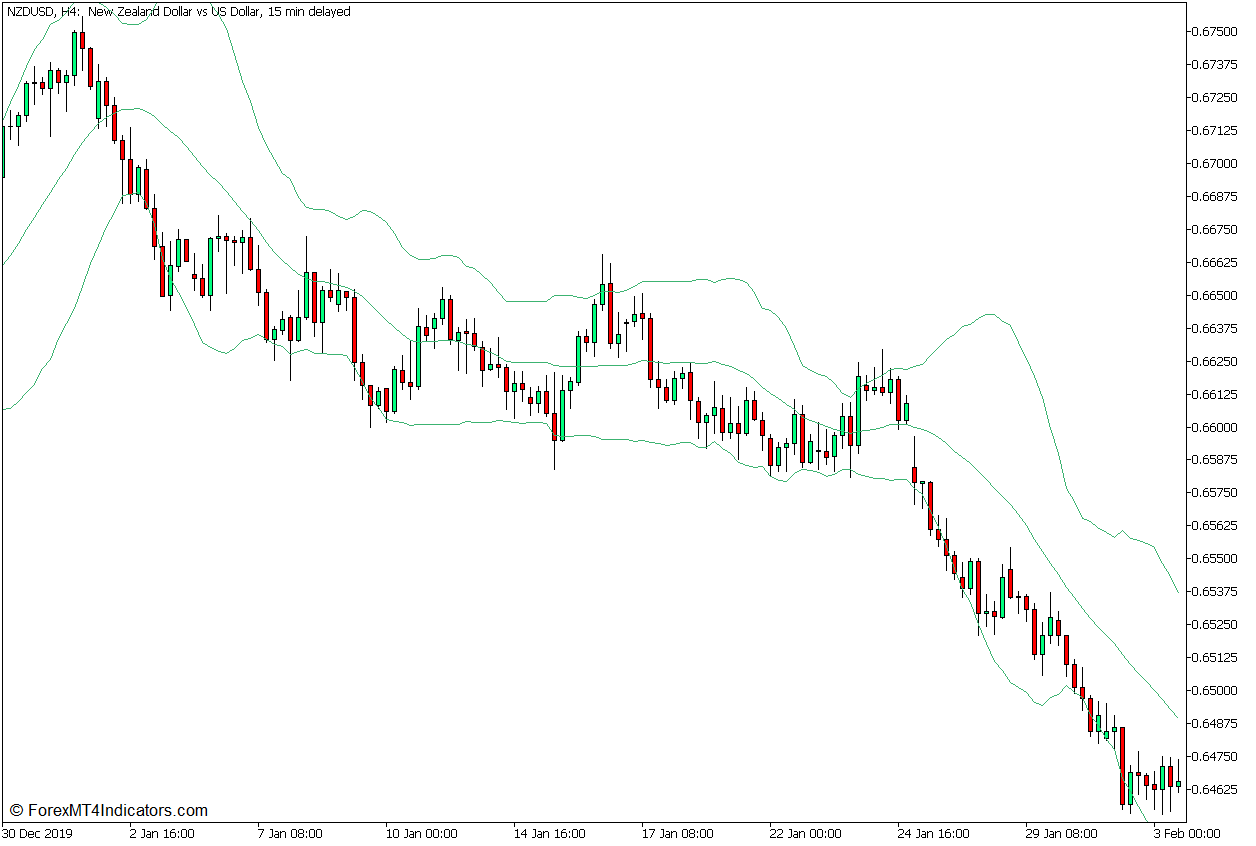
The Bollinger Bands is an envelope or band-type technical indicator that can be used for identifying market volatility, trend direction, momentum breakouts, and overbought or oversold market conditions. It does this using a set of three lines which generally follow an envelope price action.
The middle line of the Bollinger Bands is a Simple Moving Average (SMA) line which is usually preset to calculate for 20 periods. The outer lines on the other hand are standard deviations of price shifted above and below the SMA line based on a multiple of the standard deviation. This is usually preset at 2 standard deviations. However, users can also modify these inputs within the indicator settings. This creates a set of lines that plot a channel-like structure around price action.
Given that the outer lines are based on a standard deviation of price, the bands generally expand whenever price volatility is high and contract whenever price volatility is low. Traders can use this to identify market expansion and contraction phases.
Traders can also identify trend direction based on the location of price action about the middle line. The market is in an uptrend whenever price action stays above the middle line, and in a downtrend whenever price action stays below the middle line.
Traders can also identify momentum breakouts based on momentum candles closing outside tight-ranging Bollinger Bands. This resembles the momentum breakouts that develop right after a market contraction phase.
Lastly, the Bollinger Bands is also widely used as a means for identifying oversold and overbought markets. The area above the upper line is considered overbought, while the area below the lower line is considered oversold. Traders may identify potential mean reversal scenarios whenever price action shows signs of price rejection against the area outside the Bollinger Bands.
Trading Strategy Concept
This trading strategy is a mean reversal trading strategy that trades on the confluence of a mean reversal signal coming from the Stochastic RSI Indicator and the Bollinger Bands.
Traders should first observe scenarios wherein the price is breaching the area outside the Bollinger Bands. This is the first indication that the price is oversold or overbought.
Traders should then confirm the oversold or overbought condition based on the Stochastic RSI Indicator. This can be identified based on the oscillator lines breaching outside its 20 to 80 range.
If both oversold and overbought conditions are confirmed, we could then wait for signs of a potential mean reversal. This would be a confluence of a price rejection pattern forming against the area of the outer Bollinger Band lines and a crossover between the two oscillator lines forming outside the 20 to 80 range.
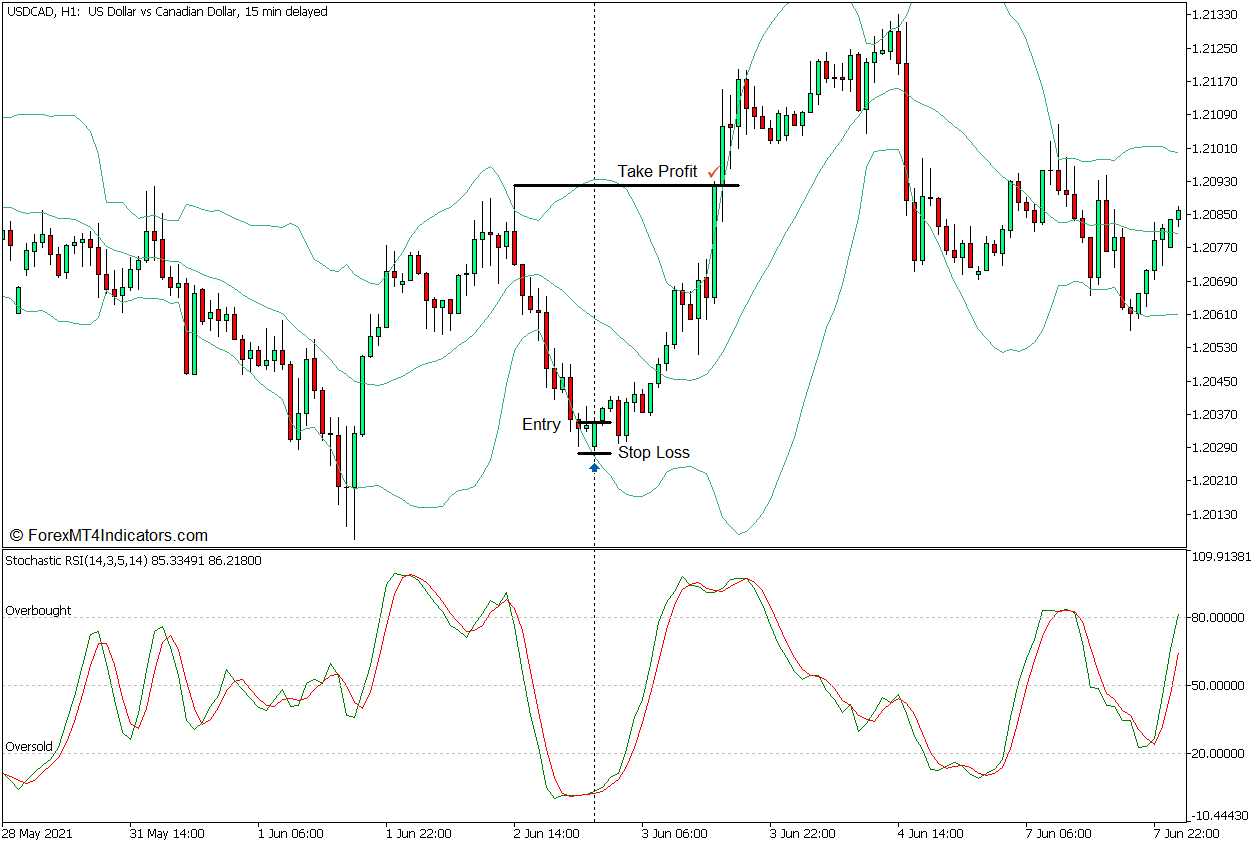
Buy Trade Setup
Entry
- Price action should drop below the lower line of the Bollinger Bands.
- The Stochastic RSI lines should drop below 20.
- Price action should show signs of price rejection against the area below the lower line.
- The green Stochastic RSI line should cross above the red line.
- Open a buy order on the confluence of these mean reversal signals.
Stop Loss
- Set the stop loss on the fractal below the entry candle.
Exit
- Set the take profit target on the next logical swing high level.
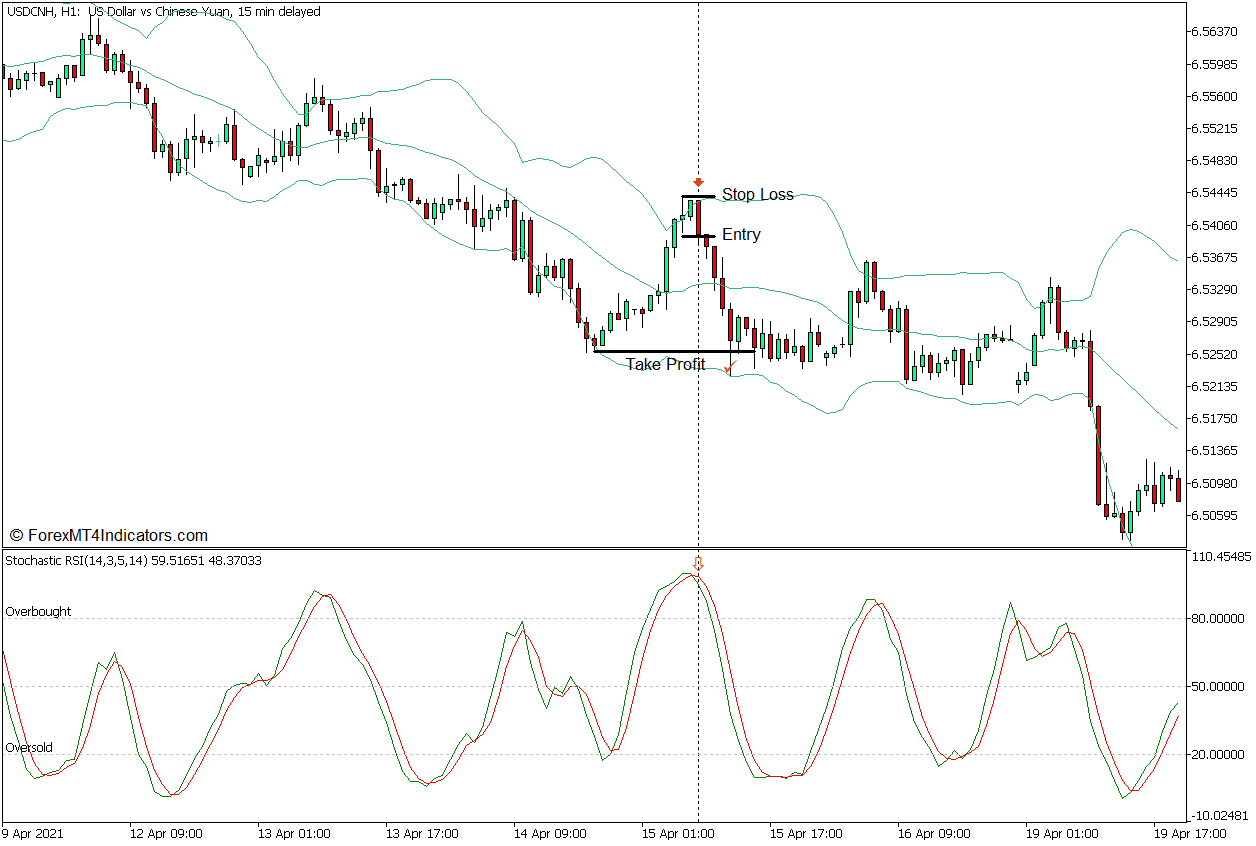
Sell Trade Setup
Entry
- Price action should breach above the upper line of the Bollinger Bands.
- The Stochastic RSI lines should breach above 80.
- Price action should show signs of price rejection against the area above the upper line.
- The green Stochastic RSI line should cross below the red line.
- Open a sell order on the confluence of these mean reversal signals.
Stop Loss
- Set the stop loss on the fractal above the entry candle.
Exit
- Set the take profit target on the next logical swing low level.
Conclusion
This trading strategy is very effective when used in a market wherein price action has clearly defined price swings which tends to seek higher highs or lower lows. The confluence between the two signals tends to capture high-probability mean reversal signals. Price can even swing at an opposite price extreme allowing for better profits if the trader opts to manually close a trade using price action. However, traders should still practice this strategy before implementing it on a live trading account to get a feel of how it works.
Recommended MT5 Brokers
XM Broker
- Free $50 To Start Trading Instantly! (Withdraw-able Profit)
- Deposit Bonus up to $5,000
- Unlimited Loyalty Program
- Award Winning Forex Broker
- Additional Exclusive Bonuses Throughout The Year

>> Sign Up for XM Broker Account here <<
FBS Broker
- Trade 100 Bonus: Free $100 to kickstart your trading journey!
- 100% Deposit Bonus: Double your deposit up to $10,000 and trade with enhanced capital.
- Leverage up to 1:3000: Maximizing potential profits with one of the highest leverage options available.
- ‘Best Customer Service Broker Asia’ Award: Recognized excellence in customer support and service.
- Seasonal Promotions: Enjoy a variety of exclusive bonuses and promotional offers all year round.

>> Sign Up for FBS Broker Account here <<
Click here below to download: