


Ranging Markets are market conditions wherein prices is generally oscillate within an identifiable market range. These markets often have clearly identifiable support and resistance levels where prices would reverse from.
These types of markets are often overlooked by most traders because most traders are focused on trading trend-following strategies. However, these market conditions also present tradeable opportunities which traders can profit from.
In this strategy, we will show you how you can easily identify key support and resistance levels within a market range and trade a reversal trading strategy using the RSI Candle Keltner and Zigzag Color indicators.
RSI Candle Keltner
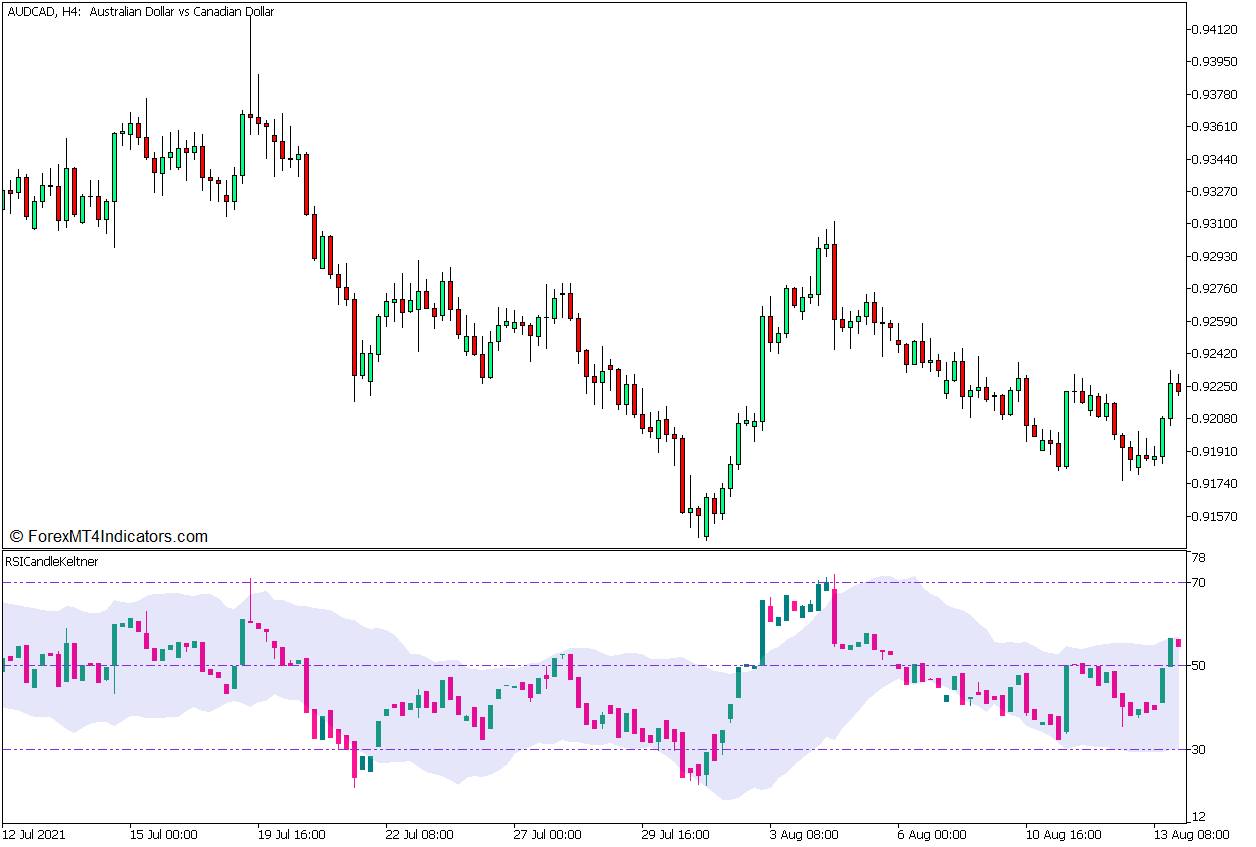
The RSI Candle Keltner Channel indicator is an oscillator type of technical indicator that is derived from the Relative Strength Index (RSI) indicator and the Keltner Channel indicator.
This indicator normalizes the values of the price candles within a range of 0 to 100, which has the same range as the RSI. It does this by calculating the RSI values for the open, high, low, and close of price as separate instances. It then plots the candles using the values of the open, high, low, and close RSI as the basis for drawing its candles. It plots a teal candle whenever the candle formation is bullish, and a blue candle whenever the candle formation is bearish.
Just as with the RSI range, this indicator also has markers at levels 30 and 70, but it also has an additional marker at 50. Candles dropping below 30 indicate an oversold market, while candles breaching above 70 indicate an overbought market. The marker at 50 can be used as a basis for identifying trend direction. The market is in an uptrend whenever the candles are generally above 50, and in a downtrend whenever the candles are generally below 50.
The RSI Candle Keltner indicator also draws a channel-like structure around its oscillator candles, which is similar to the Keltner Channel indicator. It calculates the moving average of its oscillator candles. This becomes the median of the oscillator candle range where the channel is based. It then calculates for an Average True Range (ATR) derived from the same candles. Lastly, it draws a channel-like structure using a multiple of the ATR as a basis for measuring the distance of its outer borders and its moving average. This creates the Keltner Channel structure drawn on the oscillator candles.
Users can identify oversold and overbought markets using this channel-like structure. Candles dropping below the channel indicate an oversold market, while candles breaching above the structure indicate an overbought market.
Zigzag Color Indicator
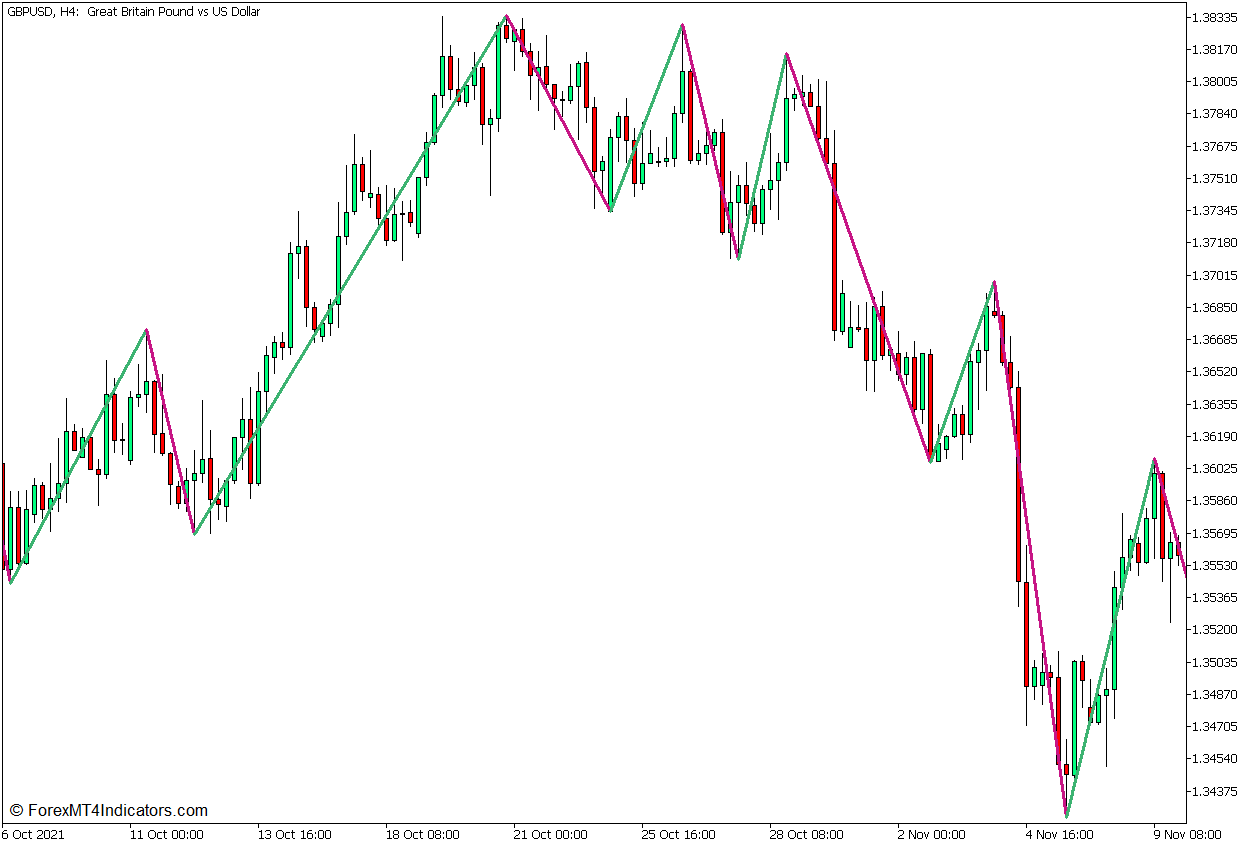
The Zigzag Color Indicator is a modified version of the classic Zigzag Indicator. It is a technical trading tool that allows traders to objectively identify the swing highs and swing lows of price action, which is vital for visualizing the market structure of any tradeable instrument.
This indicator sets a percentage threshold which is used to identify substantial momentum reversals. These momentum reversals are then used as a basis for identifying significant market swings, which allows the indicator to objectively identify the swing highs and swing lows.
The most common deviation threshold used for this indicator is 5%. Theoretically, if price action moves against a prior momentum direction by more than 5%, the indicator would assume that a new momentum direction is being established. It then identifies either the highest high or lowest low of price action as the momentum starts to reverse, marking it as a swing high or swing low. These swing highs or swing lows are then connected by lines, which form a zigzag structure, thus the indicator is called a Zigzag Indicator.
This version of the Zigzag Indicator plots a medium violet red line whenever it is drawing a downward sloping line and a medium sea green line whenever it is drawing an upward sloping line. This is the reason it is called a Zigzag Color Indicator.
Traders can use the swing highs and swing lows identified by this indicator too identify key levels where prices may reverse. It can also be used to identify trending and ranging markets based on the market structure that can be identified based on its swing points.
Trading Strategy Concept
This trading strategy is a rangebound trading strategy that uses the Zigzag Color Indicator and the RSI Candle Keltner Indicator to identify potential market reversals as price bounces off key support and resistance levels.
The Zigzag Color indicator is initially used to identify ranging markets based on the characteristics of their swing highs and swing lows. The same swing highs and swing lows are then used to identify key support and resistance levels where the price may reverse.
Price is then allowed to breach the support or resistance level, which should cause the RSI Candle Keltner to identify oversold and overbought markets based on its 30 to 70 range, as well as its Keltner Channel.
Trades are opened as soon as the candles on the RSI Candle Keltner show signs of price rejection on the oversold or overbought market levels.
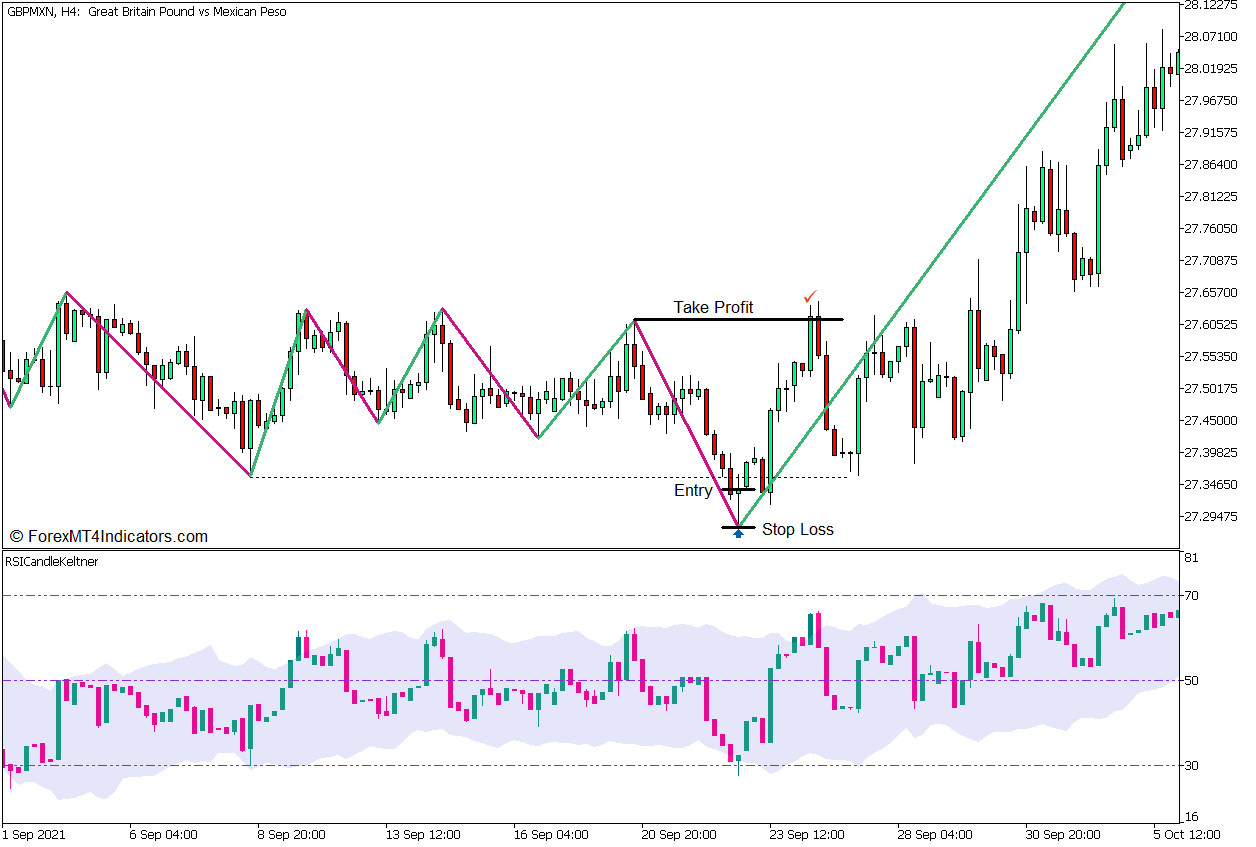
Buy Trade Setup
Entry
- Price should drop below an identified support level.
- The RSI Candle Keltner bars should drop below 30 as well as its lower Keltner Channel line.
- Open a buy order if the candles on the RSI Candle Keltner immediately plot a bullish price rejection candle.
Stop Loss
- Set the stop loss on the fractal below the entry candle.
Exit
- Set the take profit target on a logical resistance level within the range.
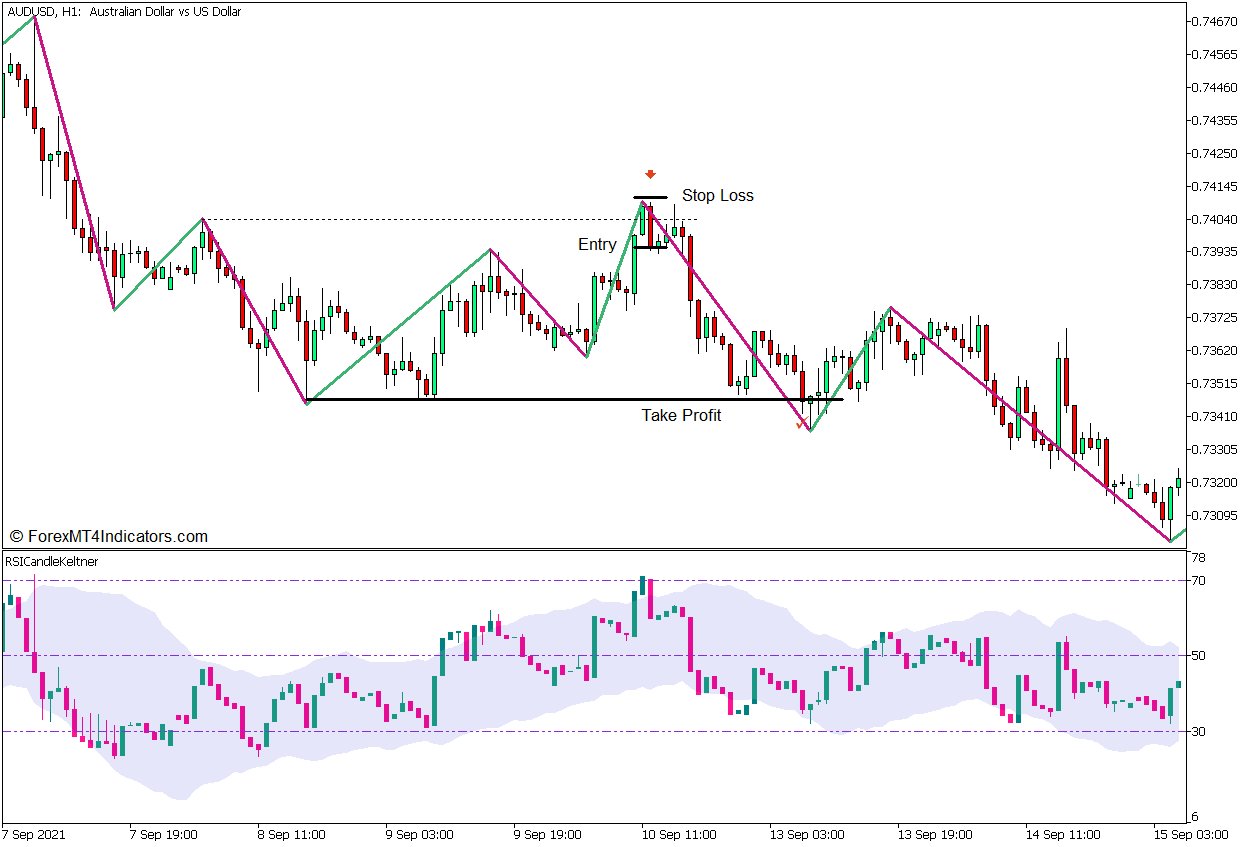
Sell Trade Setup
Entry
- Price should breach above an identified resistance level.
- The RSI Candle Keltner bars should breach above 70 as well as its upper Keltner Channel line.
- Open a sell order if the candles on the RSI Candle Keltner immediately plot a bearish price rejection candle.
Stop Loss
- Set the stop loss on the fractal above the entry candle.
Exit
- Set the take-profit target on a logical support level within the range.
Conclusion
This trading strategy is very useable, especially because ranging markets are common occurrences for most markets. However, most ranging markets are not as clean and clear as most textbooks would have traders believe. This strategy may show support and resistance levels that are not exactly aligned but are still tradeable. Traders should discern for themselves which market structures are viable trading opportunities. This skill comes with experience and practice.
Recommended MT5 Brokers
XM Broker
- Free $50 To Start Trading Instantly! (Withdraw-able Profit)
- Deposit Bonus up to $5,000
- Unlimited Loyalty Program
- Award Winning Forex Broker
- Additional Exclusive Bonuses Throughout The Year

>> Sign Up for XM Broker Account here <<
FBS Broker
- Trade 100 Bonus: Free $100 to kickstart your trading journey!
- 100% Deposit Bonus: Double your deposit up to $10,000 and trade with enhanced capital.
- Leverage up to 1:3000: Maximizing potential profits with one of the highest leverage options available.
- ‘Best Customer Service Broker Asia’ Award: Recognized excellence in customer support and service.
- Seasonal Promotions: Enjoy a variety of exclusive bonuses and promotional offers all year round.

>> Sign Up for FBS Broker Account here <<
Click here below to download: