


Confluences are conditions wherein there are two or more indications that the price is moving in a certain direction. Trading based on a confluence of technical indications tends to provide a higher probability of trade just for the simple reason that there are more technical reasons to believe that the price is about to move.
Here, we will show you how you could trade reversals based on a confluence of overbought or oversold conditions using the TDI indicator, as well as a confluence of a momentum reversal signal using the same indicator and a 10 EMA line.
Traders Dynamic Index
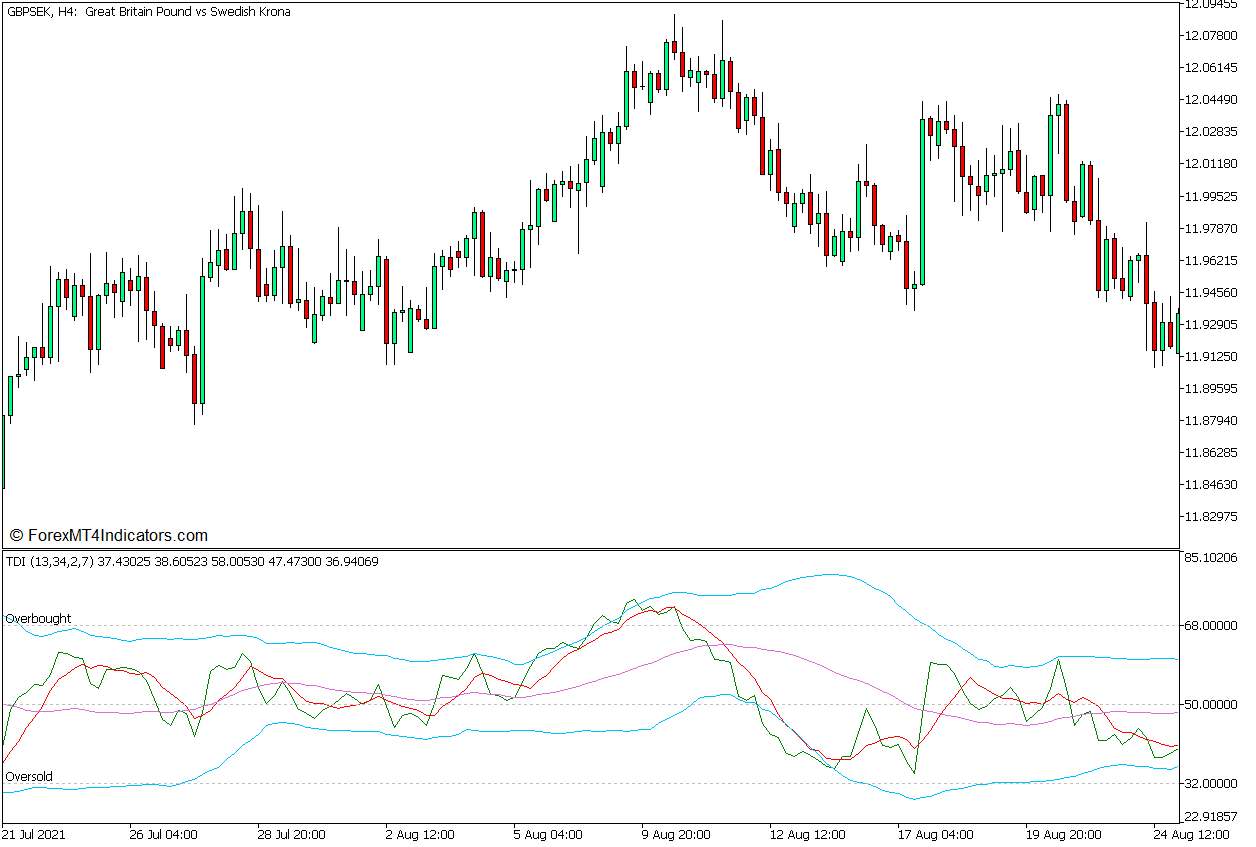
The Traders Dynamic Index (TDI) is a technical indicator developed by Dean Malone that can help traders assess the direction of the market, and its momentum, as well as identify potential market reversals coming from oversold and overbought markets. This indicator combines the features of a Relative Strength Index (RSI) oscillator, a moving average line, and the Bollinger Bands, to provide users with a more complete picture of what the market is doing.
The first component of the Traders Dynamic Index is its RSI line. This line oscillates within a range of 0 to 100 and behaves in the same manner as a regular RSI line does. The oscillator range also has markers at levels 32 and 68. These levels mark the threshold of the market’s normal range. The market is considered oversold whenever the RSI line drops below 32 and overbought whenever the RSI breaches above 78. This version of the indicator plots its RSI line in green.
The indicator also draws a signal line based on the RSI line. This is a moving average line derived from the RSI line, which is preset to calculate for two periods. This TDI version plots its signal line in red. Traders may use these two lines to identify momentum reversals based on the crossing over of the two lines.
The TDI indicator also plots a volatility band which is similar to the Bollinger Bands. However, this is calculated from the RSI line instead of calculating directly from price action. It is preset to calculate the 34-period moving average of the RSI which is drawn as the middle line of the volatility bands. The outer lines are standard deviations calculated from the middle line. Users may identify oversold and overbought market conditions based on the RSI line breaching the range of the outer lines of the volatility bands.
The TDI is unique because it can provide signals based on the confluence of its components. Traders may identify high probability market reversals whenever there is a confluence of an oversold or overbought condition based on its RSI line breaching the 32 to 68 range and its volatility band’s outer lines followed by a crossover between the RSI line and its signal line.
Some traders also use the middle line of the volatility bands as a basis for identifying trend or momentum direction. Momentum direction may be considered bullish if the RSI line is generally above the middle line of the volatility bands and bearish if the RSI line is generally below it.
10 Exponential Moving Average
One of the ways traders identify trend and momentum direction is with the use of a moving average line. Traders may identify the direction of the momentum based on the general location of price action about a moving average line.
The 10-bar Exponential Moving Average (EMA) is a fast-moving average line that is very responsive to price action yet also moves smoothly as it follows the movements of the price. This makes it a very useful signal for identifying momentum direction as well as momentum reversals.
Traders may identify the short-term trend direction based on the location of price action about the 10 EMA line. Consequently, crossovers between price action and the 10 EMA line accompanied by strong momentum are also indicative of a potential momentum reversal on the short term.

Trading Strategy Concept
This trading strategy is a momentum reversal trading strategy that trades on the confluence of a momentum reversal signal based on price action and the 10 EMA line, as well as momentum reversal signals coming from the Traders Dynamic Index that is preceded by a confluence of overbought or oversold conditions.
On the Traders Dynamic Index, we will be looking for conditions wherein the RSI line has breached beyond the 32 to 68 range markers and the outer lines of the volatility bands. These are confluences of overbought and oversold conditions which may result in a strong momentum reversal.
As soon as the overbought or oversold conditions are identified, we could then wait for a confluence of a momentum reversal signal. This would be the crossing over of the RSI line and its signal line in confluence with the crossing over of price action and the 10 EMA line.
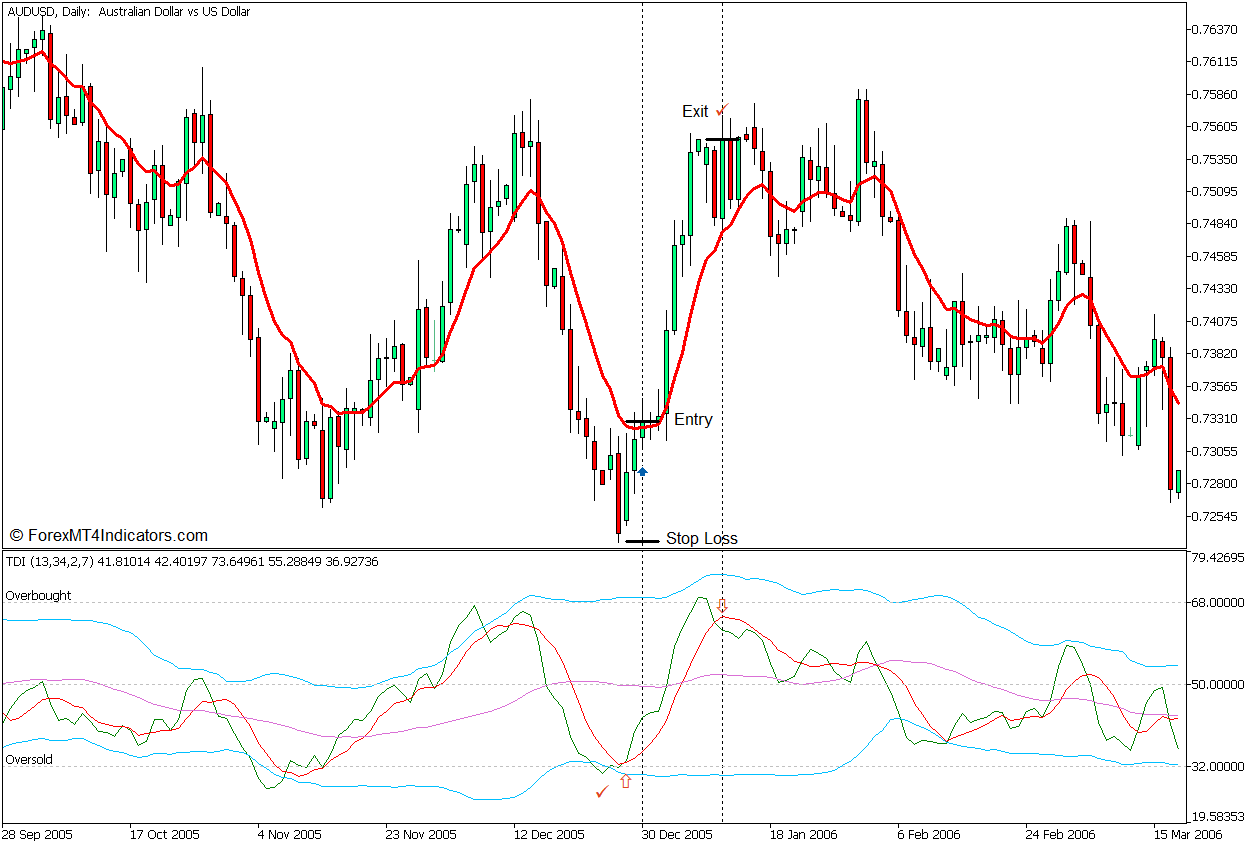
Buy Trade Setup
Entry
- The RSI line of the Traders Dynamic Index should drop below 32 as well as the lower line of its volatility bands.
- The RSI line should cross above its signal line.
- Price should cross and close above the 10 EMA line.
- Open a buy order on the confluence of these momentum reversal signals.
Stop Loss
- Set the stop loss on the fractal below the entry candle.
Exit
- Close the trade as soon as the RSI line crosses below its signal line.
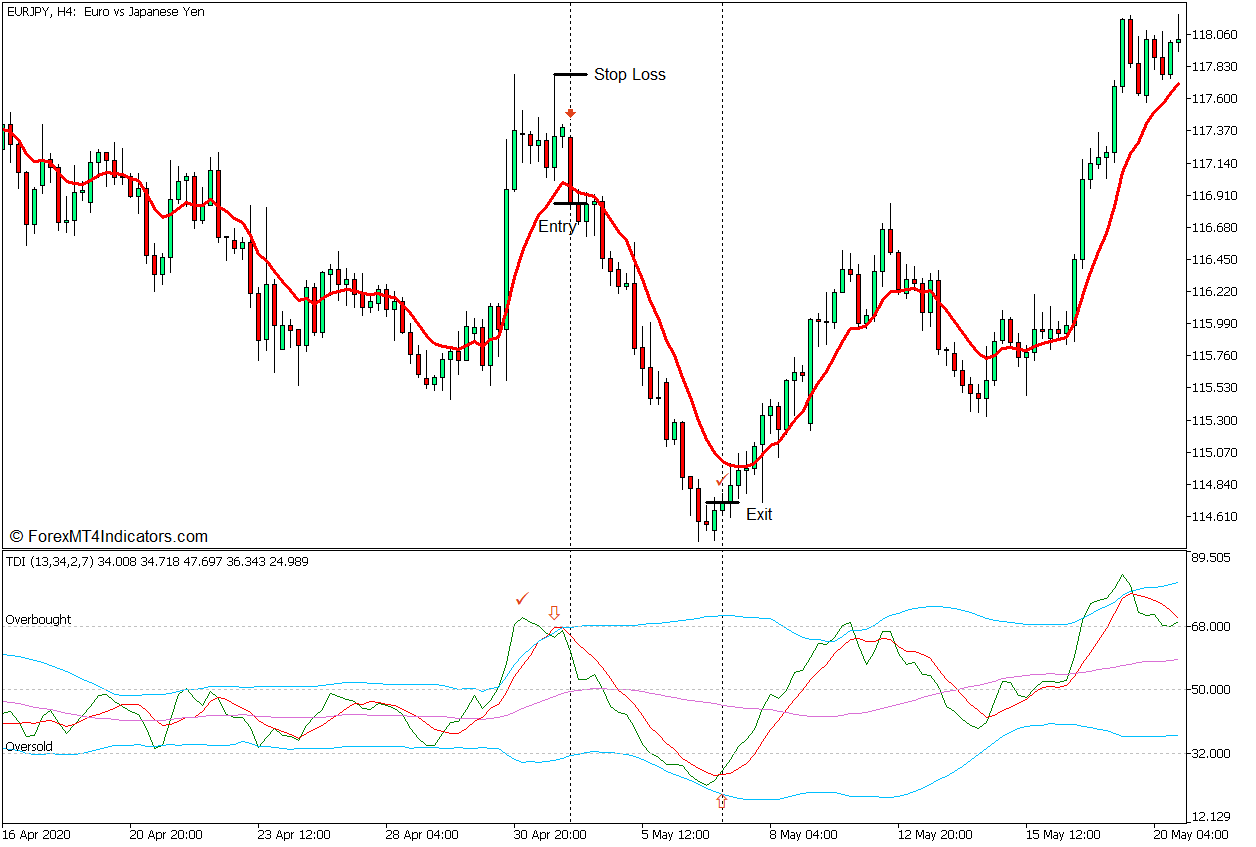
Sell Trade Setup
Entry
- The RSI line of the Traders Dynamic Index should breach above 68 as well as the upper line of its volatility bands.
- The RSI line should cross below its signal line.
- Price should cross and close below the 10 EMA line.
- Open a sell order on the confluence of these momentum reversal signals.
Stop Loss
- Set the stop loss on the fractal above the entry candle.
Exit
- Close the trade as soon as the RSI line crosses below its signal line.
Conclusion
Many technical traders claim to have had success using the TDI indicator as the main basis for their trade setups. This is a testament to how accurate the TDI is. However, it does still have instances wherein the signals it produces can be wrong. Traders should still analyze the market based on price action from the higher timeframes in conjunction with the trade setups discussed above.
Recommended MT5 Brokers
XM Broker
- Free $50 To Start Trading Instantly! (Withdraw-able Profit)
- Deposit Bonus up to $5,000
- Unlimited Loyalty Program
- Award Winning Forex Broker
- Additional Exclusive Bonuses Throughout The Year

>> Sign Up for XM Broker Account here <<
FBS Broker
- Trade 100 Bonus: Free $100 to kickstart your trading journey!
- 100% Deposit Bonus: Double your deposit up to $10,000 and trade with enhanced capital.
- Leverage up to 1:3000: Maximizing potential profits with one of the highest leverage options available.
- ‘Best Customer Service Broker Asia’ Award: Recognized excellence in customer support and service.
- Seasonal Promotions: Enjoy a variety of exclusive bonuses and promotional offers all year round.

>> Sign Up for FBS Broker Account here <<
Click here below to download: