


One of the most common ways traders trade a non-trending market is to trade mean reversal setups. The market would often become overbought or oversold in the short-term even when the market has no clear trend direction. It also tends to move in a cyclical manner oscillating up and down the price chart. Some markets can be very unpredictable. However, some markets and currency pairs can be predicted based on how the cyclical waves reverse as prices become overbought or oversold in the short term. Overbought or oversold markets would reverse back to an average price. This is called a mean reversal. However, it could also cyclically swing over to the opposite end of the spectrum, just like a pendulum.
To trade mean reversals, traders should have an objective method for identifying overbought and oversold price levels. This way they would know if a mean reversal was more likely to occur. Next, we would also need to have a method to identify potential reversals in the short term.
This strategy makes use of the Bollinger Bands and a modified Stochastic Oscillator to identify overbought or oversold levels, as well as potential mean reversal entry points based on a reliable candlestick pattern.
Bollinger Bands
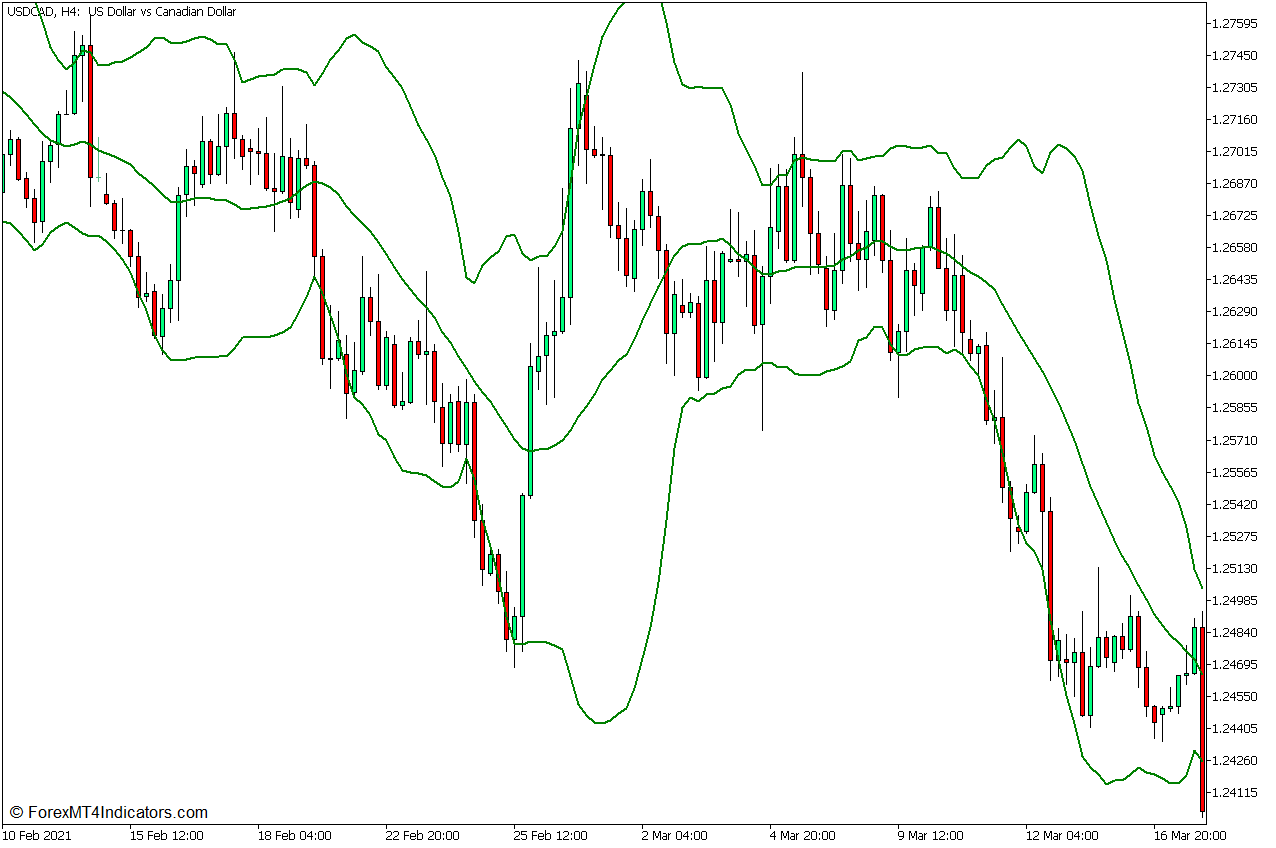
The Bollinger Bands is a versatile technical indicator that can be used to help traders identify, trends, volatility, momentum breakouts, as well as mean reversals.
The Bollinger Bands is composed of three lines. The middle line is a Simple Moving Average (SMA) line usually preset at 20 bars. The outer lines are standard deviations based on price movements and volatility and are plotted above and below the middle line.
Since the middle line of the Bollinger Bands is based on a moving average line, it can be used to identify trend direction and bias. Price action would typically stay on the upper half of the Bollinger Bands during an uptrend, and on the lower half of the Bollinger Bands during a downtrend.
The Bollinger Bands can also be used to help traders identify the volatility of the market since its outer lines are based on the volatility of price movements. The Bollinger Bands tend to expand during market expansion phases, and contract during market contraction phases.
It can also be used to spot momentum breakout setups based on a strong momentum candle breaking out of a tight market contraction phase.
However, its most popular use is as a basis for overbought and oversold markets which are prone to mean reversals. The key is in how price action forms as it touches the outer lines of the Bollinger Bands. The outer lines signify overbought and oversold price levels. Candlesticks tend to form patterns that indicate price rejection as candles touch the outer lines. This indicates a potential mean reversal coming from an overbought or oversold price level.
Engulfing Stochastic
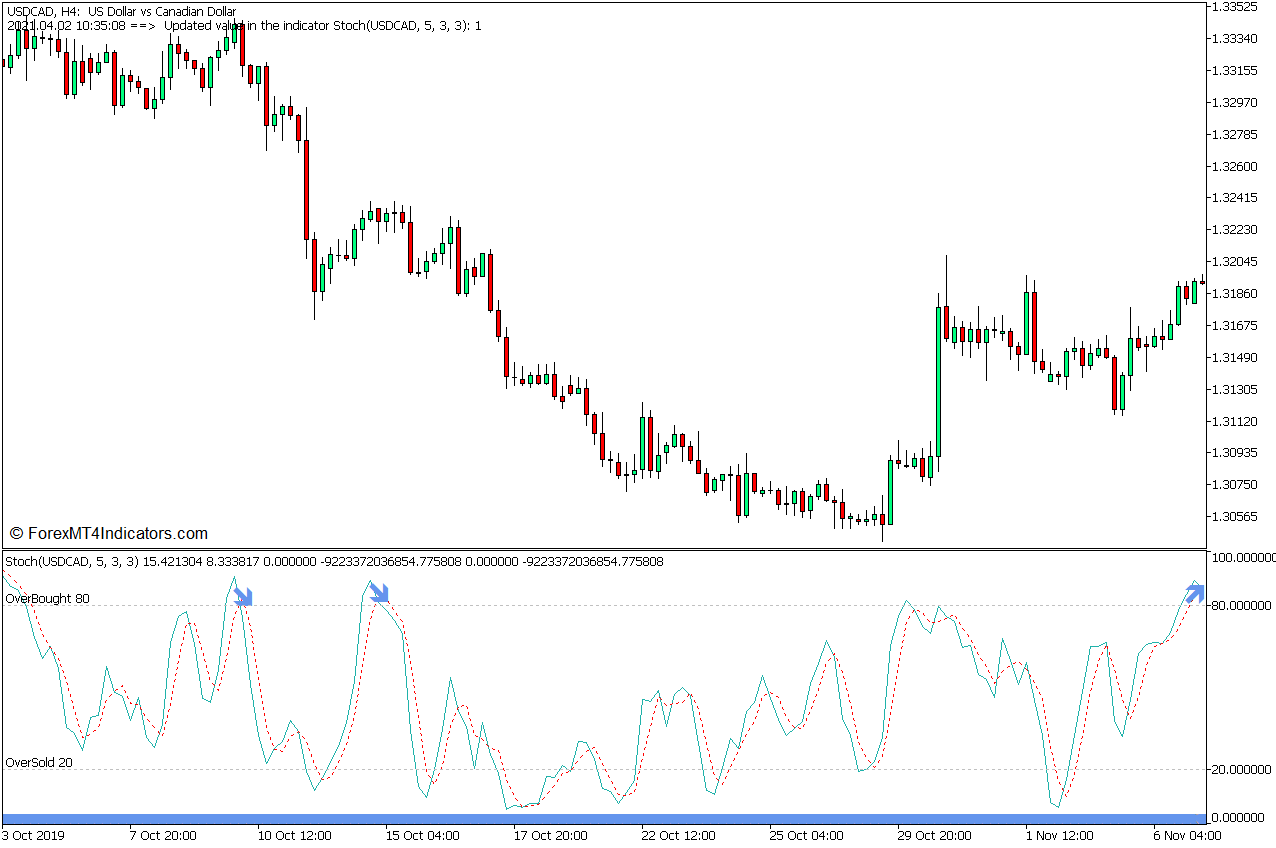
Engulfing Stochastic is a custom technical indicator based on a modified Stochastic Oscillator.
The Stochastic Oscillator is a widely used technical indicator that is typically used to identify overbought and oversold markets based on the short-term horizon. It plots two lines that oscillate within the range of zero to 100. Short-term reversals can be identified whenever the two lines cross. It also has markers at levels 20 and 80. Lines dropping below 20 indicate an oversold market, while lines breaching above 80 indicate an overbought market. Crossovers of the Stochastic Oscillator lines occurring beyond the 20 to 80 range are considered high-probability mean reversal scenarios.
The Engulfing Stochastic indicator modifies the Stochastic Oscillator by adding a mechanism wherein the indicator would indicate a signal whenever an engulfing pattern forms on the price chart while the market is either overbought or oversold.
Engulfing candlestick patterns are patterns composed of two candles wherein the body of the second candle completely engulfs the first candle. This signifies a strong price rejection which caused the market to completely reverse on the prior bar.
Trading Strategy Concept
This trading strategy is a mean reversal trading strategy that trades on reversal signals coming from a confluence of overbought or oversold market levels using the Bollinger Bands and the Engulfing Stochastics Indicator.
The Bollinger Bands will be used as a dynamic support or resistance line using the outer lines as levels where price may reverse coming from overbought or oversold price levels. This is based on price candles showing signs of reversal coming from such overextended market levels. The particular pattern we would use would be the bullish and bearish engulfing patterns.
The Stochastic Oscillator component of the Engulfing Stochastics would be used to observe overbought and oversold price levels based on the lines breaching the 30 to 70 range. The Engulfing Stochastics signals is then used to confirm the mean reversals from the Bollinger Bands outer lines.
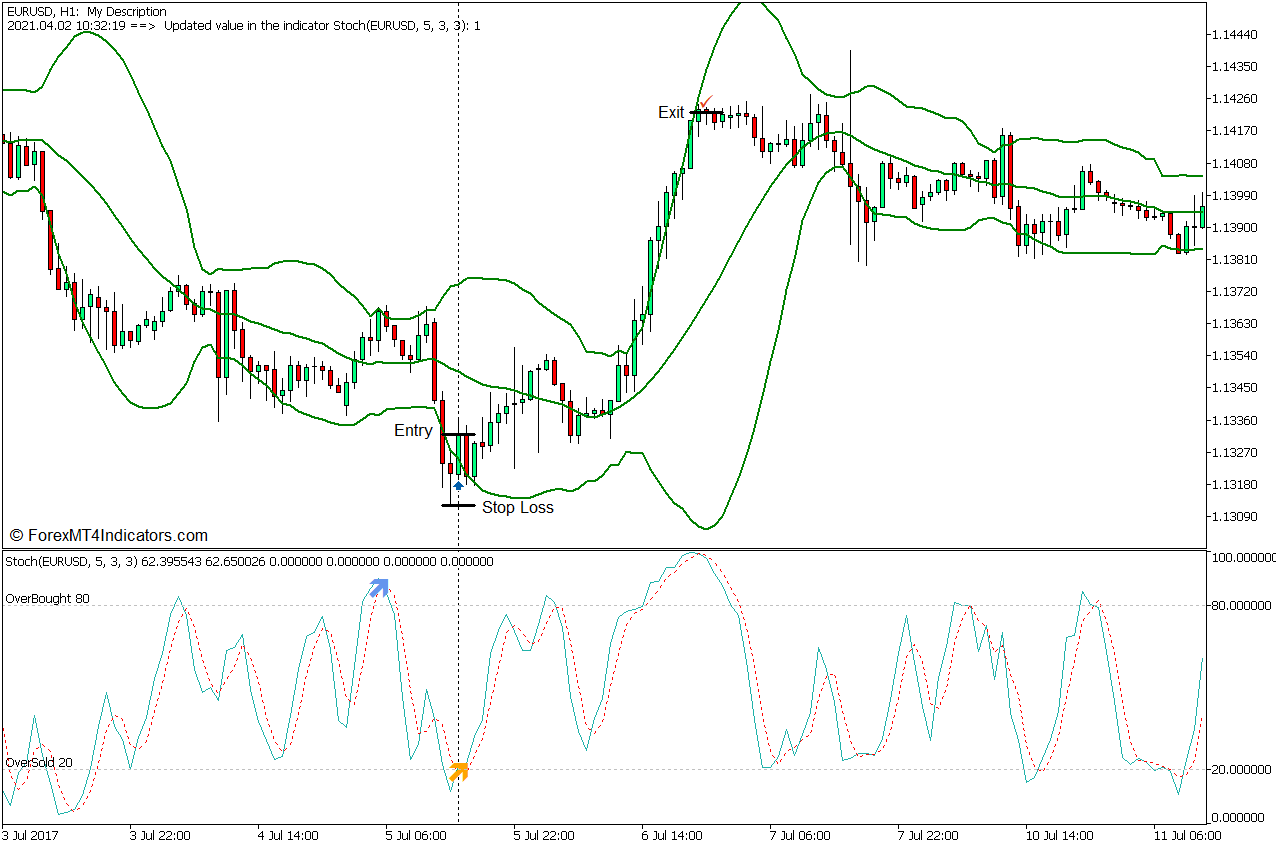
Buy Trade Setup
Entry
- Price action should touch or drop below the lower line of the Bollinger Bands.
- The Engulfing Oscillator lines should be below 20 indicating an oversold market.
- The Engulfing Oscillator should identify a bullish engulfing pattern and plot an arrow pointing up on while the lines are below 20.
- Enter a buy order on the confluence of these signals.
Stop Loss
- Set the stop loss below the bullish engulfing pattern.
Exit
- Close the trade as soon as price action shows signs of reversal while it is near the upper line of the Bollinger Bands.
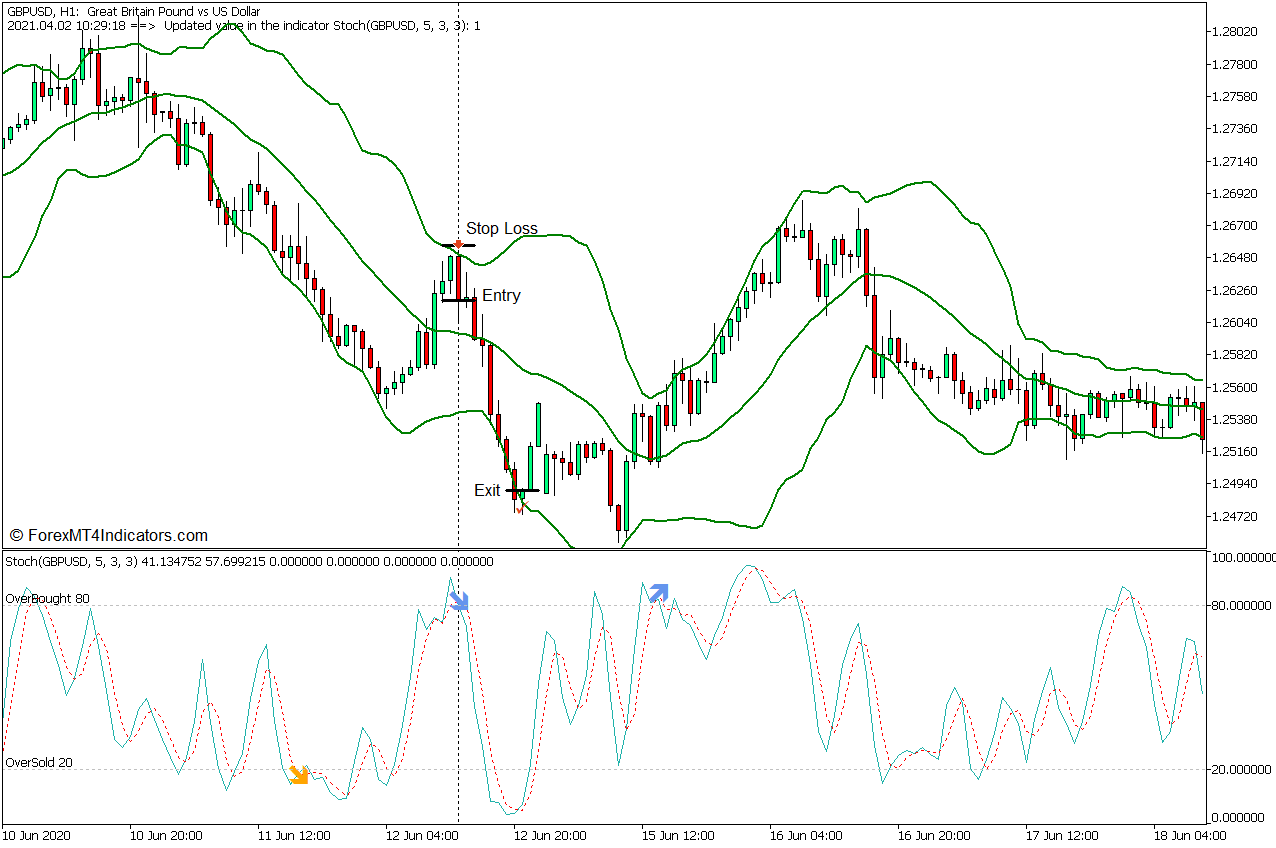
Sell Trade Setup
Entry
- Price action should touch or breach above the upper line of the Bollinger Bands.
- The Engulfing Oscillator lines should be above 80 indicating an overbought market.
- The Engulfing Oscillator should identify a bearish engulfing pattern and plot an arrow pointing down while the lines are above 80.
- Enter a sell order on the confluence of these signals.
Stop Loss
- Set the stop loss above the bearish engulfing pattern.
Exit
- Close the trade as soon as price action shows signs of reversal while it is near the upper line of the Bollinger Bands.
Conclusion
Mean reversal setups using the Bollinger Bands is a widely used mean reversal strategy. However, these setups can be risky at times since a break outside of the Bollinger Bands can also signify a momentum breakout.
This strategy stacks the probabilities in our favor by trading only when the Stochastic Oscillator indicates that the market is overbought or oversold and that the market is rejecting the level beyond the Bollinger Bands range based on an engulfing candlestick pattern.
Recommended MT5 Brokers
XM Broker
- Free $50 To Start Trading Instantly! (Withdraw-able Profit)
- Deposit Bonus up to $5,000
- Unlimited Loyalty Program
- Award Winning Forex Broker
- Additional Exclusive Bonuses Throughout The Year

>> Sign Up for XM Broker Account here <<
FBS Broker
- Trade 100 Bonus: Free $100 to kickstart your trading journey!
- 100% Deposit Bonus: Double your deposit up to $10,000 and trade with enhanced capital.
- Leverage up to 1:3000: Maximizing potential profits with one of the highest leverage options available.
- ‘Best Customer Service Broker Asia’ Award: Recognized excellence in customer support and service.
- Seasonal Promotions: Enjoy a variety of exclusive bonuses and promotional offers all year round.

>> Sign Up for FBS Broker Account here <<
Click here below to download: