


There are several factors that traders look for when making a trade. Some look for reversal signals, some look for trend direction, some look for oversold and overbought markets, while some look for deep pullbacks and price swings. Some traders would view these factors individually. However, seasoned traders know that a sound trade setup would have confluences of different technical analysis factors.
In this strategy, we will be looking at a trade setup that trades on divergences, which is a reversal type of trade setup, a mean reversal signal coming from the Stochastic RSI, yet at the same time trades a trend-biased setup based on a long-term moving average line.
Divergences as Reversal Indications
Price action typically oscillates up and down the price chart in a cyclical pattern of rallies and drops. These rallies create a peak which we call swing highs or pivot highs. The drops on the other create dips which we call swing lows or pivot lows. These swing points are prominent points on the price chart where traders can note that the market has drastically reversed.
Oscillators are types of technical indicators that tend to mirror the movements of price action on their indicator window using lines or bars that oscillate within a range or around a midline. Since oscillators mimic the movements of price action, they also typically have peaks and dips that coincide with the swing highs and swing lows on the price chart.
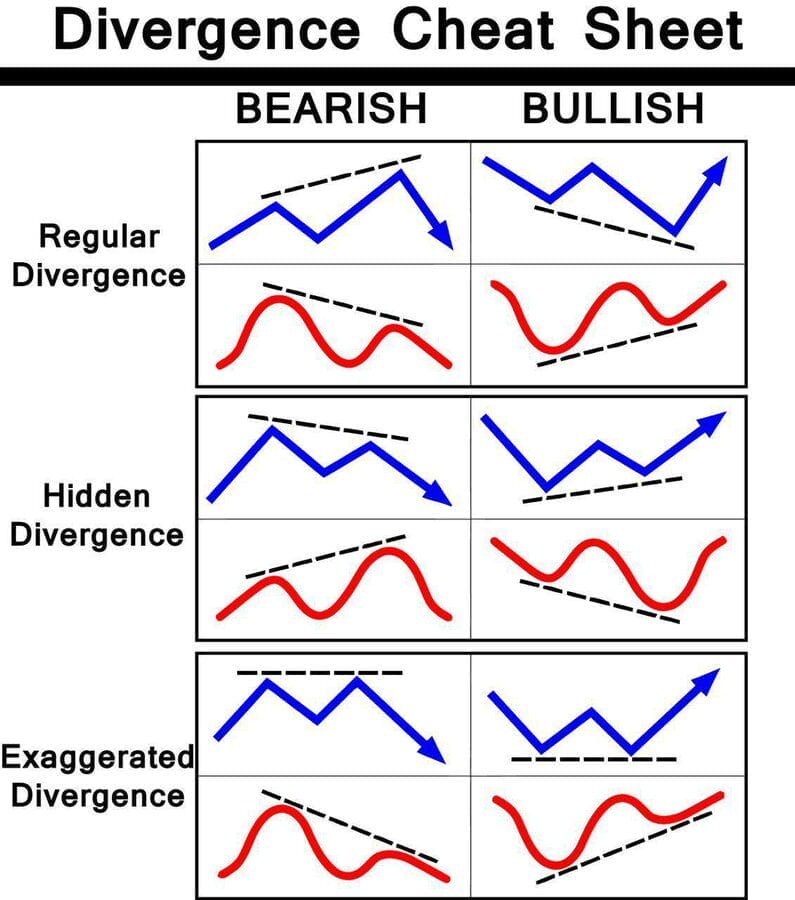
The height and depth of the peaks and dips on the oscillator also tend to have a correlation with the height and depth of the swing highs and the swing lows of price action. However, there are also many scenarios wherein the height or depth of a peak or dip on the oscillator would vary from that of the swing highs and swing lows of price action. These scenarios are what we call divergences. Such divergences are good indications of a probable reversal.
The chart below shows us the various divergence patterns that would indicate a probable reversal.
Stochastic RSI Indicator
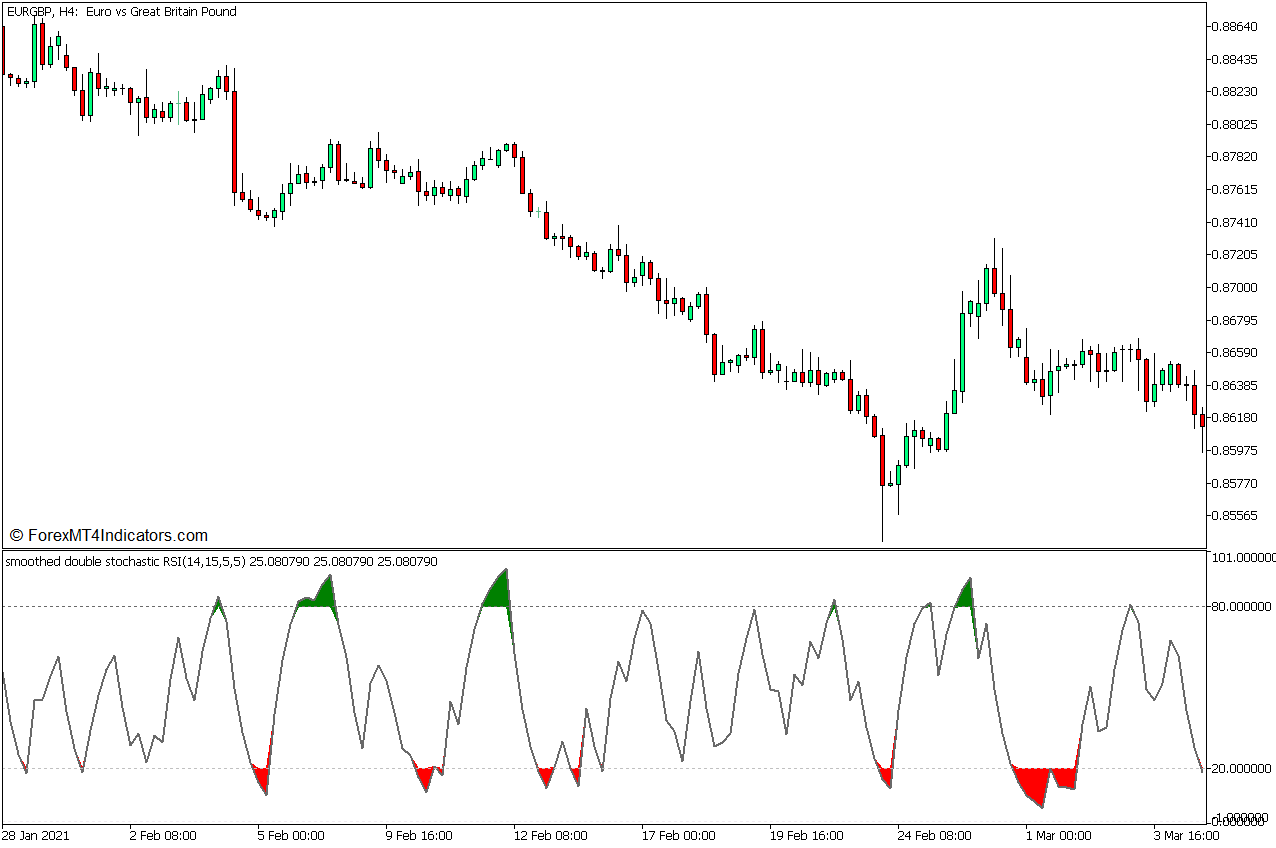
The Stochastic RSI indicator is a custom technical indicator that is based on the Relative Strength Index (RSI) and the Stochastic Oscillator.
This indicator plots an oscillator which is a modified Stochastic Oscillator of the RSI. It plots a single line that could oscillate within the range of zero to 100. This line is characteristically smooth yet is also very responsive to price changes.
The range of the Stochastic RSI has markers at levels 20 and 80 representing the oversold and overbought price levels. A Stochastic RSI line which is below 20 indicates an oversold market, while a Stochastic RSI line which is above 80 indicates an overbought market. Both scenarios are prime conditions for a potential mean reversal.
This indicator also shades the area between the oscillator line and the 20 or 80 markers to make identifying oversold and overbought markets easier. It colors the area between the line and 20 red to indicate an oversold market. It also colors the area between the line and 80 green to indicate an overbought market.
100 Simple Moving Average
Moving average lines are one of the most basic yet most effective trend indicators, which is why it is a staple indicator for most traders.
Identifying trends based on moving average lines is very simple. Uptrends can be identified with price action generally being above a moving average line with the moving average sloping up. On the other hand, downtrends can be identified with price action generally below a moving average line and a moving average line that is sloping down.
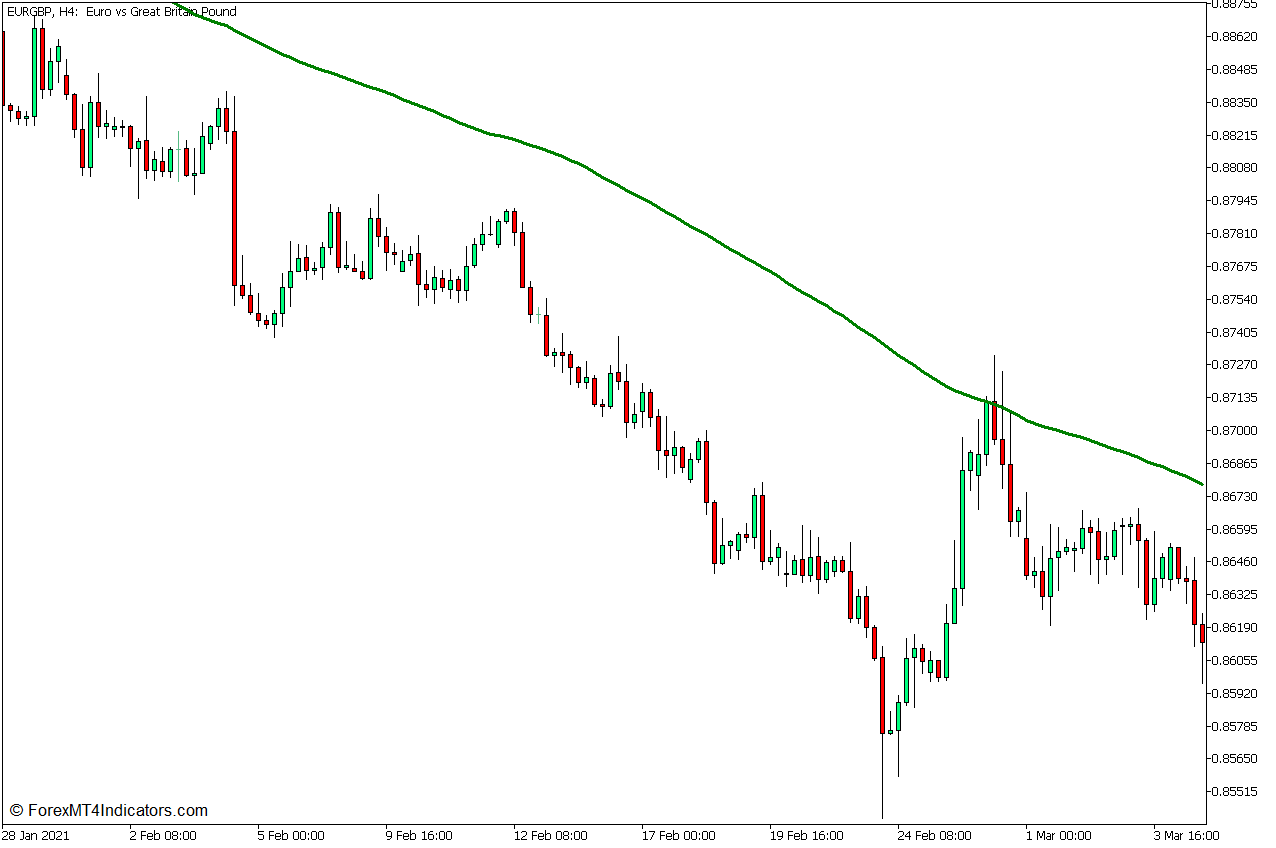
The 100-bar Simple Moving Average (SMA) line is one of the most widely used moving average lines. It is commonly used by traders for identifying mid- to long-term trend direction.
Trading Strategy Concept
This trading strategy trades reversal signals using the divergence between the Stochastic RSI line and price action. As an added filter, only divergences that have breached the 20 to 80 range would be considered as this would add a confluence of an oversold or overbought reversal. Traders should visually compare the peaks and dips of the Stochastic RSI line with the swing highs and swing lows of price action to identify divergences.
The 100 SMA line is used as a long-term trend direction filter. This allows us to isolate trades that are in confluence with the long-term trend and avoid trades that move against the long-term trend.
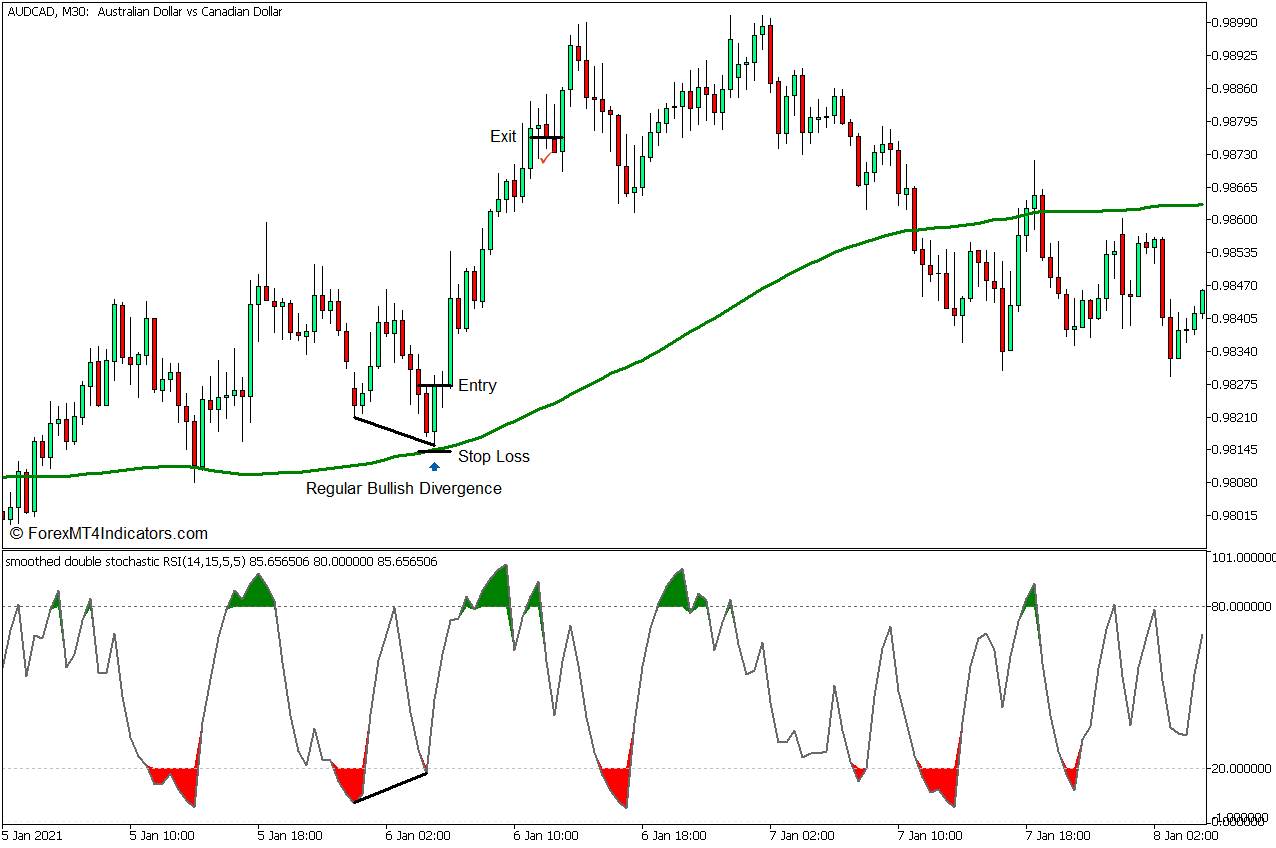
Buy Trade Setup
Entry
- Price action should generally be above the 100 SMA line while the line slopes up.
- The Stochastic RSI line should dip below 20.
- A bullish divergence pattern should develop between price action and the oversold Stochastic RSI.
- Enter a buy order as soon as the Stochastic RSI line starts to slope up and price action shows signs of a bullish reversal.
Stop Loss
- Set the stop loss on the support below the entry candle.
Exit
- Close the trade as soon as price action shows signs of a possible bearish reversal.
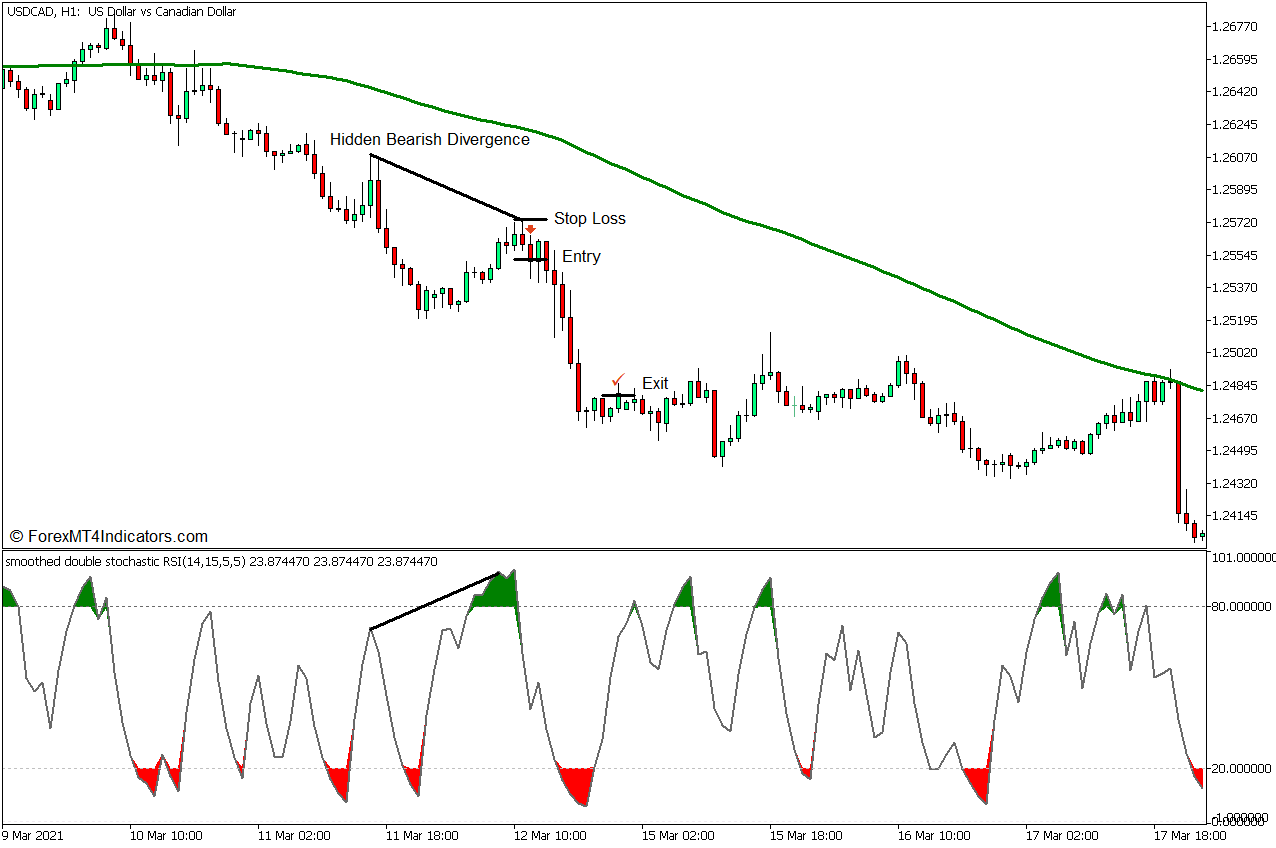
Sell Trade Setup
Entry
- Price action should generally be below the 100 SMA line while the line slopes down.
- The Stochastic RSI line should breach above 80.
- A bearish divergence pattern should develop between price action and the overbought Stochastic RSI.
- Enter a sell order as soon as the Stochastic RSI line starts to slope down and price action shows signs of a bearish reversal.
Stop Loss
- Set the stop loss on the resistance above the entry candle.
Exit
- Close the trade as soon as price action shows signs of a possible bullish reversal.
Conclusion
This trading strategy trades on deep pullbacks which can already be considered as price swings. At the same time, these setups should also conform with the direction of the long-term trend based on the 100 SMA line.
This type of strategy allows for a high probability trade setup due to the significant confluences it includes. It also allows for high-yielding trades since the trade signals are usually generated from deep pullbacks.
Recommended MT5 Brokers
XM Broker
- Free $50 To Start Trading Instantly! (Withdraw-able Profit)
- Deposit Bonus up to $5,000
- Unlimited Loyalty Program
- Award Winning Forex Broker
- Additional Exclusive Bonuses Throughout The Year

>> Sign Up for XM Broker Account here <<
FBS Broker
- Trade 100 Bonus: Free $100 to kickstart your trading journey!
- 100% Deposit Bonus: Double your deposit up to $10,000 and trade with enhanced capital.
- Leverage up to 1:3000: Maximizing potential profits with one of the highest leverage options available.
- ‘Best Customer Service Broker Asia’ Award: Recognized excellence in customer support and service.
- Seasonal Promotions: Enjoy a variety of exclusive bonuses and promotional offers all year round.

>> Sign Up for FBS Broker Account here <<
Click here below to download: