


High-probability trade setups usually have confluences between different indications and market conditions. For example, traders may look for confluences between a trend direction bias and a momentum reversal signal. The strategy discussed below shows us how we can objectively trade confluences between a market that is trending in the long term and a mean reversal signal developing in the short term.
Stochastic Oscillator
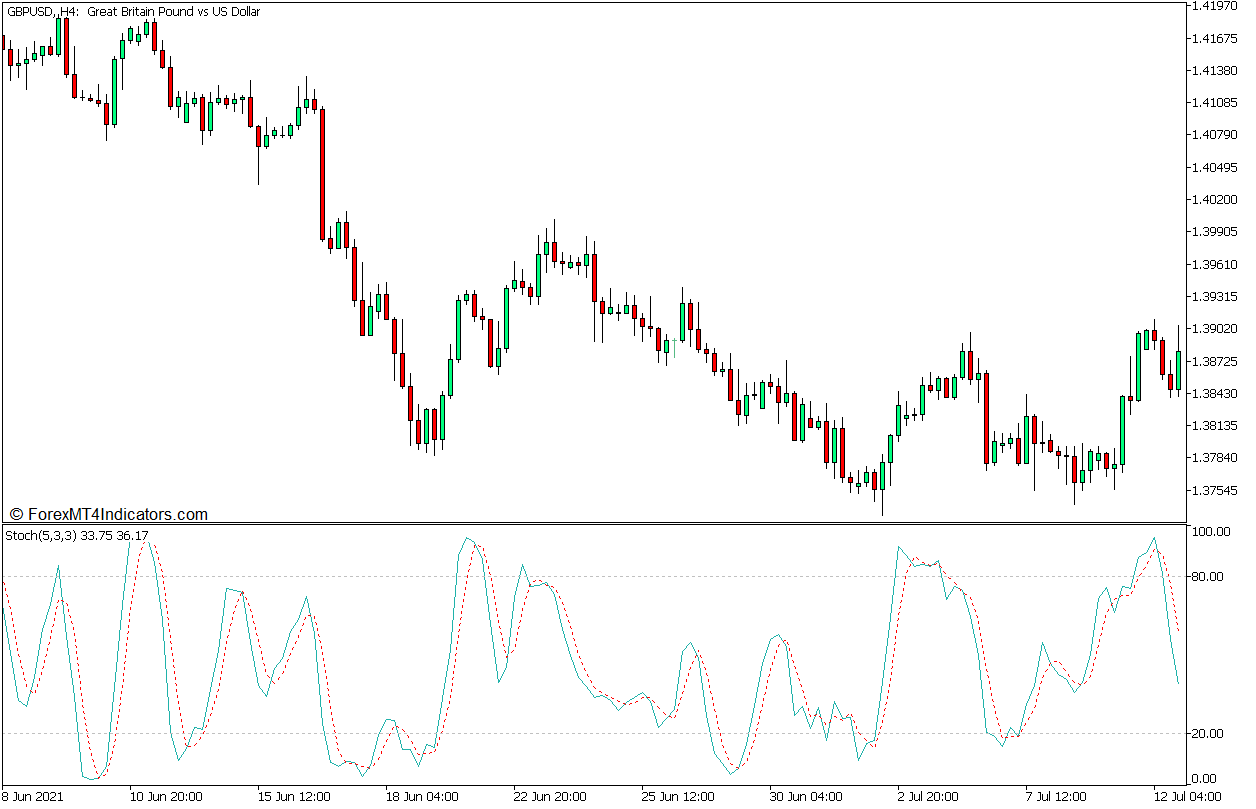
The Stochastic Oscillator is probably one of the most popular momentum oscillators that traders typically use. This is probably because of its simplicity and effectiveness.
The Stochastic Oscillator is a technical indicator that presents momentum direction using a pair of oscillating lines. It does so by comparing the closing price of a tradeable instrument, commodity, or security with its historical price data over a predetermined time window.
Specifically, the Stochastic Oscillator calculates the difference between the closing price of the current bar and the lowest low over a predetermined time window, as well as the difference between the highest high and lowest low over the same time window. It then calculates the ratio between the two and multiplies the result by 100 to normalize the data point within a range of zero to 100. The resulting data point then becomes a point on its faster oscillator line.
%K = [(Closing Price – n Period Lowest Low) / (n Period Highest High – n Period Lowest Low)] x 100
The indicator then calculates for the moving average of the faster oscillator line, which is typically set at a 3-bar period. The resulting value would then be a data point for the slower oscillator line.
%D = n-period moving average of %K
These two lines oscillate from 0 to 100 as they represent the momentum of price action.
Momentum direction is identified based on how the two Stochastic Oscillator lines interact. The momentum is bullish whenever the faster line is above the slower line, and bearish whenever the faster line is below the slower line. As such, crossovers between the two lines may be interpreted as a potential momentum reversal.
The Stochastic Oscillator may also be used to identify oversold and overbought markets. The markers at levels 20 and 80 indicate the thresholds for a normal market range. The market is considered oversold whenever the oscillator lines are below 20, and overbought whenever the lines are above 80. Given these conditions, crossovers occurring beyond the said range are considered high probably mean reversal signals.
200 Exponential Moving Average
Moving Averages are the most basic indicators used by technical analysts when it comes to identifying trend direction. Traders have several methods to identify trend direction using moving average lines. Some would use a pair of moving average lines, while others would use multiple moving average lines. Others use crossovers of moving average lines, while others would compare price action and a moving average line.
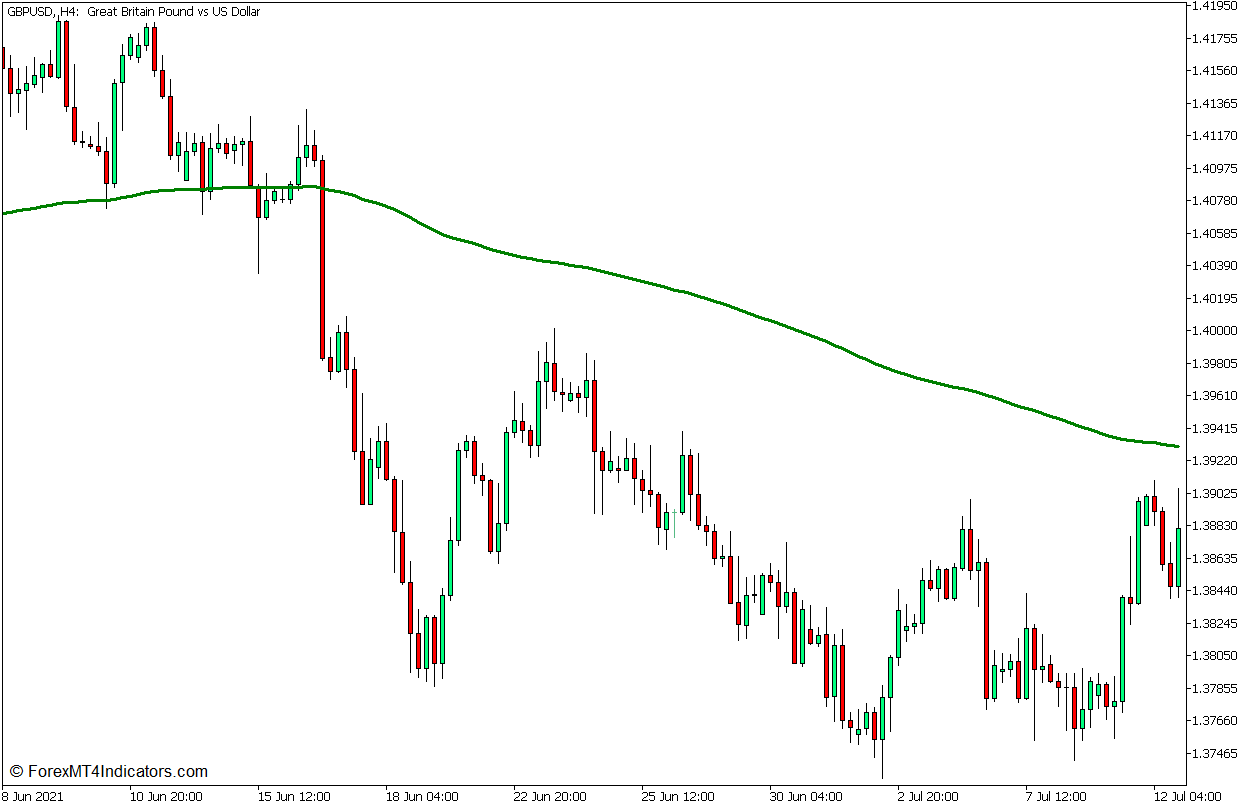
Perhaps the simplest method to identify trend direction using moving average lines is by observing the general location of price action in relation to its moving average line, as well as the slope of the moving average line. Trend direction is bullish whenever price action is above the moving average line and the line has an upward slope. Inversely, the trend would be bearish if price action is below the moving average line while the line slopes down.
The Exponential Moving Average (EMA) is a method of calculating for a moving average that places more emphasis on recent price data. This allows for a more responsive moving average line.
The 200-bar moving average line is widely used as a standard for observing long-term trend directions. This moving average line is often used by institutional traders who represent large financial institutions.
The 200 EMA line would be an excellent choice for observing long-term trend direction based on the abovementioned method.
Trading Strategy Concept
This trading strategy trades on the confluence of a long-term trend direction bias and a short-term mean reversal signal from an oversold or overbought market condition. This is done using two simple indicators: the 200 EMA line and the Stochastic Oscillator.
The 200 EMA line is mainly used to identify the long-term trend based on the location of price action in relation to the line, as well as the slope of the line. Traders should identify whether price action is generally above the line or below the line. The slope of the line typically follows where price action generally is. Trade direction is then filtered based on the direction of the long-term trend.
The Stochastic Oscillator is then used to spot oversold and overbought markets. This is based on the oscillator lines breaching beyond the 20 to 80 range. Crossovers between the fast and slow oscillator lines that occur beyond the range are considered valid mean reversal signals.
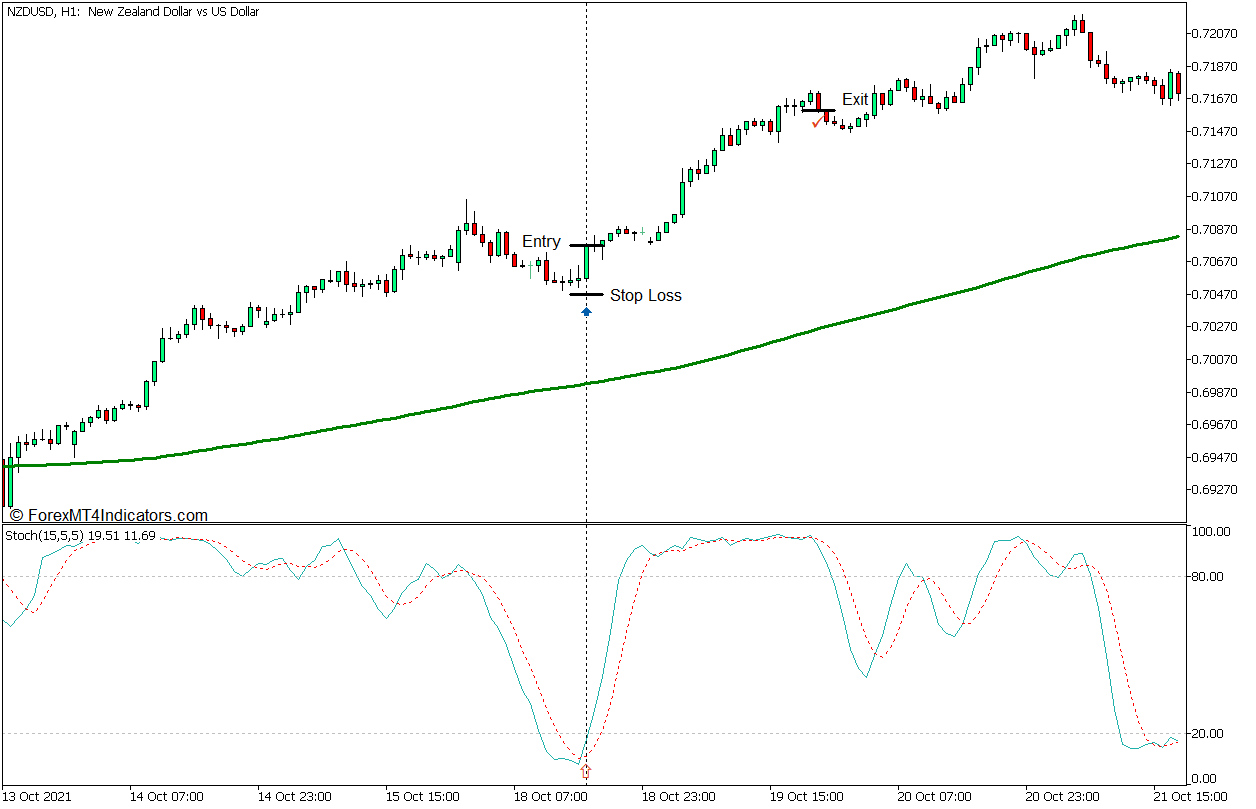
Buy Trade Setup
Entry
- Price action should be above the 200 EMA line while the 200 EMA line slopes up.
- Price action should retrace towards the 200 EMA line causing the Stochastic Oscillator lines to drop below 20.
- Open a buy order as soon as the faster line crosses above the slower line.
Stop Loss
- Set the stop loss on the fractal below the entry candle.
Exit
- Close the trade as soon as price action shows signs of a bearish reversal.
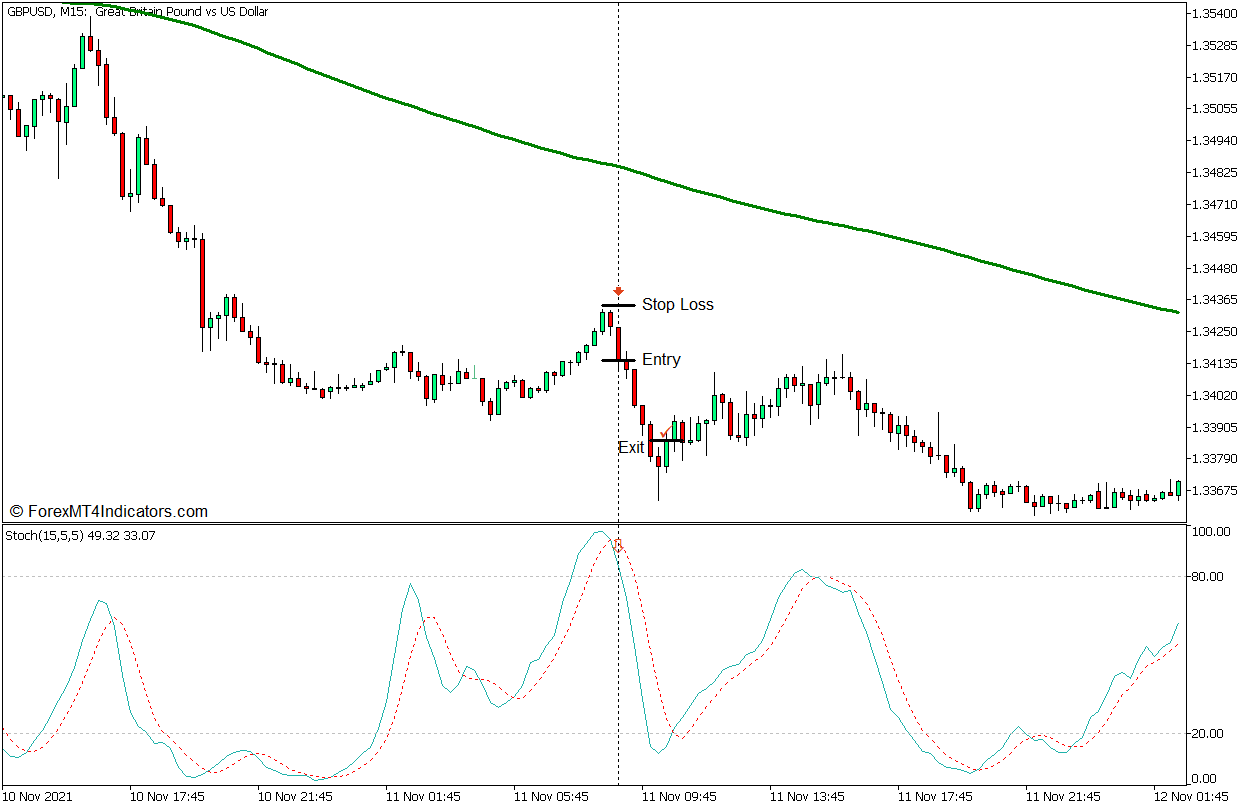
Sell Trade Setup
Entry
- Price action should be below the 200 EMA line while the 200 EMA line slopes down.
- Price action should retrace towards the 200 EMA line causing the Stochastic Oscillator lines to breach above 80.
- Open a sell order as soon as the faster line crosses below the slower line.
Stop Loss
- Set the stop loss on the fractal above the entry candle.
Exit
- Close the trade when price action shows signs of a bullish reversal.
Conclusion
The strategy discussed above can be a good supplement to other trading strategies, especially trend-following strategies that have a price action or market flow basis. Adding these objective trend directions and trade entry signals can help traders objectively identify entry points in confluence with the market structure. However, this strategy should not be used as a standalone trade signal without consideration for market structure. This is because the signals it produces may have some lag and market noise, which may cause trade entries to be mistimed when used in the wrong market context.
Recommended MT5 Brokers
XM Broker
- Free $50 To Start Trading Instantly! (Withdraw-able Profit)
- Deposit Bonus up to $5,000
- Unlimited Loyalty Program
- Award Winning Forex Broker
- Additional Exclusive Bonuses Throughout The Year

>> Sign Up for XM Broker Account here <<
FBS Broker
- Trade 100 Bonus: Free $100 to kickstart your trading journey!
- 100% Deposit Bonus: Double your deposit up to $10,000 and trade with enhanced capital.
- Leverage up to 1:3000: Maximizing potential profits with one of the highest leverage options available.
- ‘Best Customer Service Broker Asia’ Award: Recognized excellence in customer support and service.
- Seasonal Promotions: Enjoy a variety of exclusive bonuses and promotional offers all year round.

>> Sign Up for FBS Broker Account here <<
Click here below to download: