


In the dynamic world of trading, staying ahead of the curve is essential. To do this, traders employ various tools and strategies, one of which is the ATR Bands MT4 Indicator. This powerful technical analysis tool has gained immense popularity among traders for its ability to provide valuable insights into market volatility and trend strength. In this article, we will delve deep into what the ATR Bands MT4 Indicator is, how it works, and how it can be a game-changer in your trading endeavors.
Understanding the ATR Bands MT4 Indicator
What is the ATR Indicator?
Before we dive into ATR Bands, let’s understand the core component: the Average True Range (ATR) indicator. ATR measures market volatility by analyzing price movements over a specific period. It helps traders identify potential trend reversals and gauge the overall market conditions.
ATR Bands Explained
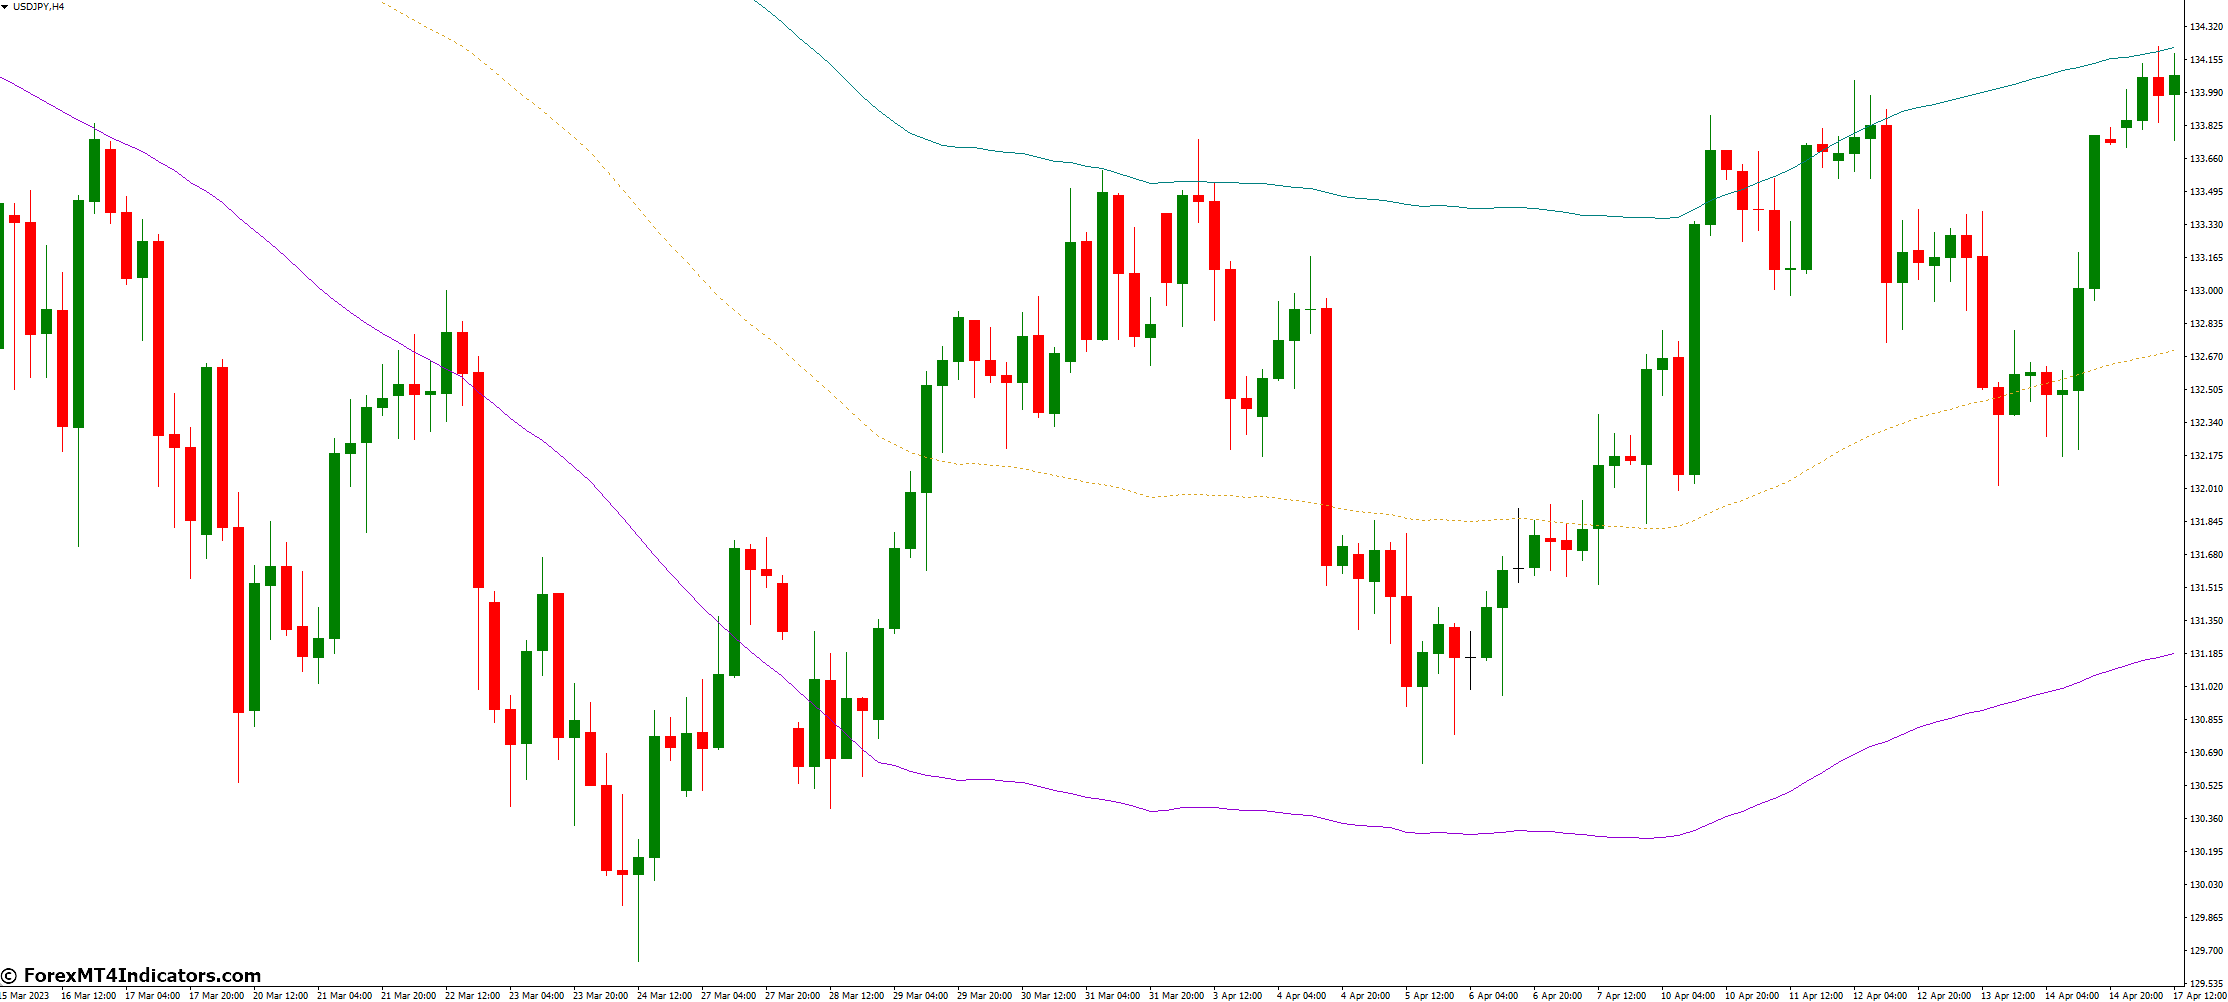
ATR Bands, an extension of the ATR indicator, are a set of bands or lines plotted on a price chart. These bands are calculated based on the Average True Range and provide traders with a visual representation of volatility. They consist of an upper band, a lower band, and a middle line, usually referred to as the ATR line.
How ATR Bands Work
Analyzing Volatility
The upper and lower ATR bands expand and contract in response to market volatility. During highly volatile periods, the bands widen, indicating increased price fluctuations. Conversely, in stable market conditions, the band’s contract signifies reduced volatility.
Identifying Trend Strength
The ATR line, situated between the upper and lower bands, offers a unique insight into trend strength. When the ATR line is rising, it indicates a strengthening trend, while a declining ATR line suggests a weakening trend.
Potential Entry and Exit Points
Traders use ATR Bands to identify potential entry and exit points. They may consider buying when prices touch the lower band in an uptrend and selling when prices reach the upper band during a downtrend.
ATR Bands in Action
Trend Confirmation
Traders often use ATR Bands to confirm the prevailing trend. If the price remains consistently above the upper band, it confirms an uptrend. Conversely, if it stays below the lower band, it validates a downtrend.
Advantages of ATR Bands
Accurate Volatility Measurement
ATR Bands provide a precise measure of market volatility, helping traders make informed decisions.
Enhanced Risk Management
By using ATR Bands for stop-loss placement, traders can effectively manage their risk and protect their capital.
Easy Integration
The ATR Bands MT4 Indicator is user-friendly and easily integrates with the MetaTrader 4 platform.
How to Trade with ATR Bands MT4 Indicator
Buy Entry
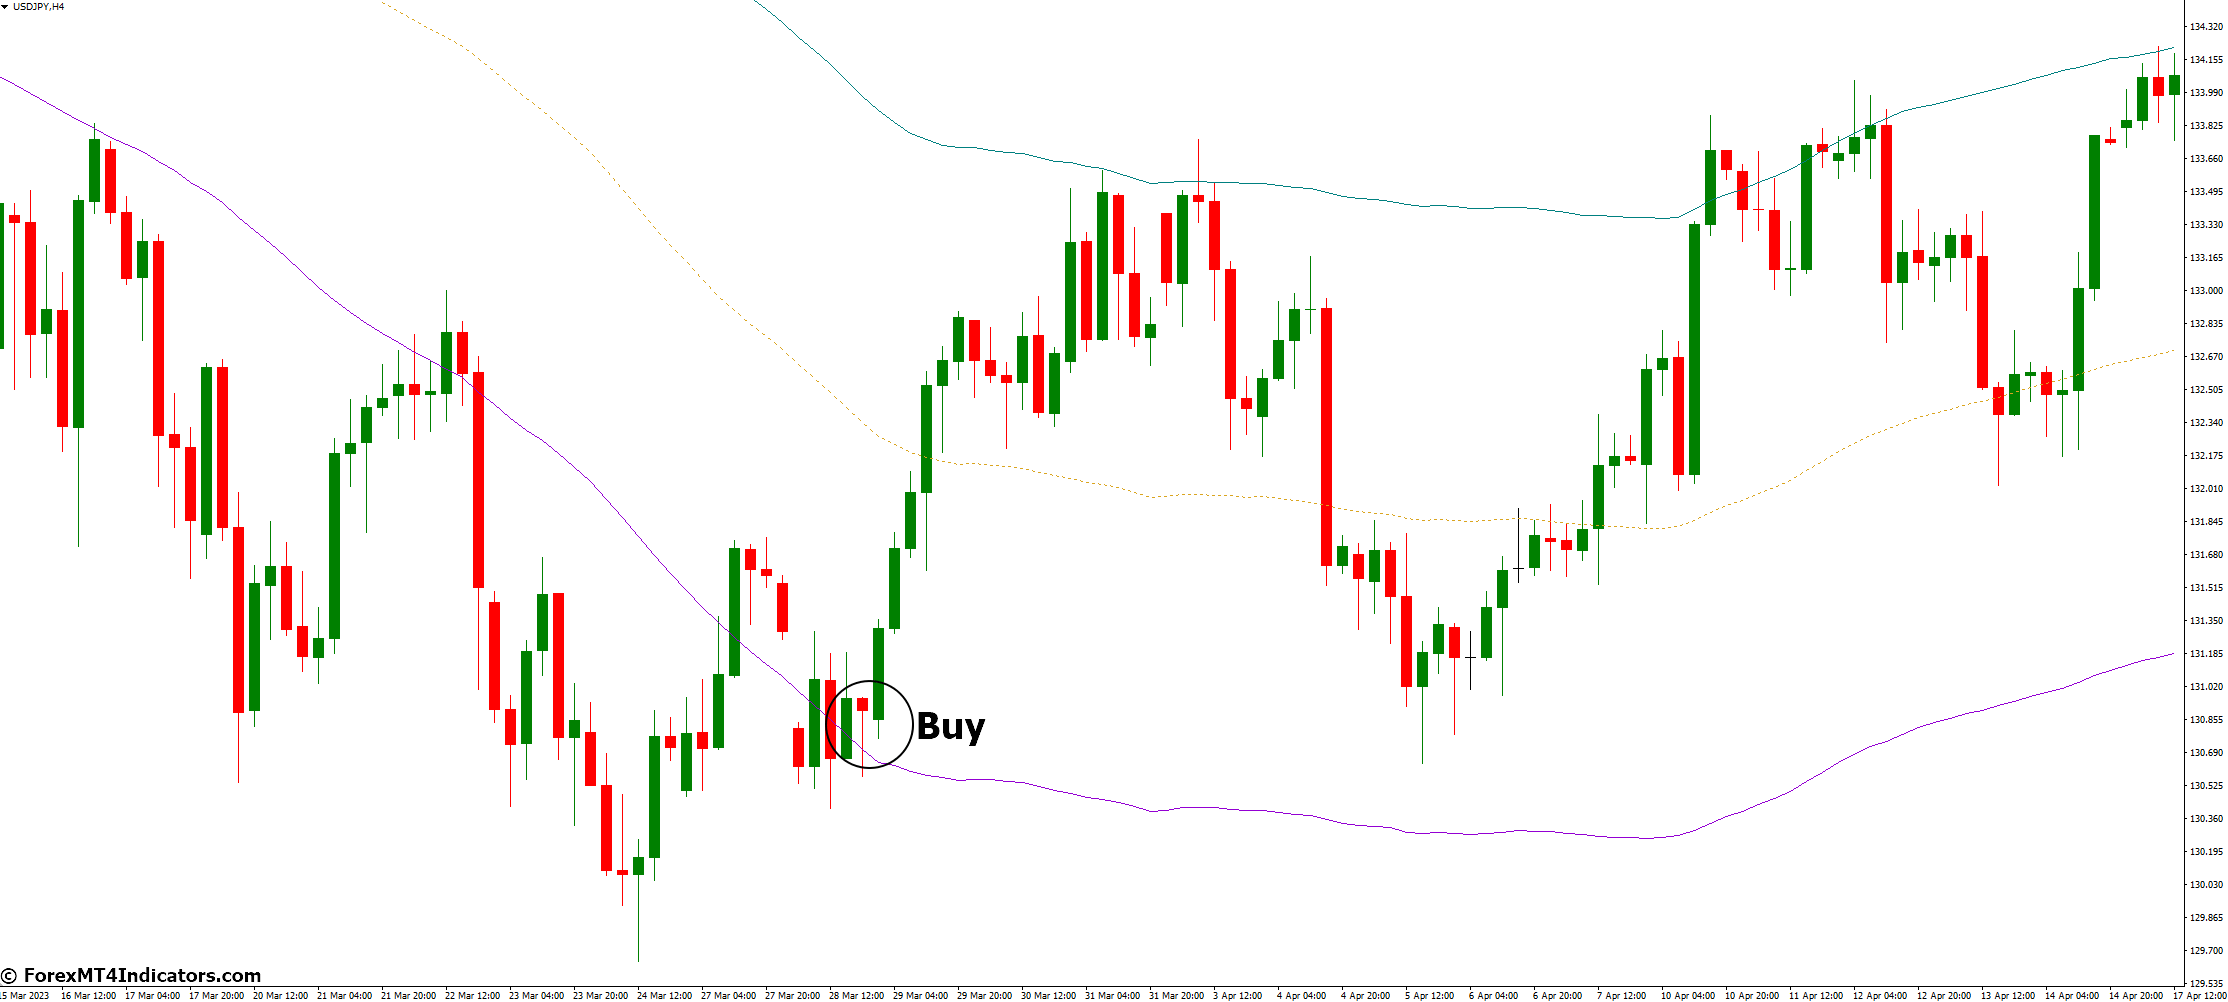
- Bullish ATR Bands Crossover (Price crosses above the lower ATR band).
- Rising ATR Line (ATR line is moving upwards).
- Rebound from Lower Band (Price bounces off the lower band in an uptrend).
Sell Entry
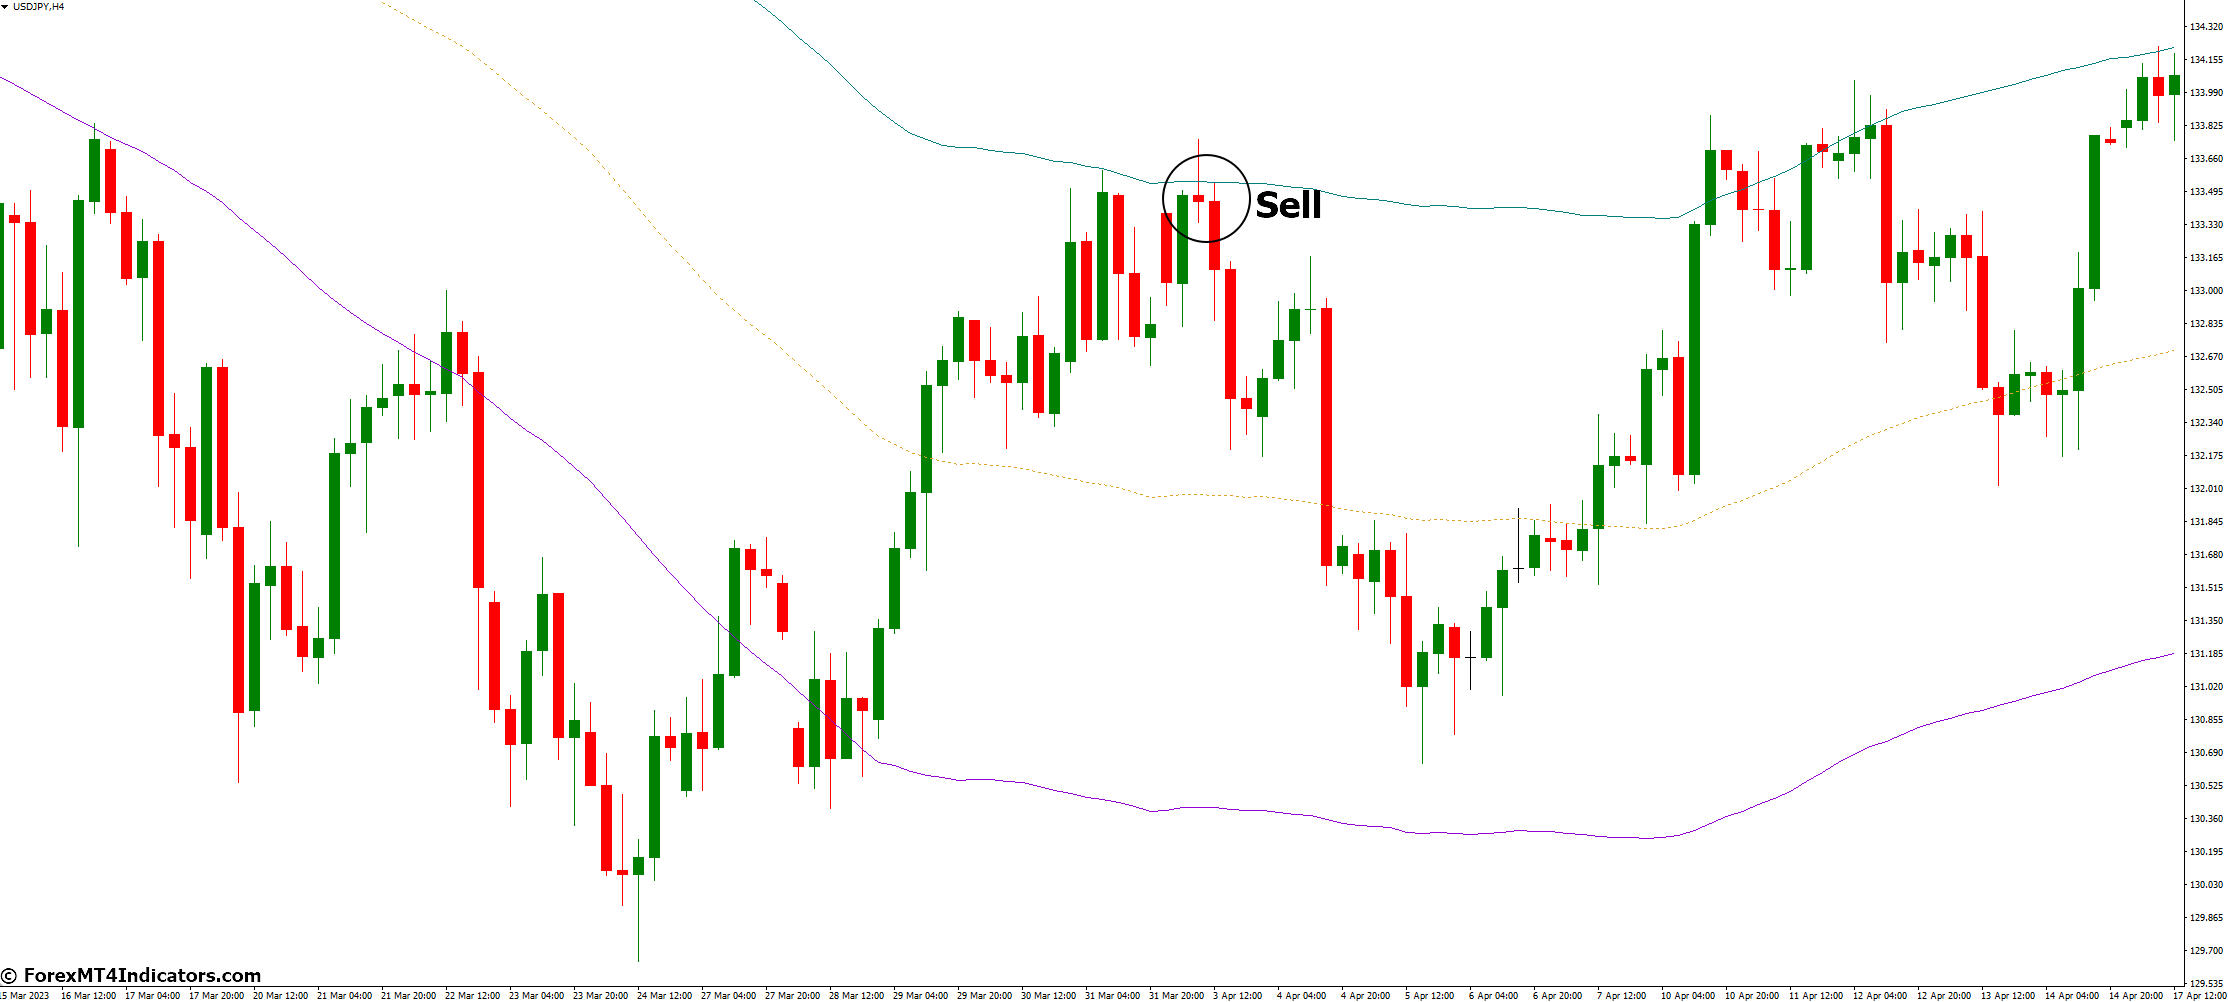
- Bearish ATR Bands Crossover (Price crosses below the upper ATR band).
- Declining ATR Line (ATR line is moving downwards).
- Rejection from Upper Band (Price gets rejected at the upper band in a downtrend).
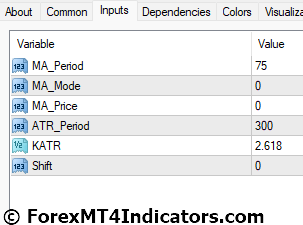
ATR Bands MT4 Indicator Settings
Conclusion
The ATR Bands MT4 Indicator is a valuable addition to any trader’s toolkit. It offers a unique perspective on market volatility and trend strength, aiding in making well-informed trading decisions. By integrating ATR Bands into your trading strategy, you can enhance your risk management and gain a competitive edge in the financial markets.
FAQs
- How is the ATR calculated in the ATR Bands Indicator?
The ATR in the ATR Bands Indicator is typically calculated as the moving average of the true range over a specified period. - Can ATR Bands be used in conjunction with other indicators?
Yes, traders often use ATR Bands in combination with other technical indicators to refine their trading strategies. - What timeframes are suitable for ATR band analysis?
ATR Bands can be applied to various timeframes, but their effectiveness may vary. It’s important to choose a timeframe that aligns with your trading strategy. - Are ATR Bands suitable for all types of assets?
ATR Bands can be applied to various assets, including stocks, forex, commodities, and cryptocurrencies. However, it’s essential to adjust the parameters based on the asset’s characteristics.
Recommended MT4/MT5 Brokers
XM Broker
- Free $50 To Start Trading Instantly! (Withdraw-able Profit)
- Deposit Bonus up to $5,000
- Unlimited Loyalty Program
- Award Winning Forex Broker
- Additional Exclusive Bonuses Throughout The Year

>> Sign Up for XM Broker Account here <<
FBS Broker
- Trade 100 Bonus: Free $100 to kickstart your trading journey!
- 100% Deposit Bonus: Double your deposit up to $10,000 and trade with enhanced capital.
- Leverage up to 1:3000: Maximizing potential profits with one of the highest leverage options available.
- ‘Best Customer Service Broker Asia’ Award: Recognized excellence in customer support and service.
- Seasonal Promotions: Enjoy a variety of exclusive bonuses and promotional offers all year round.

>> Sign Up for FBS Broker Account here <<

(Free MT4 Indicators Download)
Click here below to download: