


Overbought and oversold price levels based on the RSI line which come from price spikes which are starting to weaken tend to be very high probability reversal trade setups. However, timing the entry can be quite difficult. This is because there is often enough momentum left going against the reversal to push price against your trade when you are trading too early. This often results in a premature closing of the trade due to stop losses being hit.
Trading reversals using divergences gives us a higher probability that price would start reversing. This allows us to enter the trade just at the right time as price starts to reverse.
This strategy shows us how the confluence of these two elements can be an effective trading method to improve the trading probabilities of a reversal trade setup.
Relative Strength Index
The Relative Strength Index (RSI) is a versatile oscillator type of technical indicator which can be used in a variety of ways. It can be used to determine momentum and trend, as well as overbought and oversold market conditions.
The RSI plots a line which oscillates within the range of zero to 100. This line mimics the movement of price action based on an underlying computation of momentum based on historical price movements.
Many traders add the levels 45, 50 and 55 to help them determine trending markets. The RSI line typically stays above 50 in an uptrend market, with the level 45 acting as the support level for the RSI line. Inversely, the RSI line also stays below 50 in a downtrend, with the level 55 acting as resistance.
However, one of the main uses of the RSI would be for determining overbought or oversold price levels. An RSI range typically has markers at levels 30 and 70. The area below 30 indicates the oversold area. An RSI line dropping below 30 is indicative of an oversold market. On the other hand, the area above 70 is indicative of an overbought market and an RSI line breaching above 70 indicates an overbought market. Both overbought and oversold market scenarios are prime conditions for a potential market reversal.
Divergences
Divergences are scenarios wherein price action and its corresponding oscillator disagree in terms of the intensity of a price swing.
Price action typically swings up and down the price chart creating peaks and troughs or swing highs and swing lows. Oscillators typically mimic the movement of price action moving up whenever price action has a bullish momentum and moving down whenever there is a bearish momentum. This often creates peaks and troughs on the oscillator which somewhat mirrors that of price action.
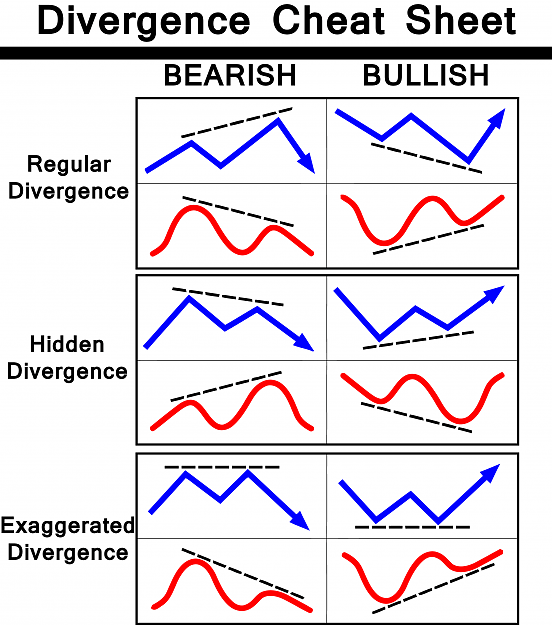
Divergences occur when the height or depth of the peaks and troughs on the oscillator varies from that of the swing highs and swing lows on price action. Below is a chart that shows the different types of divergence patterns.
These divergence patterns are high probability indications that the momentum of price might soon reverse.
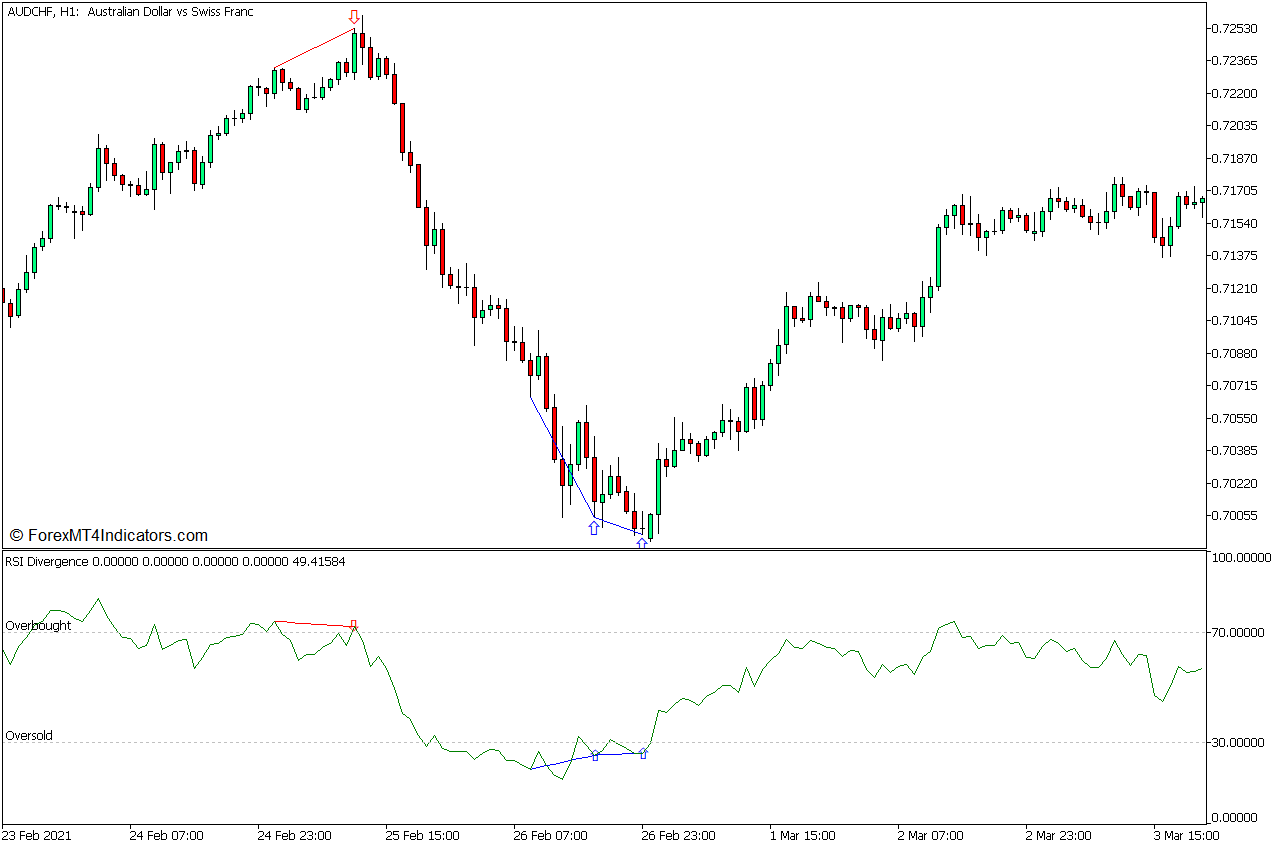
RSI Divergence Indicator
The RSI Divergence Indicator is a custom technical indicator that automatically detects divergence patterns based on the RSI. However, unlike other versions of similar types of indicators, this version of the RSI Divergence Indicator only detects divergences coming from an overbought or oversold market level. It compares the peaks and dips of the RSI line with price action after two consecutive spikes above 70 or two consecutive drops below 30. It then plots a line on the RSI line and the price swings to indicate the divergence, while also plotting an arrow to point the direction of the divergence.
Swing Highs and Swing Lows as Resistance and Support Levels
Swing highs and swing lows are areas on the price chart where the price quickly reversed from. As such, it is also very likely that price may reverse as soon as price retests these levels. This is why many traders consider major swing highs and swing lows as horizontal resistance and support levels.
Because swing highs and swing lows can act as a horizontal resistance or support level. It is a good idea to close a profitable trade when price is already near or at the support or resistance level.
Trading Strategy Concept
This trading strategy is a simple divergence based trading strategy which uses the RSI line as a basis for identifying divergences. However, instead of trading any RSI divergence, only oversold or overbought markets are considered as a valid reversal setup.
Traders should then consider price action, the price pattern at the swing high or swing low, and the actual peaks and dips if it is a valid divergence signal.
Trades are then opened using a stop entry order and closed on the next support or resistance level based on the swing highs and swing lows of price action.
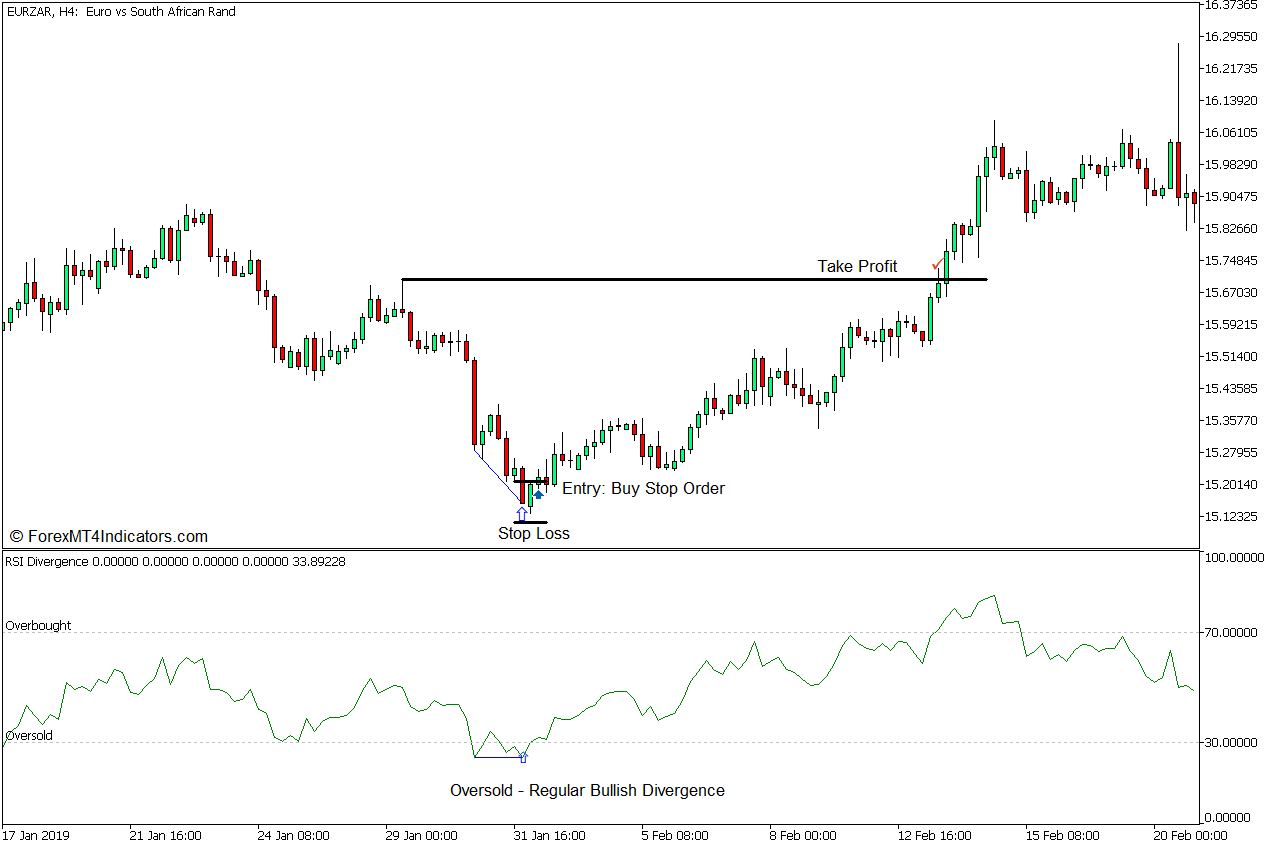
Buy Trade Setup
Entry
- The RSI line should drop below 30 indicating an oversold market.
- The RSI Divergence Indicator should identify a bullish divergence as the RSI line starts to reverse back up.
- Set a buy-stop order on the high of the candle corresponding to the bullish divergence pattern.
Stop Loss
- Set the stop loss on the support below the entry candle.
Exit
- Set the take profit on the resistance level based on the most adjacent swing high.
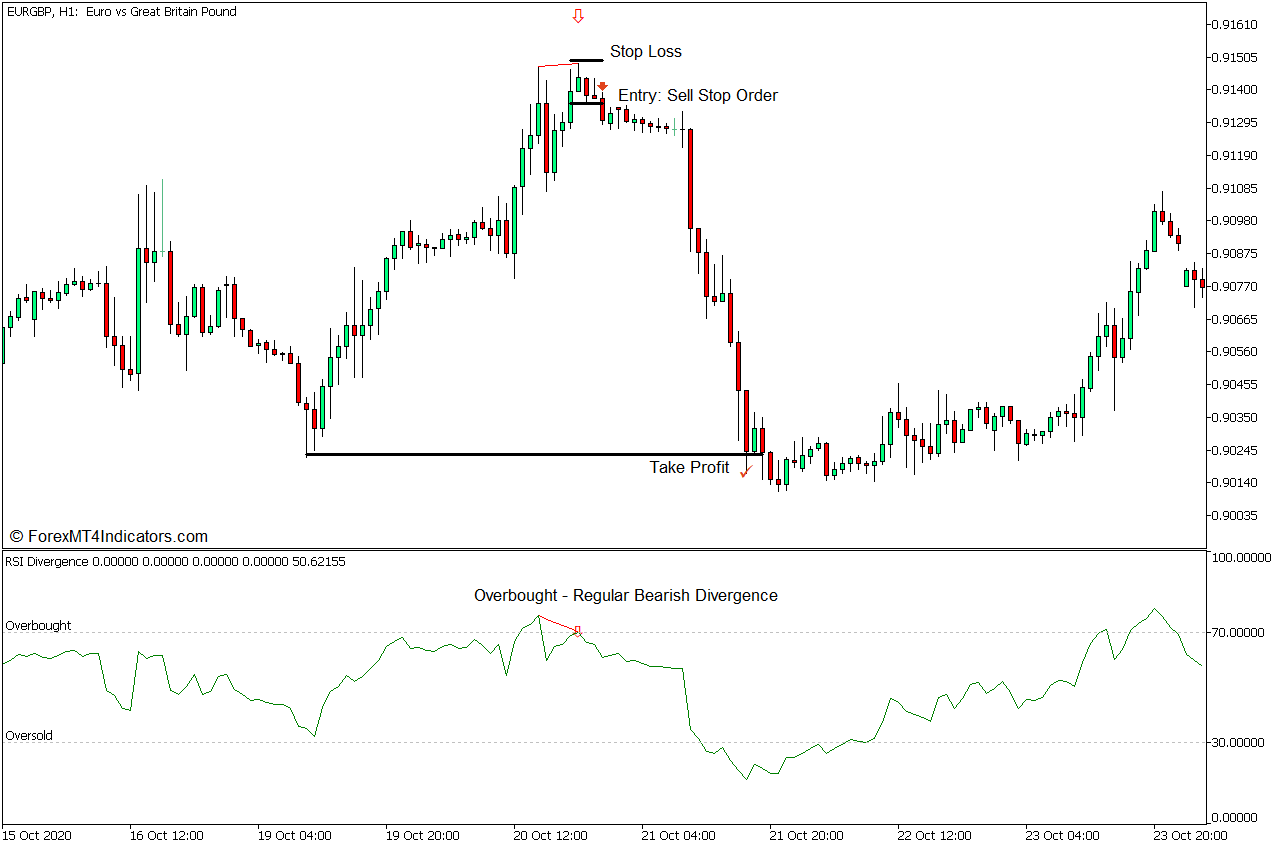
Sell Trade Setup
Entry
- The RSI line should breach above 70 indicating an overbought market.
- The RSI Divergence Indicator should identify a bearish divergence as the RSI line starts to reverse back down.
- Set a sell-stop order on the low of the candle corresponding to the bearish divergence pattern.
Stop Loss
- Set the stop loss on the resistance above the entry candle.
Exit
- Set the take profit on the support area based on the most adjacent swing low.
Conclusion
This is not a perfect trading strategy. There can be some losses along the way. This is often the nature of a reversal strategy. However, the high-yielding nature of reversal trades can allow traders to be profitable over the long run when these types of setups are mastered.
Recommended MT5 Brokers
XM Broker
- Free $50 To Start Trading Instantly! (Withdraw-able Profit)
- Deposit Bonus up to $5,000
- Unlimited Loyalty Program
- Award Winning Forex Broker
- Additional Exclusive Bonuses Throughout The Year

>> Sign Up for XM Broker Account here <<
FBS Broker
- Trade 100 Bonus: Free $100 to kickstart your trading journey!
- 100% Deposit Bonus: Double your deposit up to $10,000 and trade with enhanced capital.
- Leverage up to 1:3000: Maximizing potential profits with one of the highest leverage options available.
- ‘Best Customer Service Broker Asia’ Award: Recognized excellence in customer support and service.
- Seasonal Promotions: Enjoy a variety of exclusive bonuses and promotional offers all year round.

>> Sign Up for FBS Broker Account here <<
Click here below to download: