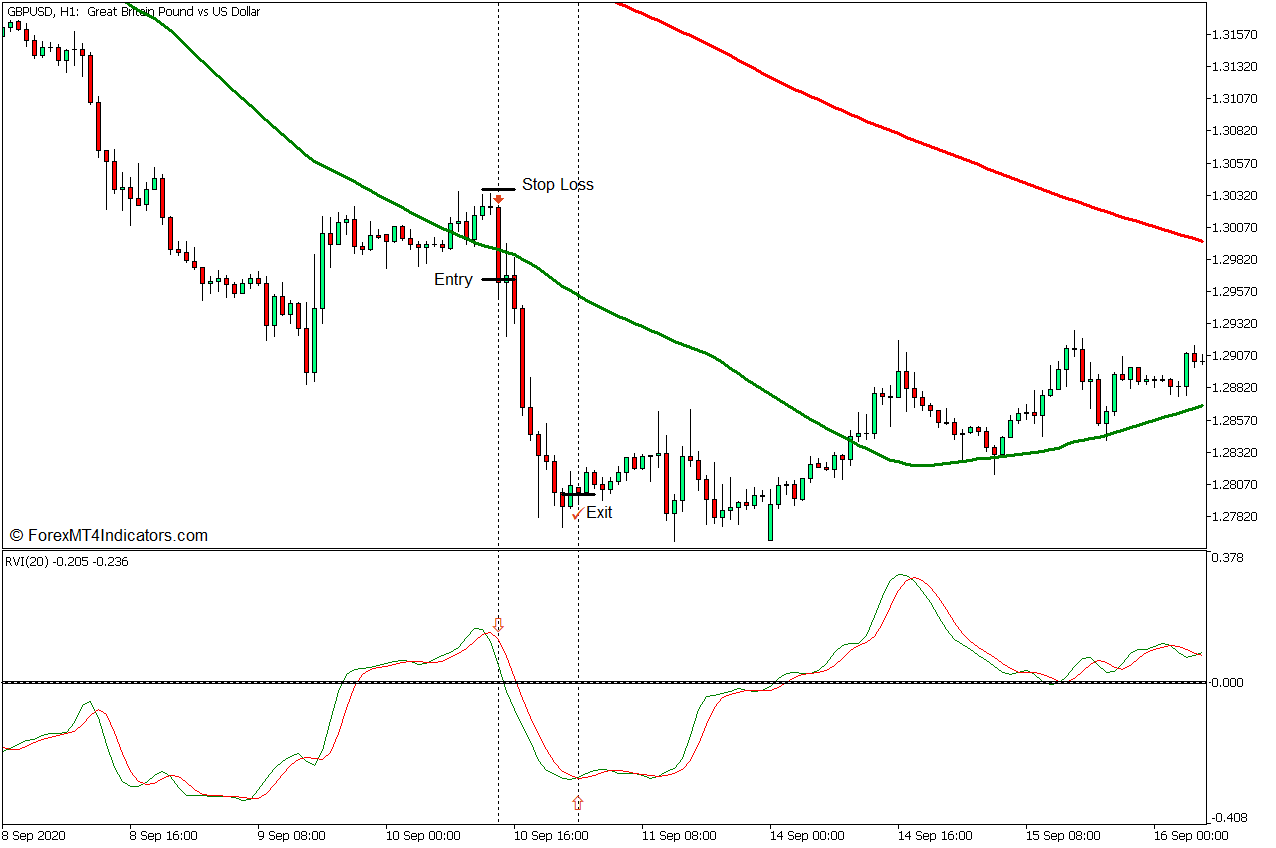
There are markets wherein if you would look at it you would realize that the market seems to have no clear direction. Some inexperienced traders would try to force their trades thinking that they could still have a chance for a profitable trade even with such conditions.
Seasoned traders on the other hand know that these types of markets should be avoided. It is not that they cannot make a profit out of it, but it is because they know their chances of making a profit out of that type of market are much like a coin toss.
Some traders on the other hand know that these markets should be avoided but often cannot decipher if they are in a market that has no clear trend direction. This is why traders need to have a concrete and objective method for identifying when the market trend is in confluence and when it is not.
This trading strategy makes use of a technical indicator which would help traders identify markets that have a conflicted short-term and long-term trend. As such, we can identify whenever the market trends are in confluence and trade accordingly.
Moving Averages as Trend Direction Indicators
Moving averages are the most basic indicators. Yet, despite its simplicity, it is still a very effective trend-following indicator.
Traders can easily identify trend directions based on the location of price action about the moving average line. On top of this, moving average lines also follow the direction of price action and so it also tends to slope in the direction of the trend.
Uptrends can be identified by price action generally being above a moving average line with a line that slopes up, while downtrends can be identified by price action generally below a moving average line while the line slopes down.
50 SMA – 200 SMA Zone
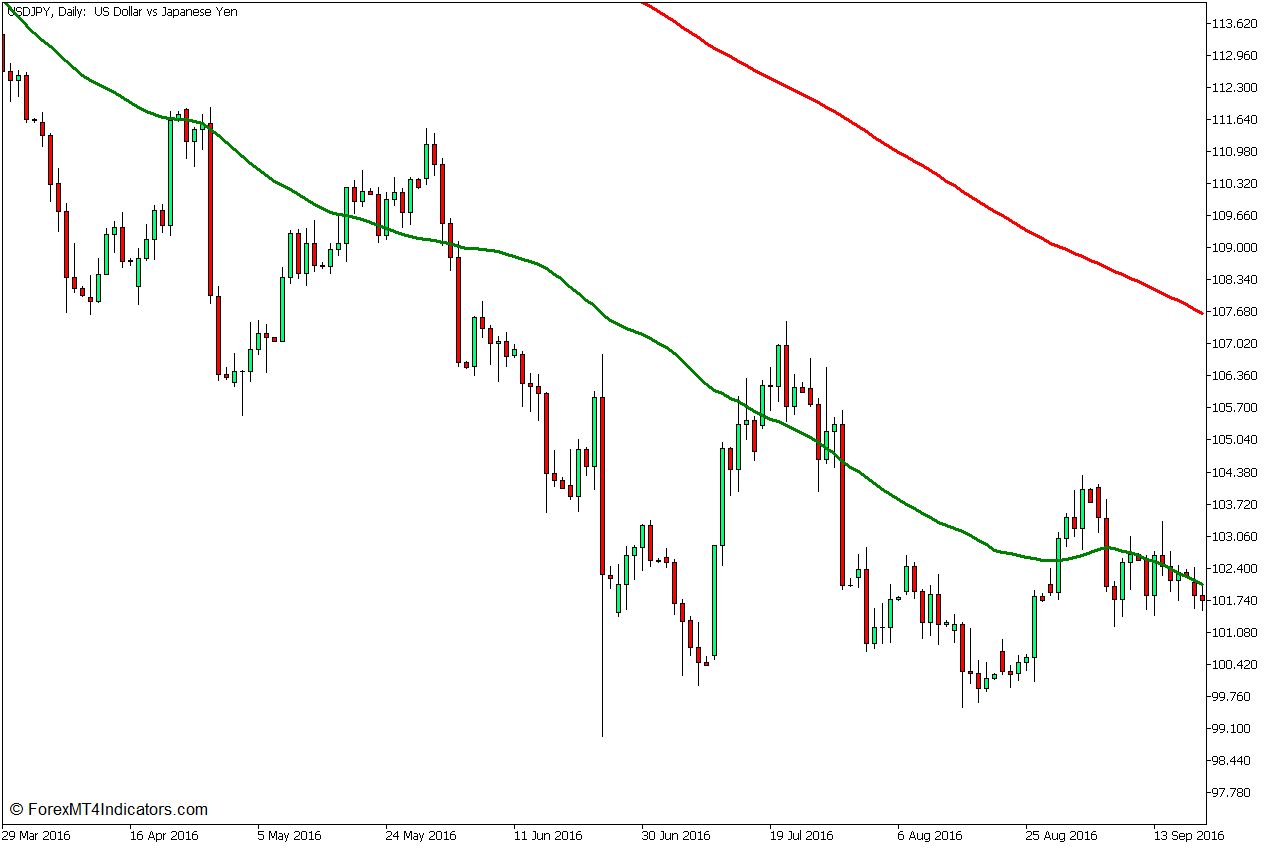
The 50-period Simple Moving Average (SMA) and the 200-period Simple Moving Average (SMA) are two of the most commonly used moving average lines. The 50 SMA line is widely used as a mid-term trend direction indicator, while the 200 SMA line is also commonly accepted as a long-term trend direction indicator.
Many seasoned traders use these two moving average lines together. They are commonly used as a trend direction filter based on how the two lines crossover and stack. These lines can also be used as dynamic support or resistance levels.
One way to use these two indicators is to interpret the direction of the market based on where the price is about the two lines. If the price is above the two lines, then the market is in an uptrend. Inversely, if the price is below the two lines, then the market is in a downtrend.
If the price is in between the two lines, then we can consider the market as being indecisive since the mid-term trend indicates one direction, while the long-term trend indicates another direction. It is best to wait for the price to crossover the 50 SMA line in confluence with the direction of the 200 SMA trend for a higher probability trade.
Relative Vigor Index
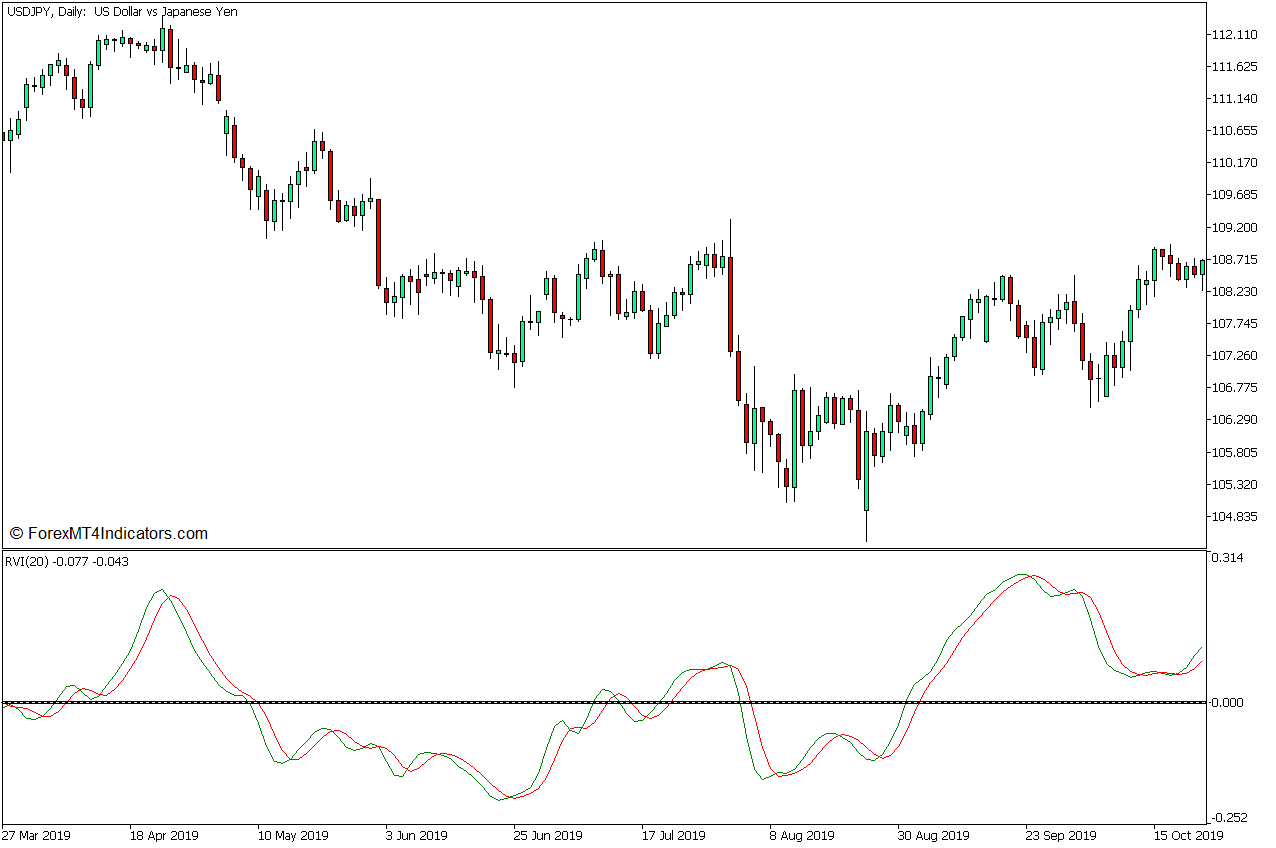
The Relative Vigor Index (RVI) is an oscillator type of technical indicator that identifies the strength of the trend or momentum by comparing the current closing price with the most recent price range.
The RVI plots two lines that oscillate around zero. Positive lines would generally indicate a bullish trend direction, while negative lines would also generally indicate a bearish trend direction.
Short-term trends or momentum could also be identified based on how the two lines cross over. Momentum is bullish whenever the faster line is above the slower line, and bearish whenever the faster line is below the slower line.
Trading Strategy Concept
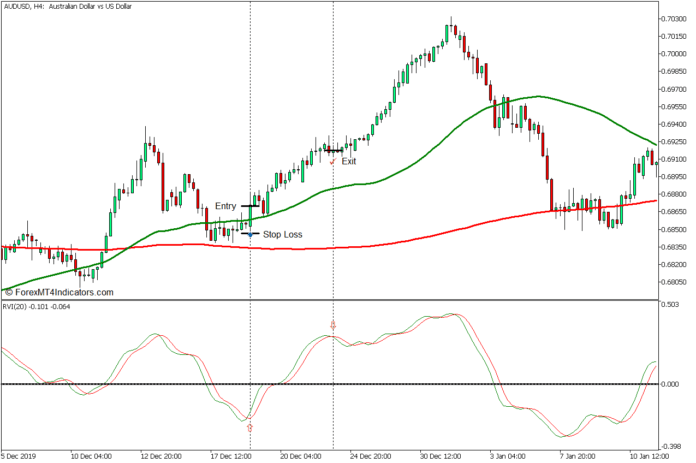
This trading strategy uses the area between the 50 SMA and 200 SMA line as a “zone of indecision”. In this zone, we would consider the market to be indecisive. As such, we will wait for price to crossover the 50 SMA line wherein the trend direction based on where price in relation to the two lines are in confluence. This would typically occur on deep pullbacks towards the 200 SMA line.
The RVI oscillator acts as a reversal signal trigger wherein trades are confirmed whenever the crossing over of price and the 50 SMA line are in confluence with the RVI line crossing over, indicating that the market has shifted momentum.
Buy Trade Setup
Entry
- The 50 SMA line should be above the 200 SMA line.
- Price action should pull back deeply towards the “zone of indecision”.
- The faster RVI line should cross above the slower RVI line as the deep retracement momentum ends.
- A bullish momentum candle should close above the 50 SMA line.
- Open a buy order on the confluence of these signals.
Stop Loss
- Set the stop loss on the support below the entry candle.
Exit
- Close the trade as soon as the faster RVI line crosses below the slower RVI line.
Sell Trade Setup
Entry
- The 50 SMA line should be below the 200 SMA line.
- Price action should pull back deeply towards the “zone of indecision”.
- The faster RVI line should cross below the slower RVI line as the deep retracement momentum ends.
- A bearish momentum candle should close below the 50 SMA line.
- Open a sell order on the confluence of these signals.
Stop Loss
- Set the stop loss on the resistance above the entry candle.
Exit
- Close the trade as soon as the faster RVI line crosses above the slower RVI line.
Conclusion
Trading based on a confluence of trend directions using the 50 SMA and 200 SMA lines allows for a high probability trend-based trade setup. Although there are scenarios in which profits can be made while the price is in between these two lines, these trades often have lower probabilities and have shorter runs since the price may reverse as it nears the 200 SMA line. As such, trading solely on the confluence of the 50 SMA and 200 SMA direction allows for high-probability trades with a potential for high yields.
Recommended MT5 Brokers
XM Broker
- Free $50 To Start Trading Instantly! (Withdraw-able Profit)
- Deposit Bonus up to $5,000
- Unlimited Loyalty Program
- Award Winning Forex Broker
- Additional Exclusive Bonuses Throughout The Year
>> Sign Up for XM Broker Account here <<
FBS Broker
- Trade 100 Bonus: Free $100 to kickstart your trading journey!
- 100% Deposit Bonus: Double your deposit up to $10,000 and trade with enhanced capital.
- Leverage up to 1:3000: Maximizing potential profits with one of the highest leverage options available.
- ‘Best Customer Service Broker Asia’ Award: Recognized excellence in customer support and service.
- Seasonal Promotions: Enjoy a variety of exclusive bonuses and promotional offers all year round.
>> Sign Up for FBS Broker Account here <<
Click here below to download:


