


Ozzy Forex Trading Strategy
Oscillators are a pretty common type of indicator used by many traders. Various types with different computations, different features and advantages. But what is it really?
Oscillating type of indicators are indicators that are usually displayed in a separate window. It usually displays lines or bars which usually oscillates up and down a middle line, usually zero, thus it is called an oscillating indicator. These oscillating indicators are usually derived from a complex formula which results should instruct the computer to plot a line around the zero line. But what does these formulas and line really mean?
Usually, these formulas are derived from various computations of the mean or a difference of two or more means. Having this in mind, we could say that oscillating indicators are derivative of crossover strategies. This is probably the reason why like many crossover strategies, using oscillating indicators as a sole strategy for entries and exits could usually be counterproductive. This is because, like crossover strategies, the exits of oscillating indicators are usually a little too late. Even though the trade did have a period when it was profitable, but greed would often cause us traders to hold on and wait for the peak, or for the reversal of the indicator before we exit. Sometimes, the exit is back on the negative.
Another reason is probably because using oscillating indicators alone, which usually refer to the short-term trend, might cause traders to overlook the importance of the longer-term trend. We have to take trades based on short-term based oscillating indicators in relation to the bigger picture, the main trend.
The Setup: The OsMA Oscillating Indicator Strategy
For this strategy, what more best way to prove our point regarding oscillating indicators being derivatives of moving average crossovers than the Oscillating – Moving Average (OsMA). This will be our main entry signal indicator. A cross over the zero line is also tantamount to a crossover of a moving average, thus it also signifies a change in the short-term trend. As the OsMA reflects the first positive bar, we get a buy signal. As the OsMA reflect the first negative bar, we get a sell signal.
But before we fire our shots, we have to screen our trades first. To have a higher probability trade, we should be trading in the direction of a higher timeframe trend. To determine our trend, we will be using the 50 Exponential Moving Average (EMA). This is a moving average that many traders refer to to determine the bias of the trend.
Lastly, we have to be able to set our Reward-Risk Ratio by being able to determine our stop loss and take profit. This would ensure us that we have a positive Reward-Risk Ratio giving us half the battle done. For this, we will use the Bill Williams’ Fractal indicator. This is an indicator that gives us a pseudo minor low or high, which is a smart area to put our stop loss on. Then, as we have determined our stop loss, we will base our take profit on the stop loss distance to give us a fixed Reward-Risk Ratio.
Buy Setup:
- Price should be above the 50 EMA (gold)
- Enter a buy market order on the close of a candle corresponding a cross above the zero OsMA
Stop Loss: Set the stop loss at the low of the most recent low fractal
Take Profit: Set the take profit at 1.5x the stop loss in pips
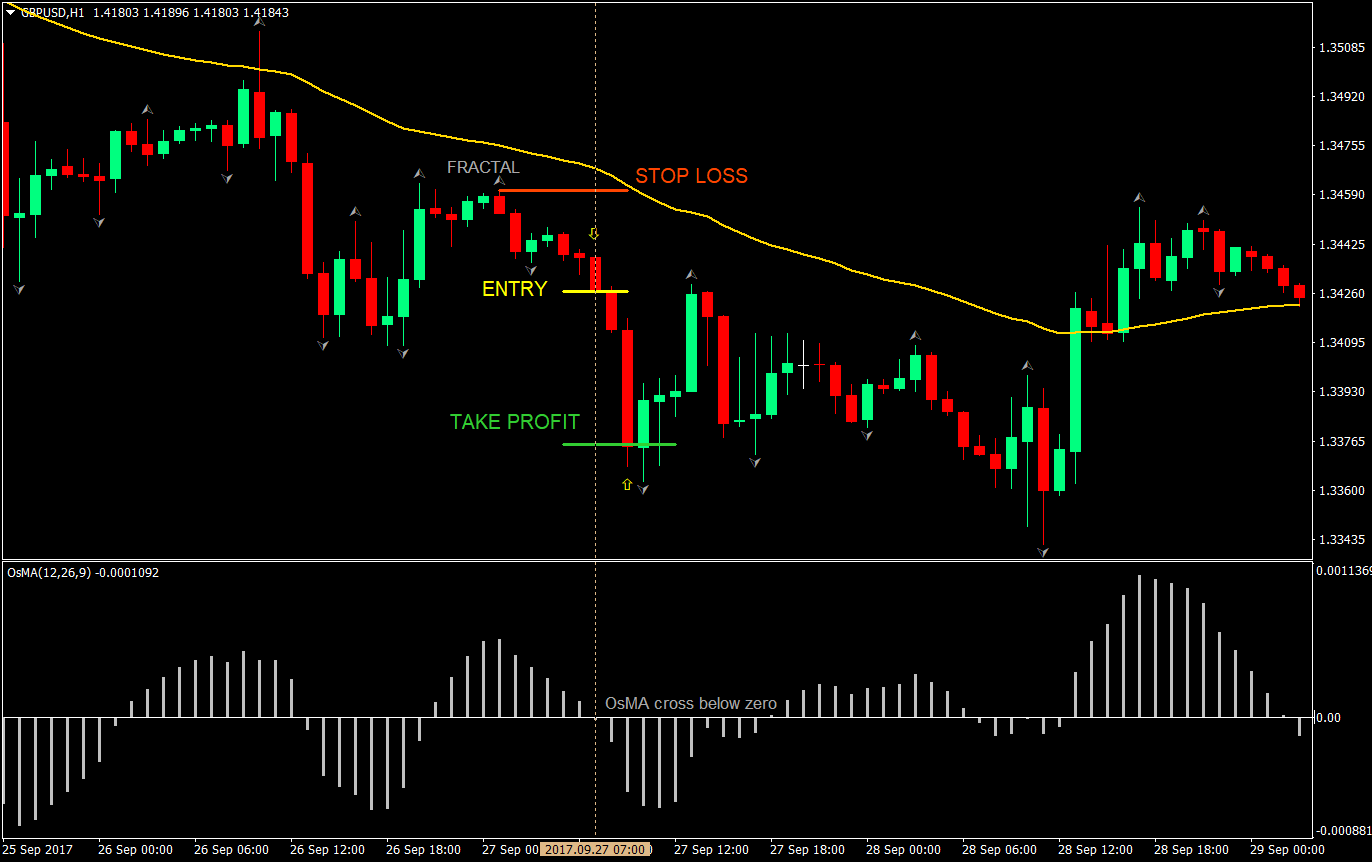
Sell Setup:
- Price should be below the 50 EMA (gold)
- Enter a sell market order on the close of a candle corresponding a cross below the zero OsMA
Stop Loss: Set the stop loss at the high of the most recent high fractal
Take Profit: Set the take profit at 1.5x the stop loss in pips
Conclusion
The OsMA indicator is a classic example of how to use an oscillating indicator as a basis for an entry. This is a logical idea since most, if not all oscillating indicators, are derivatives of moving average crossovers. If we use crossover strategies as a basis for our entry, then we could also use oscillating indicators, such as the OsMA, as a basis for entries.
However, the crucial part here is not to wait for the OsMA to reverse. On the first setup, the buy setup, we could have gained more if we waited for the OsMA. However, on the second setup, the sell setup, you would notice how we would have given up most of the profits if we waited for the OsMA to reverse. This shows how the same weakness that crossover strategies have carries over to strategies with entries and exits based on the oscillating indicator alone. By limiting our take profit to 1.5x, we not only fix our reward-risk ratio to 1.5, we have also defused that greed which cause us to give most of the profits back to the market. This an area however, which you could tweak to your liking. The higher the reward-risk ratio, the higher the risk of not reaching the take profit.
Recommended MT4 Broker
- Free $50 To Start Trading Instantly! (Withdrawable Profit)
- Deposit Bonus up to $5,000
- Unlimited Loyalty Program
- Award Winning Forex Broker
- Additional Exclusive Bonuses Throughout The Year

>> Claim Your $50 Bonus Here <<
Click here below to download: