


Ozzy Retrace Scalping Forex Trading Strategy
Sometimes, looking at the market differently than the rest of the market helps. Looking through a different lens allows us to see the market differently. This could mean we could see things happening before the market sees it.
Today we will be looking at using oscillator indicators in a different way.
Most traders use oscillating indicators to identify overbought and oversold market conditions. This a pretty straight forward mean reversion type of strategy. Buy when price is too low, sell when price is too high. Very logical and effective.
But what if we could use oscillating indicators to trade with the trend instead of looking for the trend to reverse? Yes, we could do that with a little bit of tweaking.
The oscillating indicator we will be looking at will be the Relative Strength Indicator (RSI). Normally, traders use it to determine overextended prices. If the RSI is above 70, the market is said to be overbought. If it is below 30, then the market is said to be oversold. But I find that this is not the only way to look at RSI. Instead, in a bullish bias market, we will be looking first for RSI to drop, before it continues its bullish trend.
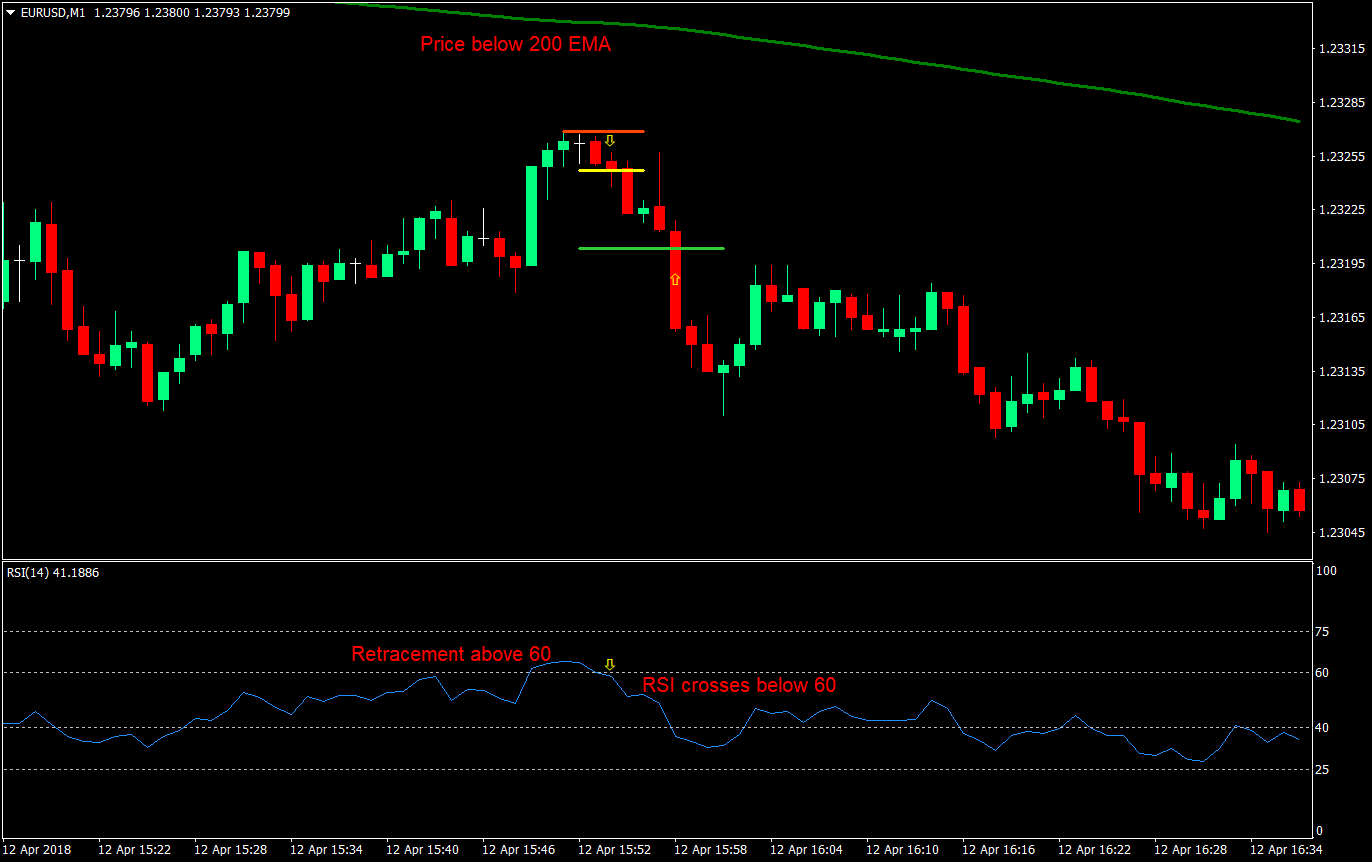
The Setup: Ozzy (RSI) Retrace Scalping Strategy
Since this is a scalping strategy, we will be using the 1-minute chart exclusively. For those who are not yet adept to quick trading, you may use the 5-minute chart, however that would already border more towards a day trade type of time frame. There will be advantages and disadvantages for both timeframes though. The 1-minute chart will have more noise, but personally I find it easier to predict due to the short span of time I hold the trade on this timeframe. The 5-minute chart will have less noise, but I find that many things could happen that could reverse the market sentiment during the span of time I hold trades on the 5-minute chart. Each to his own though.
Before we jump into how we will use the RSI, let’s first discuss how we will determine the bias of the long-term trend, which will be the direction of our trade. To identify the direction of the long-term trend, we will be using the 200 Exponential Moving Average (EMA). This is a moving average that many traders use to determine the long-term trend. The 200 EMA will be our green moving average. If price is above the 200 EMA, we will be looking for long trades. If price is below the 200 EMA, then we will be looking to short the market.
Now, onto the RSI. Remember, that we are looking for retracements. So, we won’t be looking for overbought or oversold market conditions. In fact, we will be avoiding trades where the RSI has gone above 75 on a short trade or below 25 on a long trade. This might already mean that the momentum going that direction is already too strong. On a long (buy) trade, what we will be looking for is for the RSI to go below 40 but not below 25. That will be our retracement. Then we wait for the RSI to go back above 40, which will be our signal candle. On the other hand, on a short (sell) trade, we will be looking for RSI to go above 60 but not above 75, indicating a retracement. Then, we enter the trade as the RSI goes below 60.
Buy Entry:
- Price should be above the 200 EMA (green moving average)
- The RSI should go below 40 but not go below 25
- Wait for the RSI to go back above 40
- Enter at the close of the candle corresponding to when the RSI crosses above 40
Stop Loss: Set the stop loss at the swing low generated by the bullish price thrust
Take Profit: Set the take profit at 2x the risk on the stop loss
Sell Entry:
- Price should be below the 200 EMA (green moving average)
- The RSI should go above 60 but not go above 75
- Wait for the RSI to go back below 60
- Enter at the close of the candle corresponding to when the RSI crosses below 60
Stop Loss: Set the stop loss at the swing high generated by the bearish price thrust
Take Profit: Set the take profit at 2x the risk on the stop loss
Conclusion
By trading retracements using an oscillator indicator, we are able to quantifiably determine if price has retraced to a specific figure which we think is a considerable retracement. This allows us to enter at a reasonable price, but still trade with the trend.
By waiting for price to close back inside our RSI middle area, which is below 40 & 60, we are also waiting for the normal market condition of the forex pair we are trading, which is a trending market condition. This means, using our parameters, that the retracement has ended, and the direction of the trend bias has resumed.
The parameter that could be tweaked though, depending on your risk averseness or aggressiveness, will be the take profit multiple. You could raise the take profit multiple to 3x or more, depending on your risk appetite. It would mean a higher reward-risk ratio, but you would also be giving up on your win ratio. Try to find the right mix though for your risk appetite.
Recommended MT4 Broker
- Free $50 To Start Trading Instantly! (Withdrawable Profit)
- Deposit Bonus up to $5,000
- Unlimited Loyalty Program
- Award Winning Forex Broker
- Additional Exclusive Bonuses Throughout The Year

>> Claim Your $50 Bonus Here <<
Click here below to download: