


It is said that the forex market is in a trending market condition at only about 20% of the time. For the most part, it is often ranging or is in a choppy market condition. Most trading strategies require traders to trade only during trending markets.
However, other trading strategies are best implemented in a ranging market or a market with clearly defined market swings as price oscillates back and forth. Mean reversal strategies are prime examples of strategies that are best used in such market conditions. The strategy to be discussed below is an example of a mean reversal strategy that uses two technical indicators.
Money Flow Index
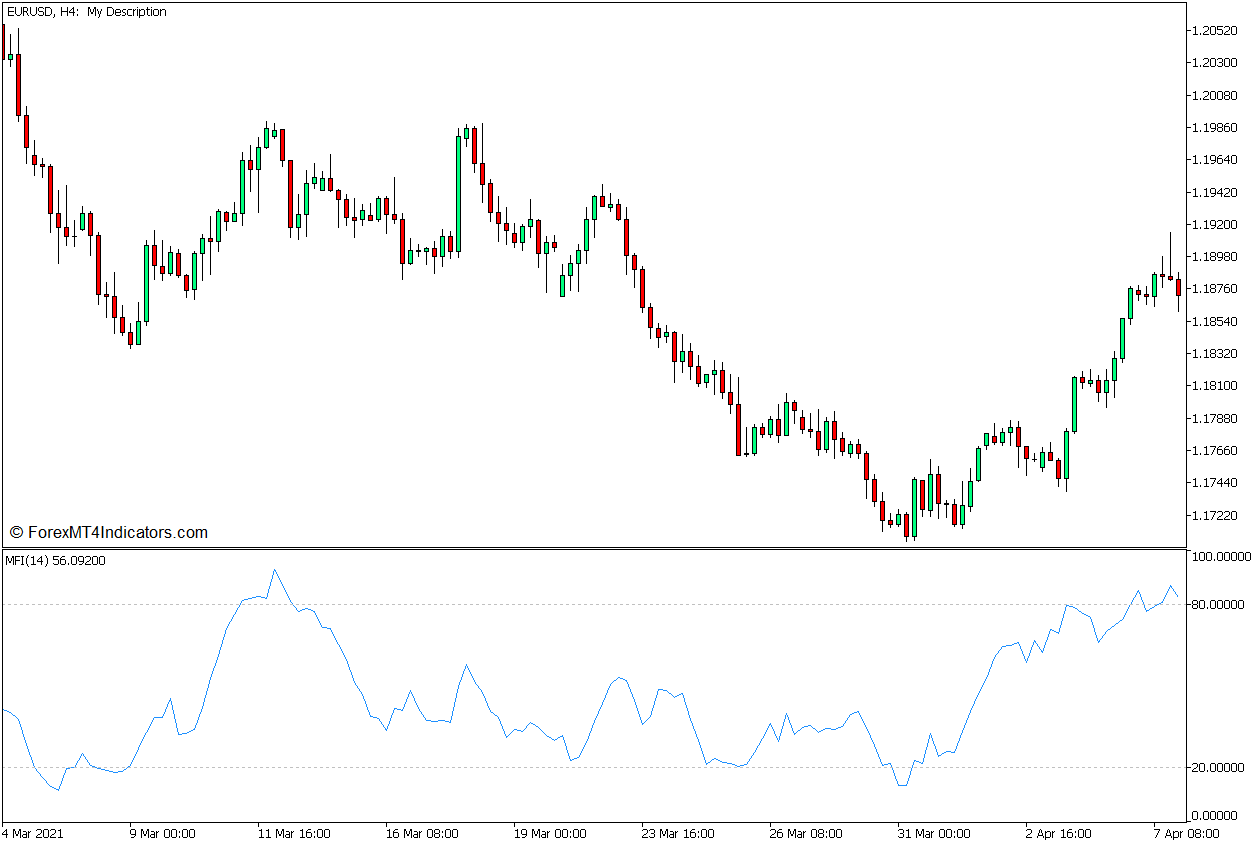
Money Flow Index or MFI is a technical indicator that indicates the rate at which an asset or tradeable instrument is bought and sold. It presents the direction and momentum of the market as an oscillator plotting a line that oscillates within a fixed range of 0 to 100.
Its algorithm calculates the MFI values in several stages.
First, it calculates the Typical Price (TP), which is the average of the high, low, and close prices.
- TP = (High + Low + Close) / 3
It then uses the Typical Price to calculate the Money Flow (MF).
- MF = TP x Volume
The indicator then identifies the Positive Money Flows and Negative Money Flows. From there, it calculates for the Money Ratio (MR).
- MR = Positive MF / Negative MF
Finally, it calculates for the MFI using the Money Ratio.
- MFI = 100 – [100 / (1 + MR)]
The resulting value is then plotted as a point on the MFI oscillator line.
The range also has markers at levels 20 and 80. These markers represent the thresholds to help identify oversold and overbought markets. MFI levels dropping below 20 indicate an oversold market, while MFI levels breaching above 80 indicate an overbought market, both of which are prime conditions for a mean reversal scenario.
The MFI line can also be used to identify momentum direction. This is based on the trajectory of the MFI line as it oscillates up and down its range, shadowing the movements of price action.
As an oscillator, the MFI can also be used as a basis for identifying divergences, which are indicative of possible market reversals.
Bollinger Bands
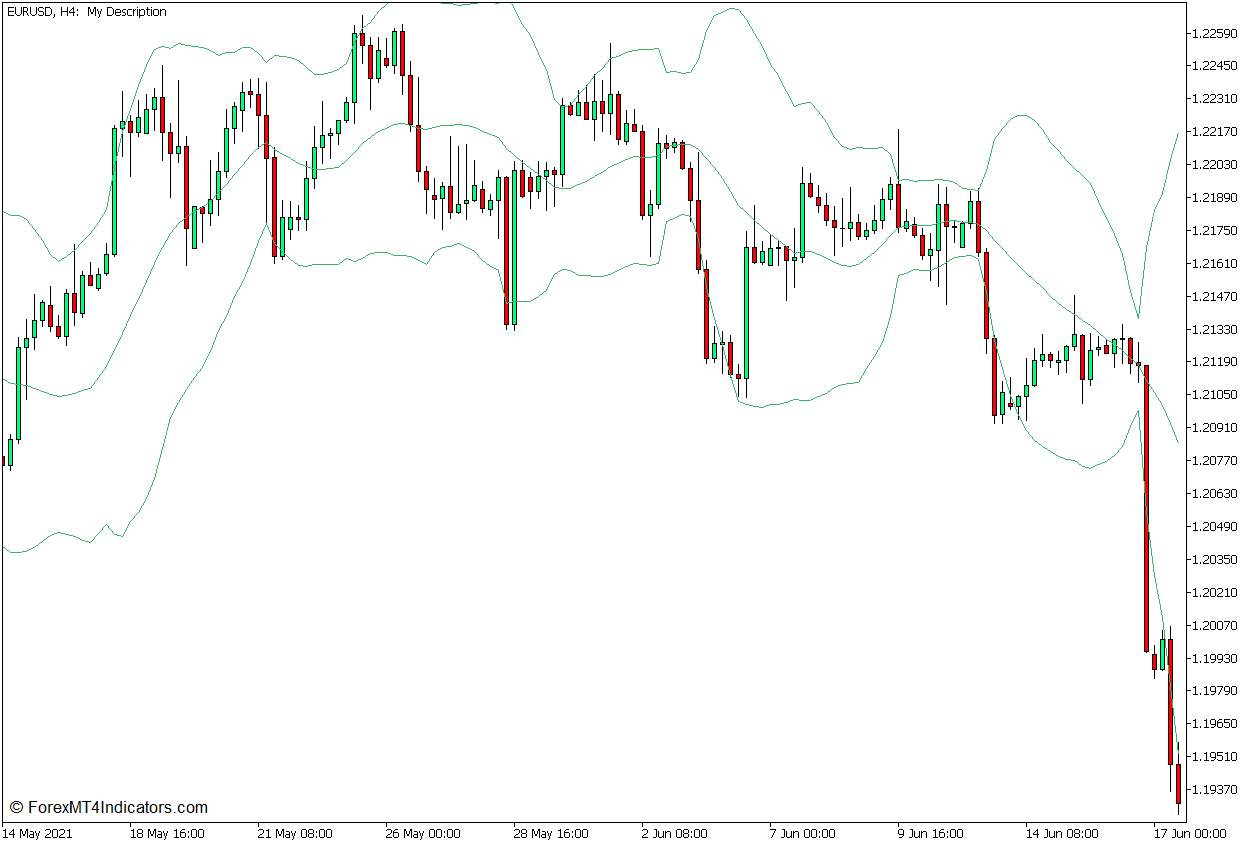
The Bollinger Bands is a trend-following technical indicator that features a band or channel-like structure with three lines. The middle line is usually a 20-bar Simple Moving Average (SMA). The outer lines on the other hand are deviations from the 20 SMA line, which are often set at 2 standard deviations. However, these values can be modified within the indicator’s settings.
Since the middle line is a moving average line, the Bollinger Bands can also be used as a trend direction indicator, just like most moving average lines. The market is in an uptrend whenever price action generally stays on the upper half of the channel, and in a downtrend whenever price action generally stays on the lower half of the channel.
Given that the outer lines are based on standard deviations, this indicator can also be used to assess volatility, as well as its expansion and contraction. Market expansion phases are identified by an expanding Bollinger Band, while market contraction phases are identified by a contracting Bollinger Band.
This indicator can also be used to identify momentum breakouts coming from market contraction phases. Strong momentum candles closing outside a contracted Bollinger Band is indicative of a momentum breakout market scenario.
However, the most common use for the Bollinger Bands is as a means to identify oversold and overbought markets. Price breaching above the upper line indicates an overbought market, while price dropping below the lower line indicates an oversold market. Price action rejecting the area outside the Bollinger Bands is a good indication of a possible mean reversal.
Trading Strategy Concept
This trading strategy is a simple mean reversal trading strategy that uses the confluence of the MFI and the Bollinger Bands as a means for identifying a high probability mean reversal market scenario.
The MFI line is used as the first basis for identifying oversold and overbought markets. This is based on the MFI line breaking outside of its 20 to 80 range. As soon as an oversold or overbought market is identified, we may then confirm the condition based on the Bollinger Bands.
The Bollinger Bands confirms the oversold and overbought market scenario based on price action breaching outside of its outer lines in confluence with the oversold or overbought scenario indicated by the MFI.
If the above-mentioned condition is met, we should then observe price action for signs of a possible mean reversal based on price rejection patterns. Trades are entered based on the price rejection signals coming from an oversold or overbought condition.
Price is allowed to swing to the opposite extreme. The trade is then closed as soon as an opposite price rejection indication is observed in the area outside the Bollinger Bands.
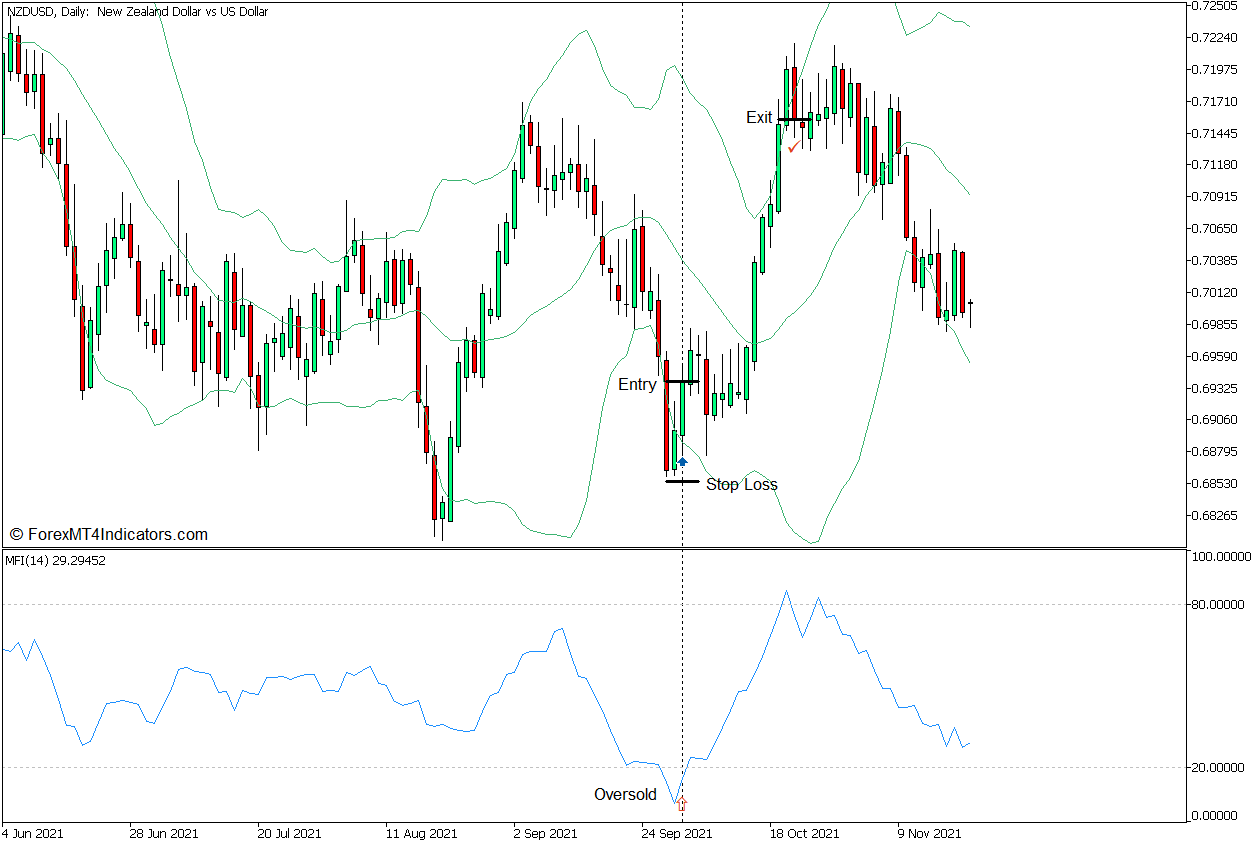
Buy Trade Setup
Entry
- The MFI line should drop below 20.
- Price action should drop below the lower Bollinger Band line.
- Open a buy order if a bullish price rejection pattern is presented by price action.
Stop Loss
- Set the stop loss on the fractal below the entry candle.
Exit
- Allow price to swing towards the area of the upper Bollinger Band line and close the trade as soon as price action shows signs of a bearish reversal.
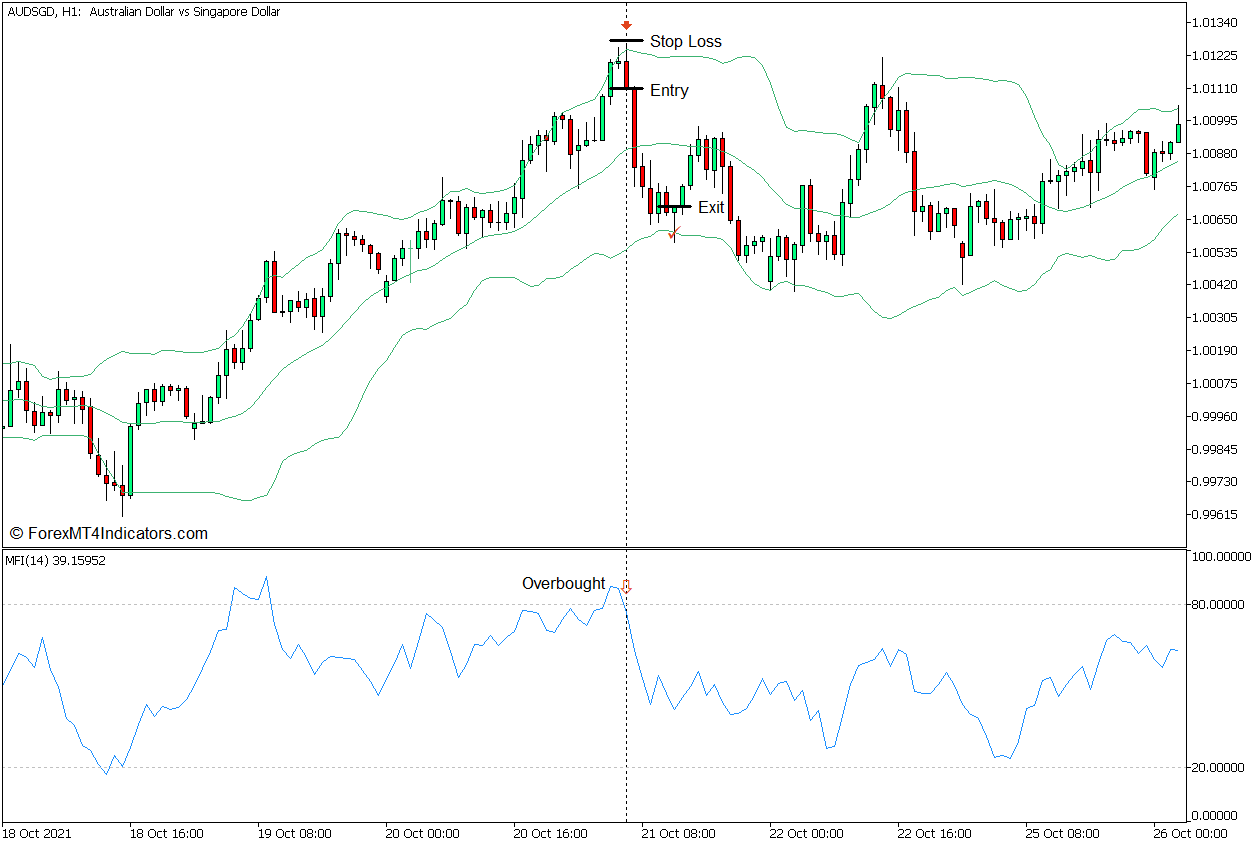
Sell Trade Setup
Entry
- The MFI line should breach above 80.
- Price action should breach above the upper Bollinger Band line.
- Open a sell order if a bearish price rejection pattern is presented by price action.
Stop Loss
- Set the stop loss on the fractal above the entry candle.
Exit
- Allow the price to swing toward the area of the lower Bollinger Band line and close the trade as soon as price action shows signs of a bullish reversal.
Conclusion
This trading strategy can be a very effective mean reversal trading strategy. However, it is best used in conjunction with the understanding of market flow and market structures. Trade setups that coincide with significant market structures tend to provide higher probability trades when using this strategy.
Recommended MT5 Brokers
XM Broker
- Free $50 To Start Trading Instantly! (Withdraw-able Profit)
- Deposit Bonus up to $5,000
- Unlimited Loyalty Program
- Award Winning Forex Broker
- Additional Exclusive Bonuses Throughout The Year

>> Sign Up for XM Broker Account here <<
FBS Broker
- Trade 100 Bonus: Free $100 to kickstart your trading journey!
- 100% Deposit Bonus: Double your deposit up to $10,000 and trade with enhanced capital.
- Leverage up to 1:3000: Maximizing potential profits with one of the highest leverage options available.
- ‘Best Customer Service Broker Asia’ Award: Recognized excellence in customer support and service.
- Seasonal Promotions: Enjoy a variety of exclusive bonuses and promotional offers all year round.

>> Sign Up for FBS Broker Account here <<
Click here below to download: