


This trading strategy is a type of trading strategy that trades on reversals coming from support or resistance zones, which is one of the basic trade setups used in a market flow type of strategy. It also makes use of the MFI, which indicates overbought and oversold price levels, to help traders identify high-probability reversal signals coming from these support or resistance zones.
Pivot Highs and Pivot Lows as Resistance or Support Zones
Most traders would describe supports and resistances as lines that can be connected by more than two pivot highs or pivot lows with the expectation that the price could reverse as it touches the line. Although this is a correct definition of a support or resistance line, supports and resistances are not limited only to these types of price levels.
The market often moves up and down the price chart in cyclical pulses of rallies and drops. These rallies and drops form peaks and dips, which are called swing highs and swing lows or pivot highs and pivot lows.
Pivot highs are points on the price chart where the price quickly reversed back down coming from a rally. This is most likely because the market already saw this price level being too high. Pivot lows are the exact opposite. These are points on the price chart where price quickly bounced back up coming from a drop. This is also probably because traders saw the price as too cheap and started buying.
Because of these characteristics of pivot highs and pivot lows, it is not unlikely that the price could also reverse as it revisits these levels. The market might still see price levels near a pivot high as too high, and price levels near pivot lows as too low. Traders might and would most likely act on these beliefs which would cause price to reverse. This is why areas near pivot highs and pivot lows can be described as support or resistance zones.
There is probably no definitive way to identify a support or resistance zone. Different traders have a different take on each support or resistance. However, we could identify support and resistance zones based on the body or the wick of the candle where the price started to reverse.
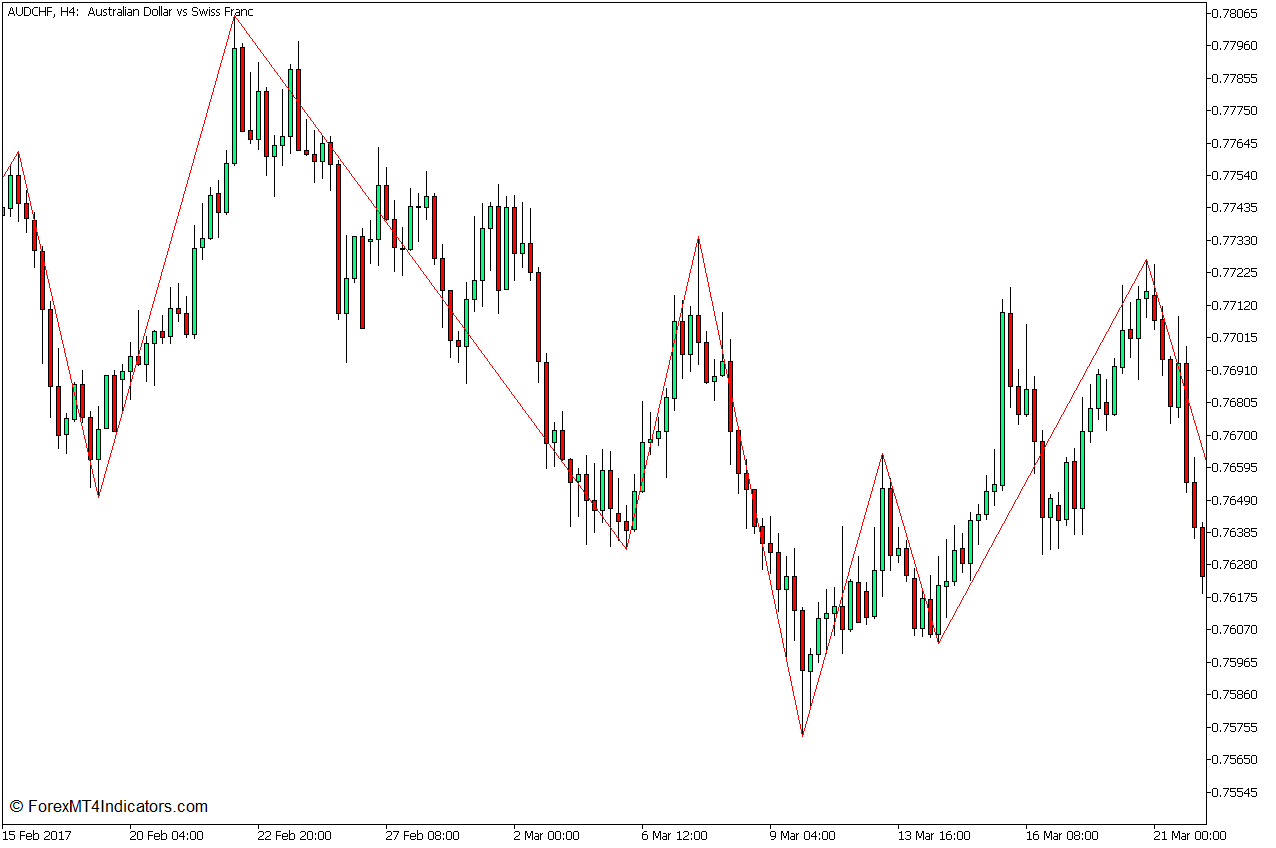
Zigzag Indicator
The Zigzag Indicator is a technical indicator that automatically identifies potential swing highs and swing lows on a price chart.
It uses an algorithm that identifies points on the price chart where the price had reversed against a prior momentum direction by a percentage greater than the preset threshold. This threshold is usually set at 5%. It then identifies these points as a swing high or a swing low.
The indicator then connects the swing highs and swing lows with a line that forms a zigzag-like pattern on the price chart. Thus it is called the Zigzag indicator.
This indicator is often used to identify the swing highs and swing lows of price, which is then extrapolated for other uses, such as identifying horizontal support and resistances, as well as trendlines and price patterns.
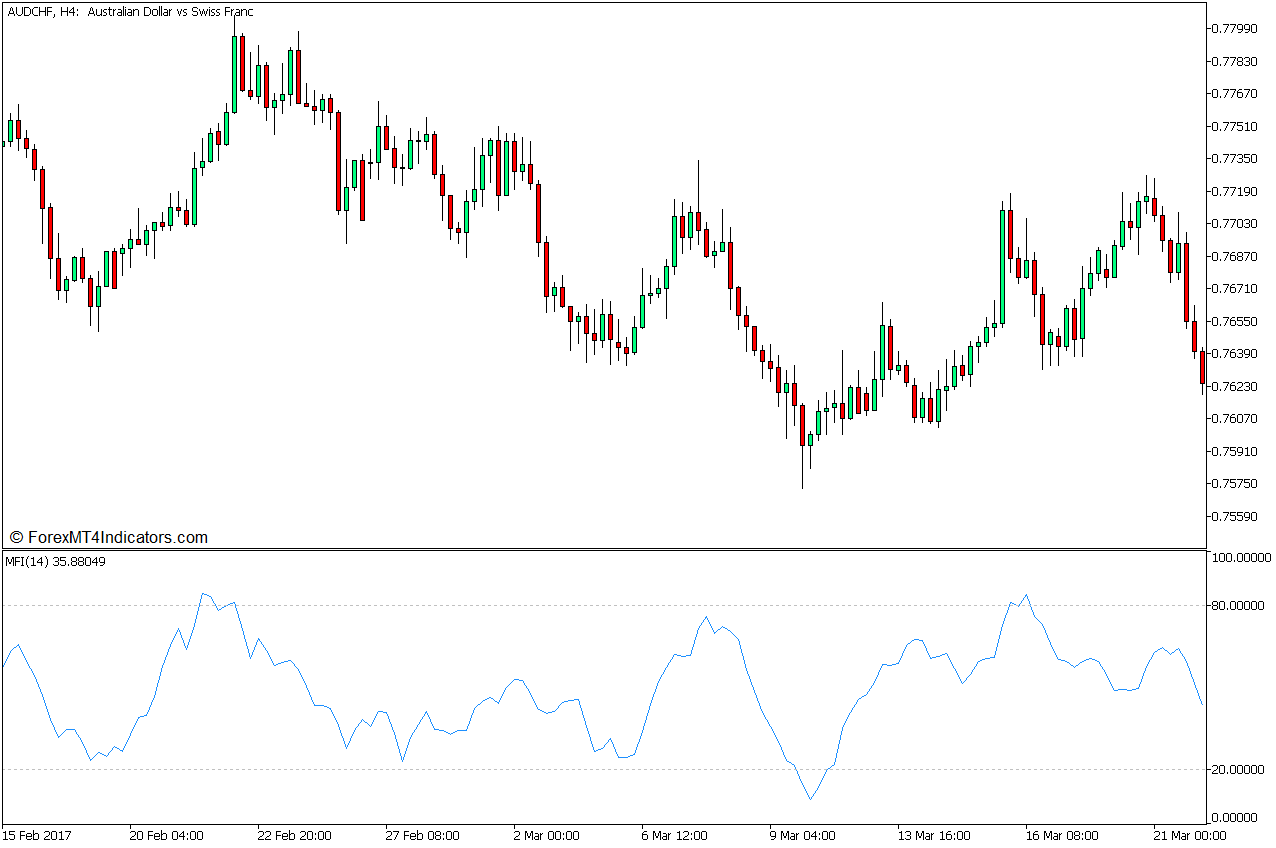
Market Flow Index
The Market Flow Index (MFI) is an oscillator type of technical indicator that identifies overbought and oversold price levels based on historical average price movements and volume.
The MFI makes use of the Typical Price, which is the average of the high, low, and close of price. It then multiplies the Typical Price with volume, which puts more weight on bars with high volume. It then computes the ratio of the positive money flow and the negative money flow. It then normalizes the money flow ratio into a range that is bound around zero to 100. This would be the Money Flow Index.
The MFI then plots an MFI line that oscillates within the range of zero to 100.
The MFI range also has markers at levels 20 and 80, which mark the oversold and overbought levels.
An MFI line dropping below 20 is considered oversold, while an MFI line breaching above 80 is overbought, both of which are prime conditions for a possible strong mean reversal.
Trading Strategy Concept
This trading strategy is a market flow type of trading strategy that trades on potential reversals on a support or resistance zone using the Zigzag Indicator and the MFI.
The Zigzag Indicator is used to help traders objectively identify swing lows and swing highs, which are then used as a basis for marking support and resistance zones.
Traders should then observe the price as it revisits the support or resistance zone along with the MFI indication.
If the MFI value shows an oversold or overbought market as the price touches the support or resistance zone, traders may expect a potential market reversal and trade accordingly.
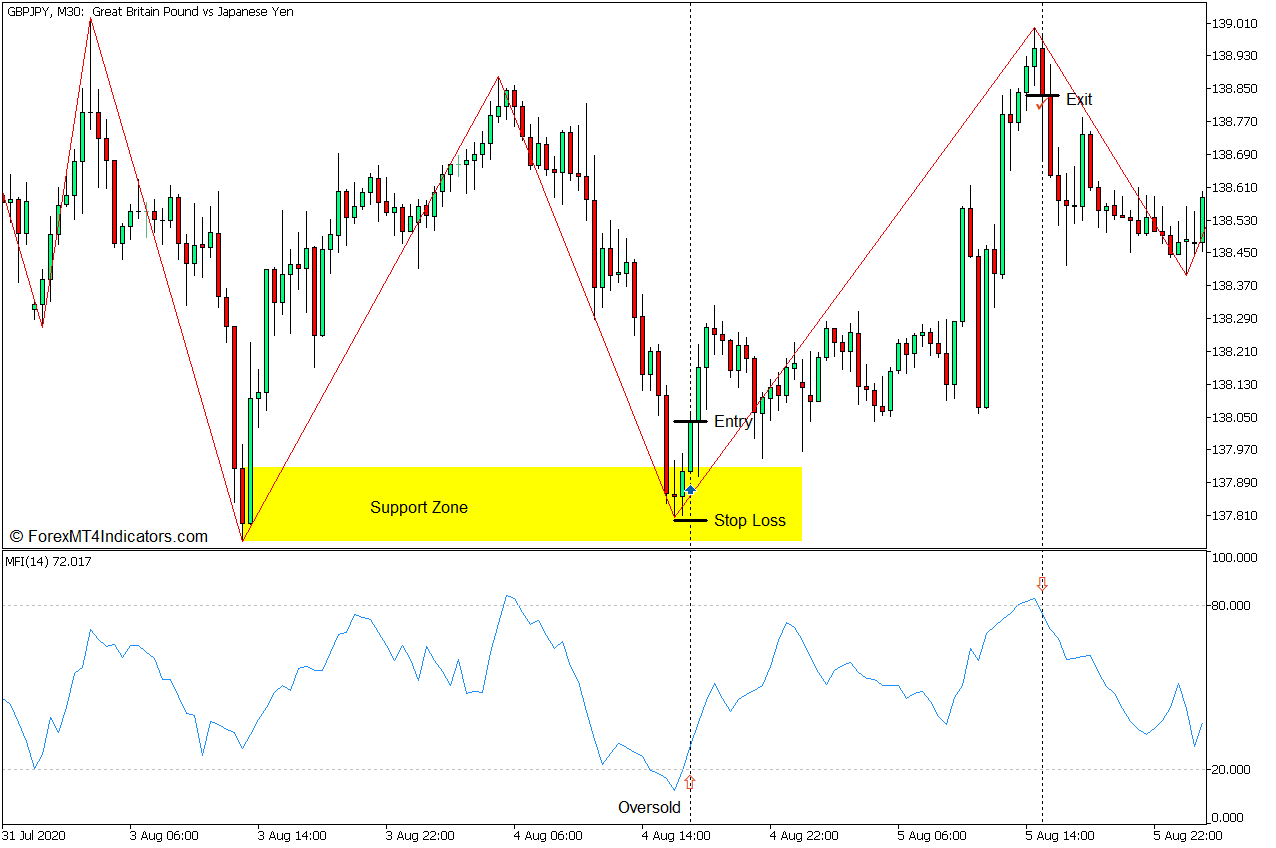
Buy Trade Setup
Entry
- Mark the area of the most recent pivot low as a support zone.
- Wait for the price to touch the support zone.
- The MFI line should be below 20 as the price touches the support zone.
- Enter a buy order as soon as the MFI line starts to reverse back above 20 while price action shows signs of a bullish reversal.
Stop Loss
- Set the stop loss at the support below the entry candle.
Exit
- Allow the MFI line to breach above 80 and close the trade as the MFI line crosses back down.
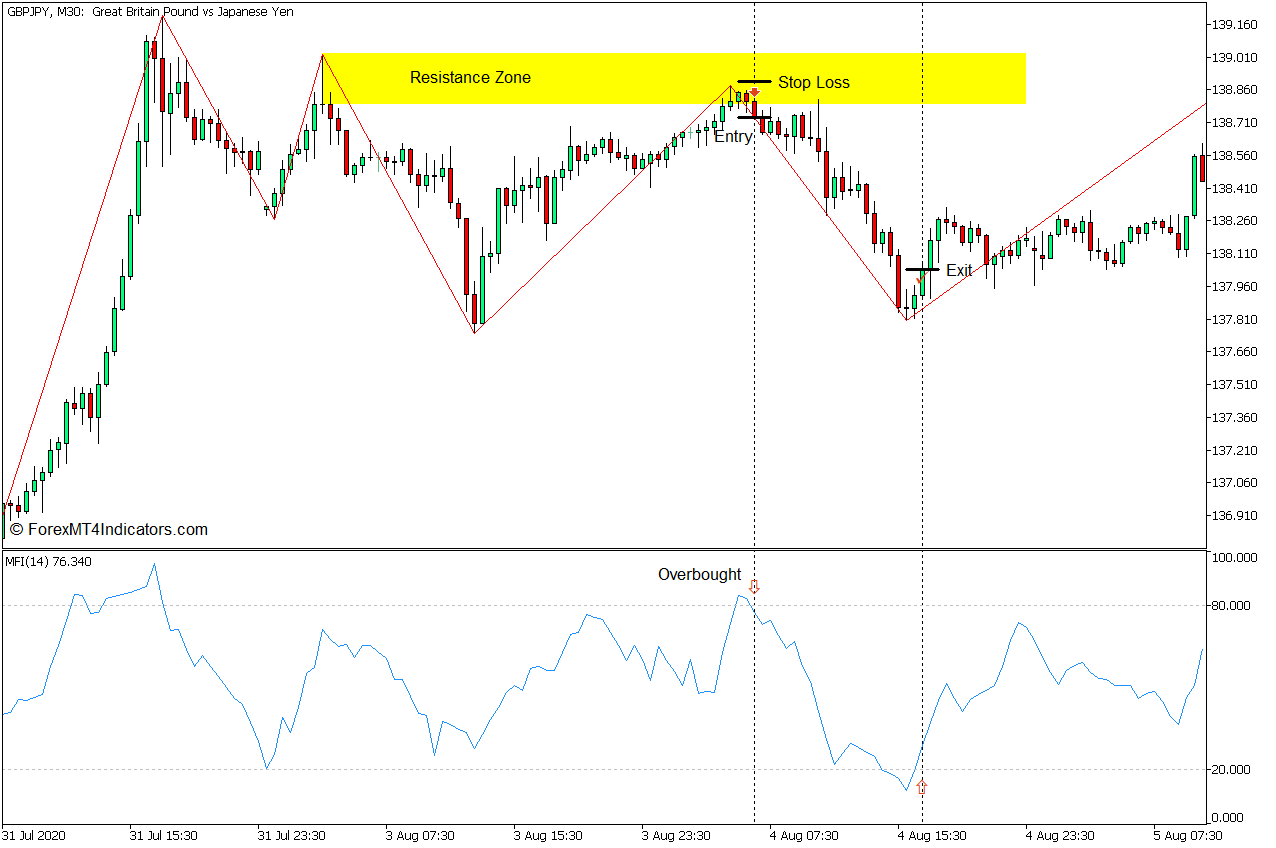
Sell Trade Setup
Entry
- Mark the area of the most recent pivot high as a resistance zone.
- Wait for the price to touch the resistance zone.
- The MFI line should be above 80 as the price touches the resistance zone.
- Enter a sell order as soon as the MFI line starts to reverse back below 80 while price action shows signs of a bearish reversal.
Stop Loss
- Set the stop loss at the resistance above the entry candle.
Exit
- Allow the MFI line to breach drop below 20 and close the trade as the MFI line crosses back up.
Conclusion
This trading strategy can produce high-probability reversal setups since it is proactive rather than reactive. We are not merely reacting to trade signals, rather we are trying to anticipate where the price would reverse. At the same time, we are also adding another layer of confirmation based on a reversal from an overbought or oversold price level.
Recommended MT5 Brokers
XM Broker
- Free $50 To Start Trading Instantly! (Withdraw-able Profit)
- Deposit Bonus up to $5,000
- Unlimited Loyalty Program
- Award Winning Forex Broker
- Additional Exclusive Bonuses Throughout The Year

>> Sign Up for XM Broker Account here <<
FBS Broker
- Trade 100 Bonus: Free $100 to kickstart your trading journey!
- 100% Deposit Bonus: Double your deposit up to $10,000 and trade with enhanced capital.
- Leverage up to 1:3000: Maximizing potential profits with one of the highest leverage options available.
- ‘Best Customer Service Broker Asia’ Award: Recognized excellence in customer support and service.
- Seasonal Promotions: Enjoy a variety of exclusive bonuses and promotional offers all year round.

>> Sign Up for FBS Broker Account here <<
Click here below to download: