


Indi Wave Forex Trading Strategy
If you’d look closely, you would notice that the market moves in waves. Amidst the chaos of the market, you would notice that price does go up and down on a somewhat rhythmic pattern. Many traders have somehow learned to observe and understand these patterns and have made a fortune out of the market through it. However, predicting the peaks and troughs of these waves are quite difficult especially for beginners.
Oscillating Indicator Waves
Although it is quite difficult to predict peaks and troughs on the price chart itself, there are ways to somehow lessen the noise by using oscillating indicators.
Oscillating indicators somehow shorten the range of the peaks and troughs of these waves because oscillating indicators are often range bound and compressed. This allows for an area on the indicator window where we could somehow have a higher probability of having a market reversal. This is especially true with indicators that have a fixed range and have overbought and oversold areas.
The DSS Indicator
There are many indicators that allow for observing these waves. But some are better than the others. The key thing to look for if you’d like to observe these waves on an indicator, is to have an indicator that has a relatively smooth oscillation and has an overbought and oversold area.
We have the Robby_DSS indicator which has both these characteristics and features.
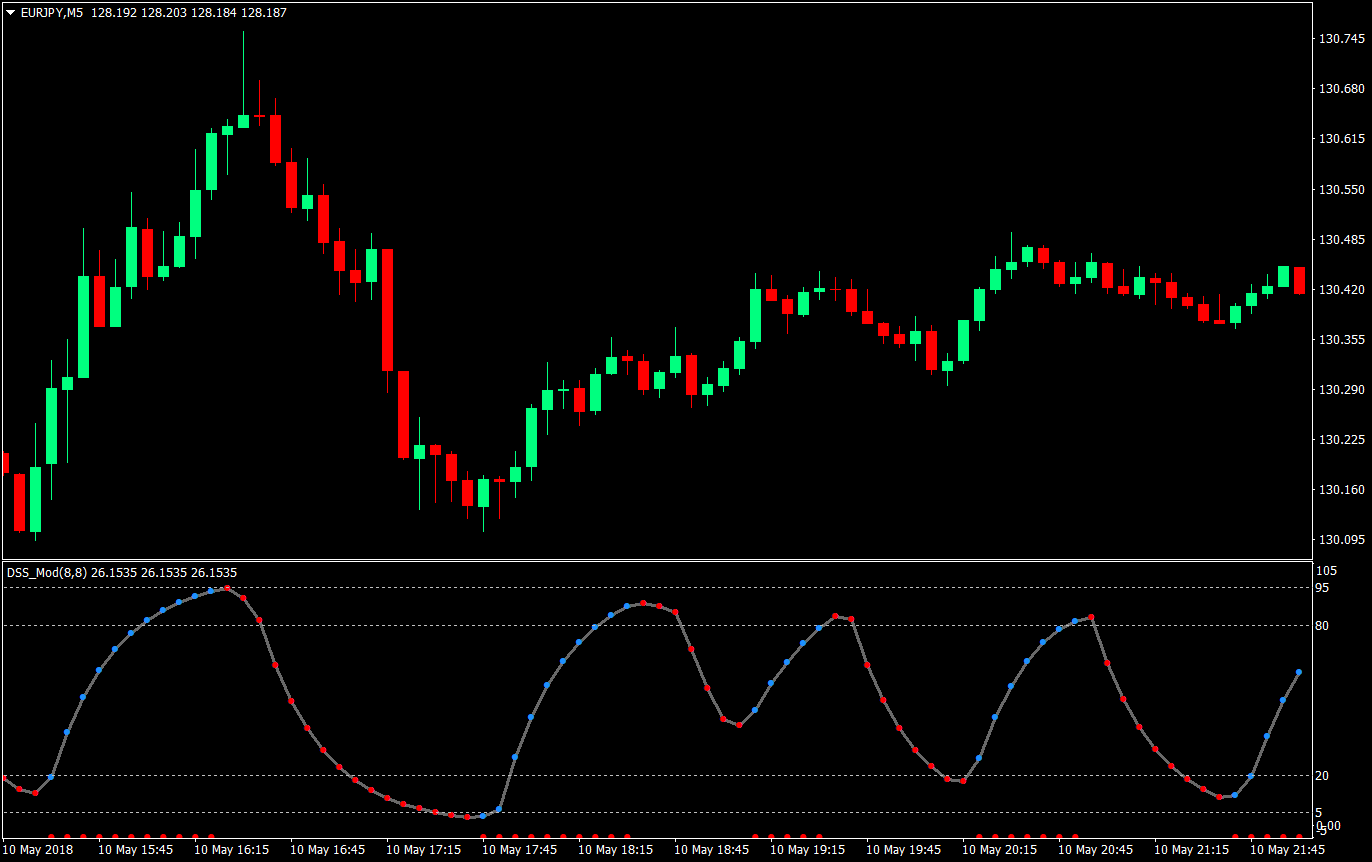
It has a relatively smoother oscillation compared to other oscillating indicators which is a bit jagged. This allows the waves to be more observable. It also has the overbought and oversold areas where we could start looking for potential reversals. The 80-95 area indicates an overbought market scenario, while the 5-20 area indicates an oversold market scenario.
Notice how the indicator shows these waves as it travels from overbought to oversold and back. It also does this while somehow tracking the movement of the price chart itself.
As an added bonus, this indicator has an entry signal in itself represented by the red and blue dots. The blue dot resembles a probable bullish reversal while the red dot resembles a probably bearish reversal. This is also based on whether the DSS number on the current candle is higher or lower than the previous candle’s DSS.
Trade Strategy Concept
Using this indicator, we will trade possible reversals based on the reversal signals that are on the overbought or oversold market conditions. We will be buying the market when a blue dot appears below 20 and selling when a red dot appears above 80.
This entry should also be in confluence with an additional indicator that gives entry signals based on fractals – the SHI_SilverTrendSig. However, the dot colors are on reverse with this indicator. Red dots indicate the lows of the fractals, which could also mean a possible bullish reversal, while blue dots indicate the highs of the fractals, which could also be a bearish reversal.
Timeframe: 1-minute, 5-minute, and 15-minute charts
Session: London, New York, and Tokyo session
Currency Pair: any major pair
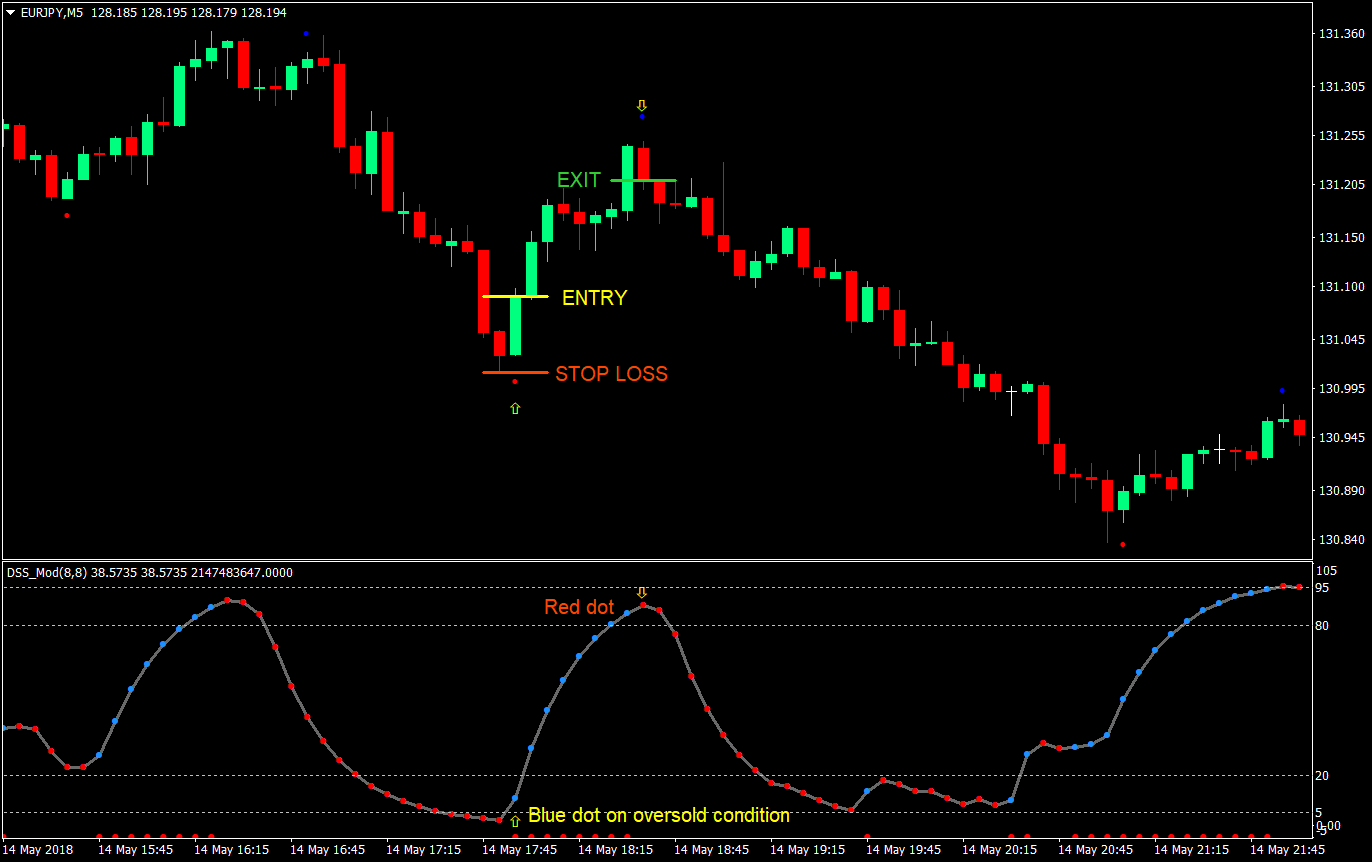
Buy Trade Setup
Entry
- On the Robby_DSS indicator, a blue dot should appear below the 20 line to signify a possible bullish reversal on an oversold market condition
- A red SHI_SilverTrendSig dot should appear on the price chart
- Enter a buy market order on the close of the candle with a confluence of both indicators
Stop Loss
- Set the stop loss at the swing low below the entry candle
Exit
- Close the trade on any of the following conditions:
- A red dot appears on the Robby_DSS indicator
- A blue SHI_SilverTrendSig dot appears on the price chart
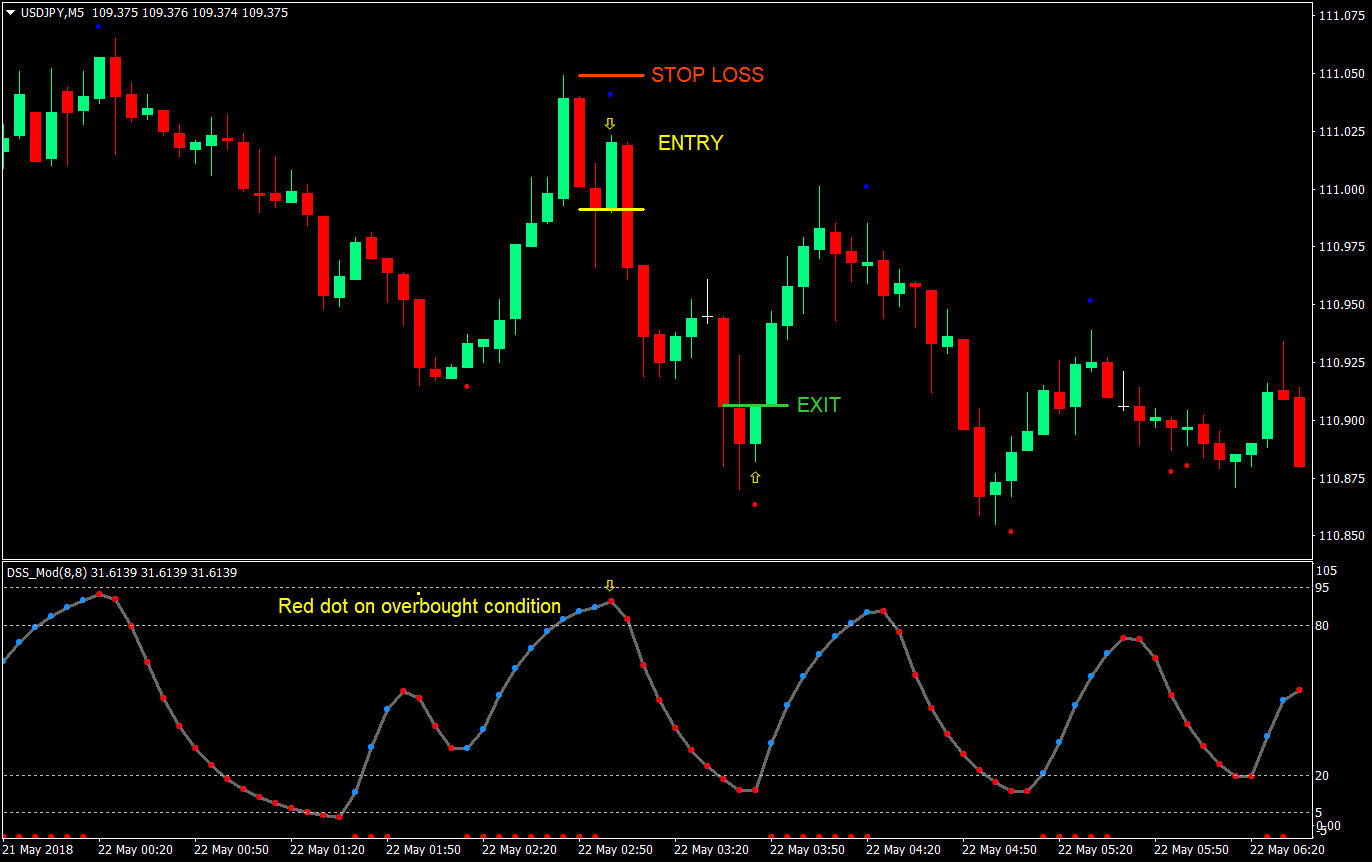
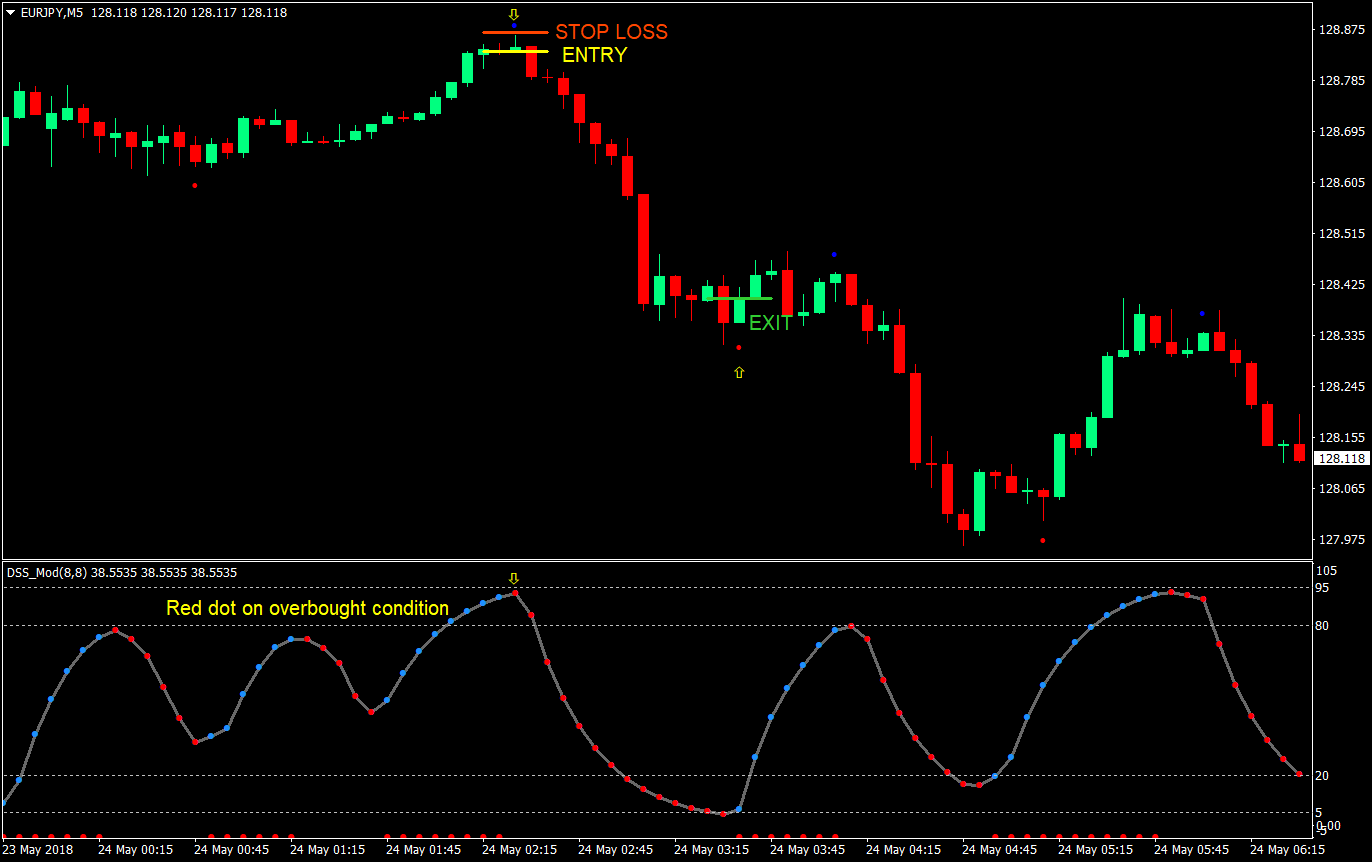
Sell Trade Setup
Entry
- On the Robby_DSS indicator, a red dot should appear above the 80 line to signify a possible bearish reversal on an overbought market condition
- A blue SHI_SilverTrendSig dot should appear on the price chart
- Enter a sell market order on the close of the candle with a confluence of both indicators
Stop Loss
- Set the stop loss at the swing high above the entry candle
Exit
- Close the trade on any of the following conditions:
- A blue dot appears on the Robby_DSS indicator
- A red SHI_SilverTrendSig dot appears on the price chart
Conclusion
This strategy is built around the wave like oscillations of the Robby_DSS indicator. In itself, this indicator could already be a standalone indicator. It has all the bells and whistles needed for an indicator based mean reversion strategy. It has the overbought and oversold markers, a smooth oscillation that mirrors price movement, and on top of it, it has signals on its own window. Taking signals on overbought or oversold areas should be high probability mean reversion trades.
However, there will be instances when the waves are too shallow, which usually occurs during choppy market scenarios. During these market conditions, it is best to keep a tight stop loss and to trail to breakeven as soon as possible to avoid huge losses.
The SHS_SilverTrendSig is just an additional confirmation. Although it could catch highs and lows, because it is based on fractals, it might not be as reliable. But then again, this is just an additional confirmation.
Study both indicators and observe the common traits of winning and losing trades to improve your trade statistics.
Recommended MT4 Broker
- Free $50 To Start Trading Instantly! (Withdrawable Profit)
- Deposit Bonus up to $5,000
- Unlimited Loyalty Program
- Award Winning Forex Broker
- Additional Exclusive Bonuses Throughout The Year

>> Claim Your $50 Bonus Here <<
Click here below to download: