One of the major considerations professional traders look at when trading the forex market, or any type of tradeable instrument market for that matter, is the direction of the trend. Many traders have a rule that states, “Trade with the trend!” For most trend following traders, this is their number one rule and they would never attempt to break it.
One of the most popular ways traders identify trend direction is through the use of moving average lines. The concept is very simple. Traders identify trend bias or trend direction based on two conditions. First, the location of price action in relation to the moving average line. The trend bias is bullish if price action is above the moving average line, and bearish if it is below the moving average line. The second condition is based on the slope of the moving average line. If the moving average is sloping up, then the market is considered bullish, while if the moving average line is sloping down, then the market is considered bearish.
Various moving average line methods with various period lengths have different characteristics. Some tend to be very reactive to price action fluctuations, while others tend to be too lagging. Some tend to err towards the short-term trend, while some could represent a longer-term trend. The question is which of the various types of moving average lines should be used. Actually, none of it is the best. In fact, all of it could be used in the right market trend. It is up to the trader to find the moving average line that tends to support their trade plans and give them the most accuracy.
The Big Trend indicator is one of those indicators that plot a moving average line which is very reliable, both as a trend direction indicator and as a trend reversal indicator. Let us explore and learn how this moving average based indicator can be used to improve our trading.
Big Trend Indicator
The Big Trend indicator is a trend following custom technical indicator which is based on a modified moving average line.
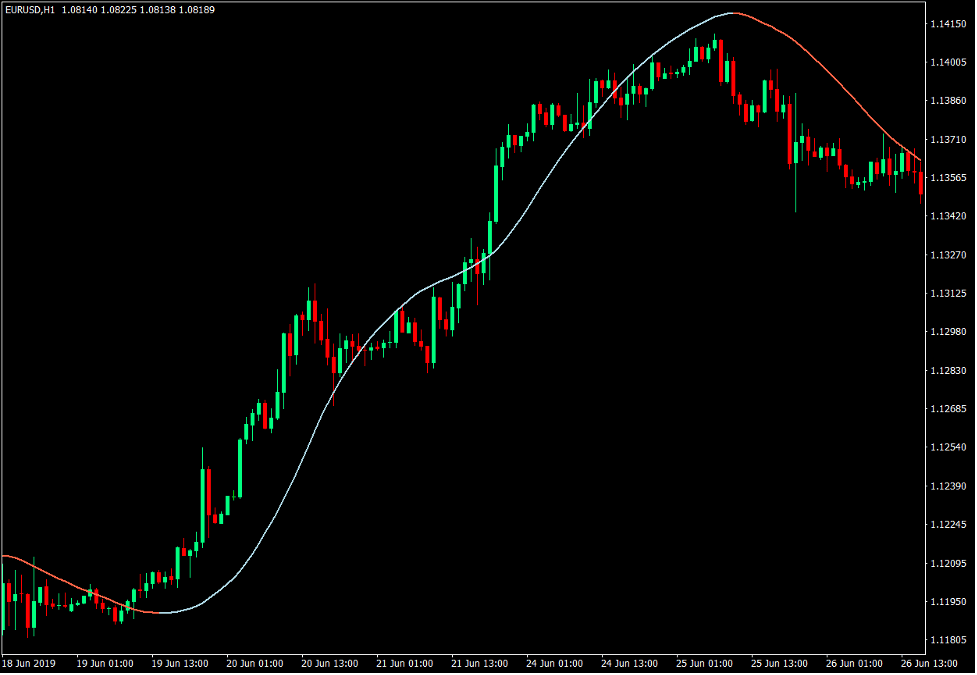
Most moving average lines tend to be very susceptible to false signals produced during price spikes and choppy markets. The Big Trend line, however, is characteristically very smooth. This creates a type of moving which is less susceptible to false trend reversal signals and is very reliable when indicating trend bias direction.
The Big Trend is also geared towards the mid-range trends. This gives it a balance between being aggressively responsive and being overly slow.
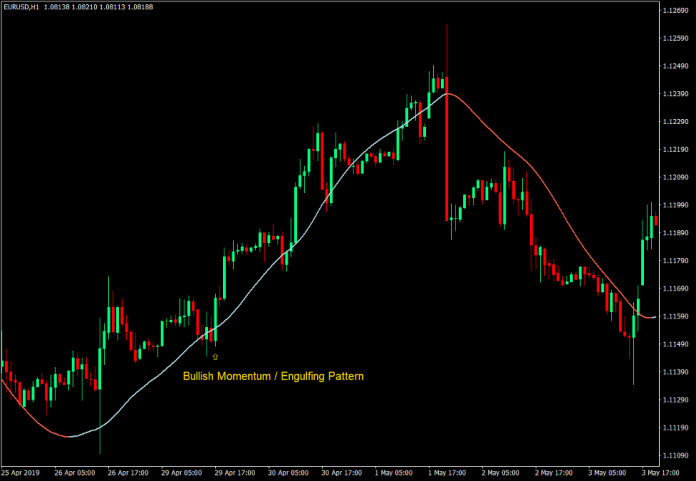
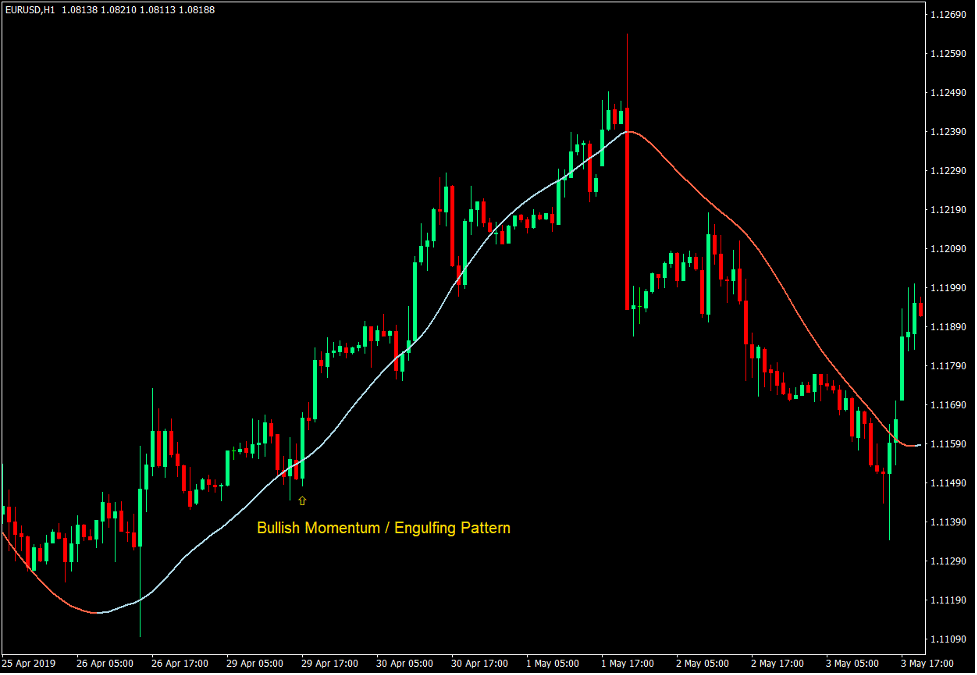
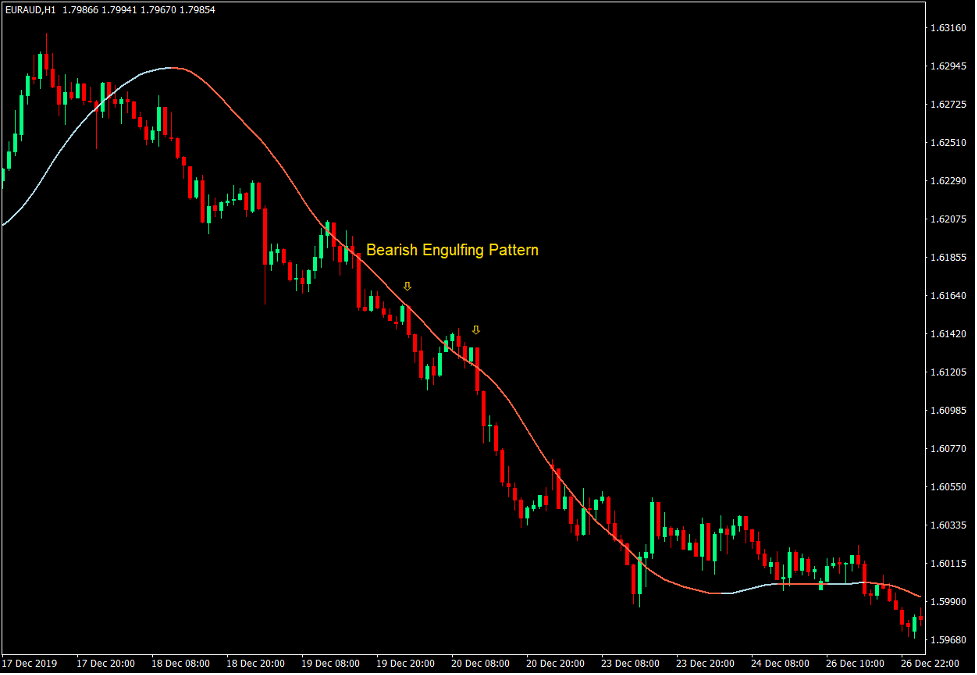
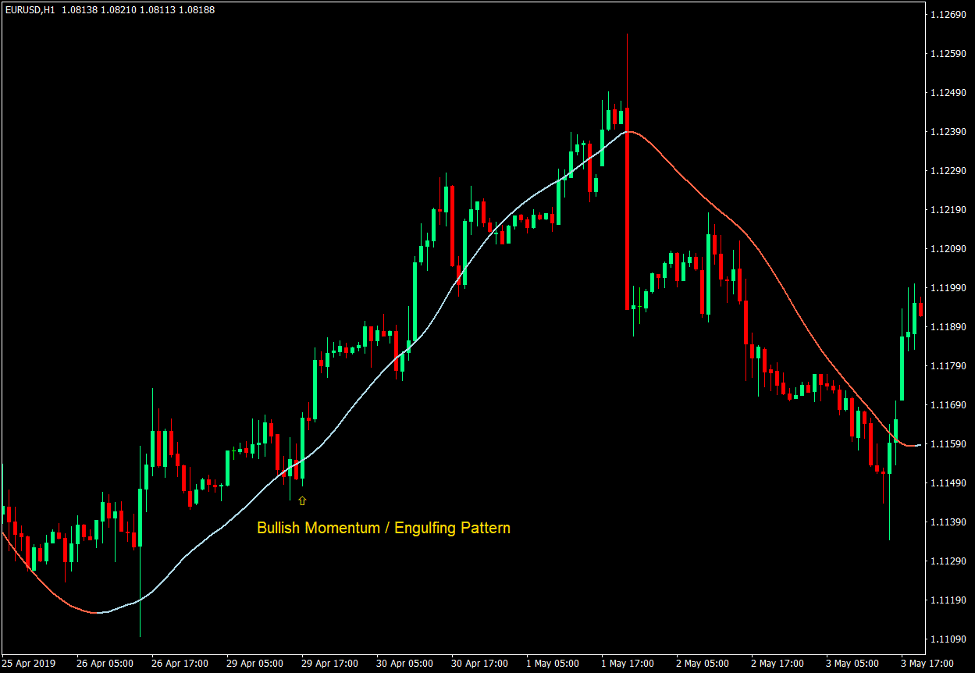
The Big Trend line also changes color to indicate the direction of the trend. Light blue lines indicate a bullish trend, while a tomato colored line indicates a bearish trend. This changing of color is based on the direction of its slope, which is one of the ways traders identify trend direction.
Big Trend Line as Trend Bias Filter
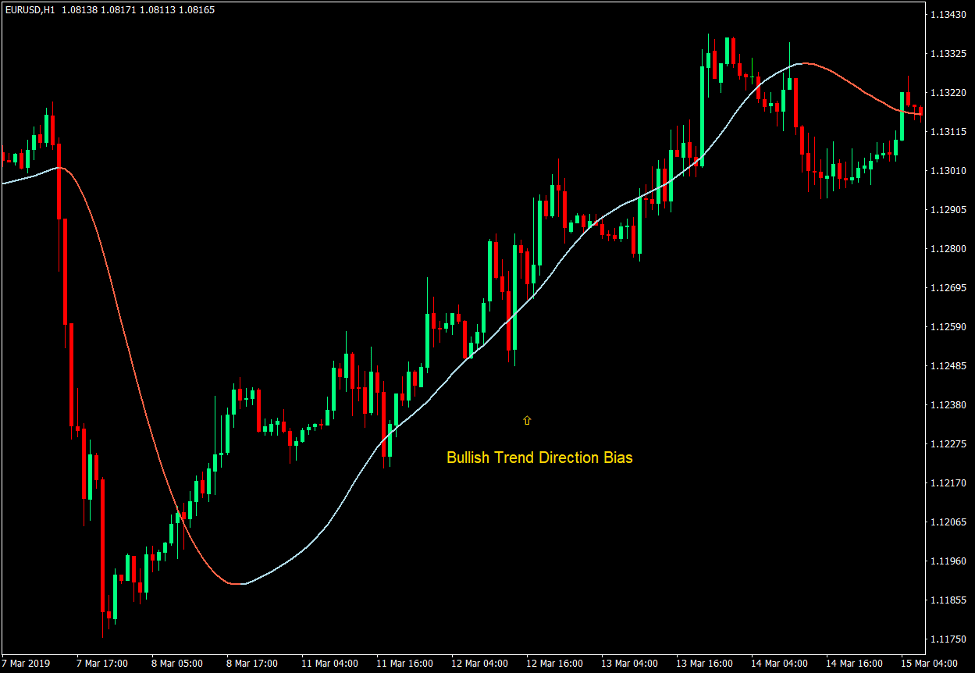
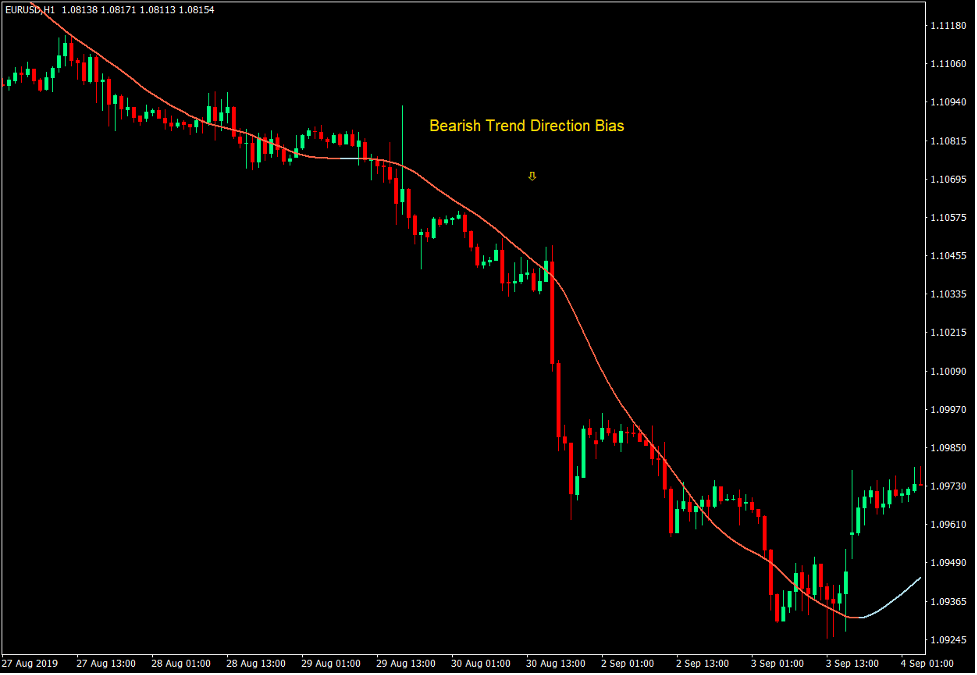
One of the ways the Big Trend indicator may be used is as a trend direction bias filter. As a trend filter, traders may identify and isolate which direction they should be trading based on the trend direction indicate by the Big Trend line.
Since the market is bullish whenever the Big Trend line is light blue, traders should take only buy trade setups.
On the other hand, since the market is also considered bearish whenever the Big Trend line is color tomato, traders should only consider sell trade setups.
Big Trend Line as a Dynamic Support or Resistance Level
Just as with many moving average lines, the Big Trend line may also be used as a basis for a dynamic support or resistance level. As such traders may trade in the direction of the trend as price action shows indication of bouncing off the Big Trend line.
This concept may be used in conjunction with the hypothesis that the Big Trend line is an excellent trend direction filter.
In this strategy example, we will be looking at a setup wherein price rejection candles are used as a basis for identifying bounces off the Big Trend line dynamic support or resistance level.
Buy Trade Setup
- Price action should be above the Big Trend line.
- The Big Trend line should slope up and should be color light blue.
- Price action should be trending up based on a rising price swing level.
- Price should retrace towards the Big Trend line.
- Price action should show signs of price rejection as it touches the Big Trend line based on a price reversal candlestick pattern.
- Enter a buy order on the confirmation of the conditions above.
Sell Trade Setup
- Price action should be below the Big Trend line.
- The Big Trend line should slope down and should be color tomato.
- Price action should be trending down based on a dropping price swing level.
- Price should retrace towards the Big Trend line.
- Price action should show signs of price rejection as it touches the Big Trend line based on a price reversal candlestick pattern.
- Enter a sell order on the confirmation of the conditions above.
Big Trend Line as a Trend Reversal Signal
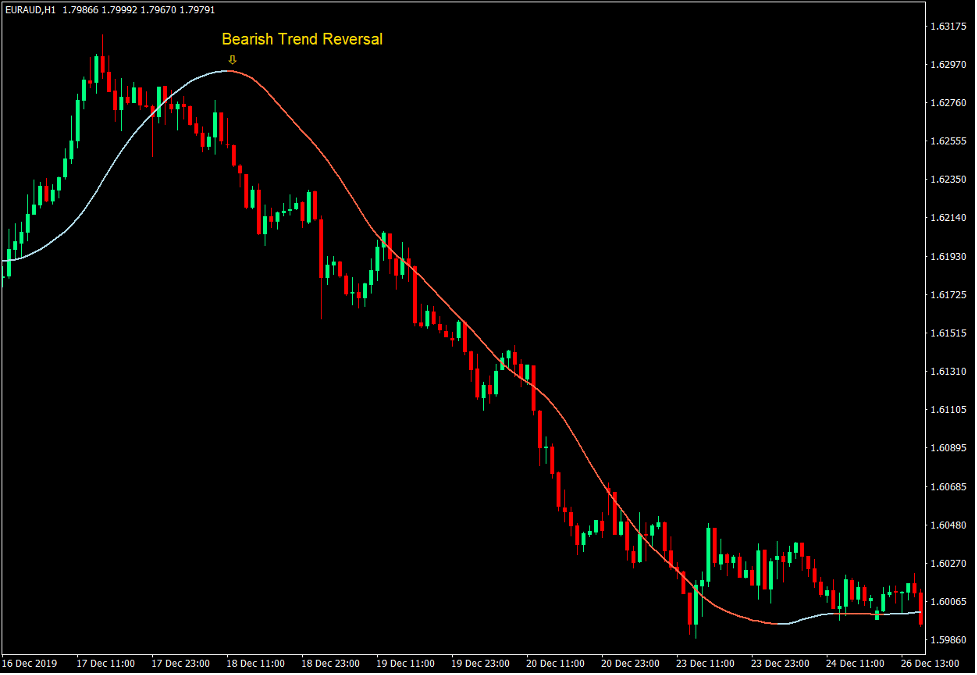
The Big Trend line may also be used as a trend reversal entry signal. Given that the changing of the color of the Big Trend line indicates a potential trend reversal, such changing of color could also be considered as a trend reversal entry signal.
Buy Trade Setup
- Price action should cross above the Big Trend line.
- Enter a buy order as soon as the Big Trend line changes to light blue.
Sell Trade Setup
- Price action should cross below the Big Trend line.
- Enter a sell order as soon as the Big Trend line changes to tomato.
This technique works well for capturing huge trends. However, it may also cause traders to incur some losses if the market would cause the Big Trend line to produce some false signals. There are some ways to counter this. Traders may opt to use price action or price candle confirmations as the color of the line changes, such as signals which are in confluence with momentum candles. Another option would be to wait for a retracement that would reject the Big Trend line right after retesting it.
Conclusion
The Big Trend line is an excellent trend following indicator which may be used extremely well in trend following and trend reversal type of strategies. It also works well when in confluence with price action or other trend following technical indicators.
Traders may easily incorporate this indicator as a confirmation of a trade setup with their trading strategies in order to increase their success rate. However, they should also test this indicator first in order to prove that this indicator is complementary with their existing techniques.
Recommended MT4 Brokers
XM Broker
- Free $50 To Start Trading Instantly! (Withdraw-able Profit)
- Deposit Bonus up to $5,000
- Unlimited Loyalty Program
- Award Winning Forex Broker
- Additional Exclusive Bonuses Throughout The Year
>> Sign Up for XM Broker Account here <<
FBS Broker
- Trade 100 Bonus: Free $100 to kickstart your trading journey!
- 100% Deposit Bonus: Double your deposit up to $10,000 and trade with enhanced capital.
- Leverage up to 1:3000: Maximizing potential profits with one of the highest leverage options available.
- ‘Best Customer Service Broker Asia’ Award: Recognized excellence in customer support and service.
- Seasonal Promotions: Enjoy a variety of exclusive bonuses and promotional offers all year round.
>> Sign Up for FBS Broker Account here <<
Click here below to download:


