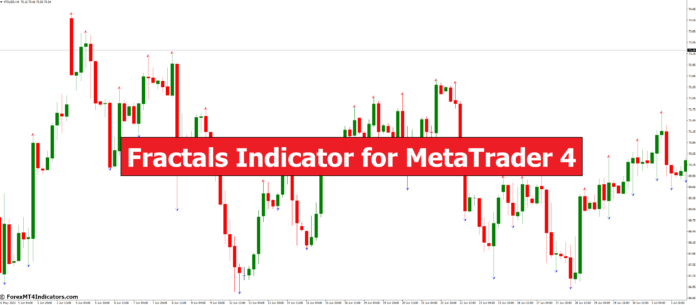
The Fractals Indicator is a technical analysis tool that helps traders identify potential reversal points in the market. It is a part of Bill Williams’ trading system, which is a combination of several indicators that work together to provide a complete trading strategy.
How Does It Work?
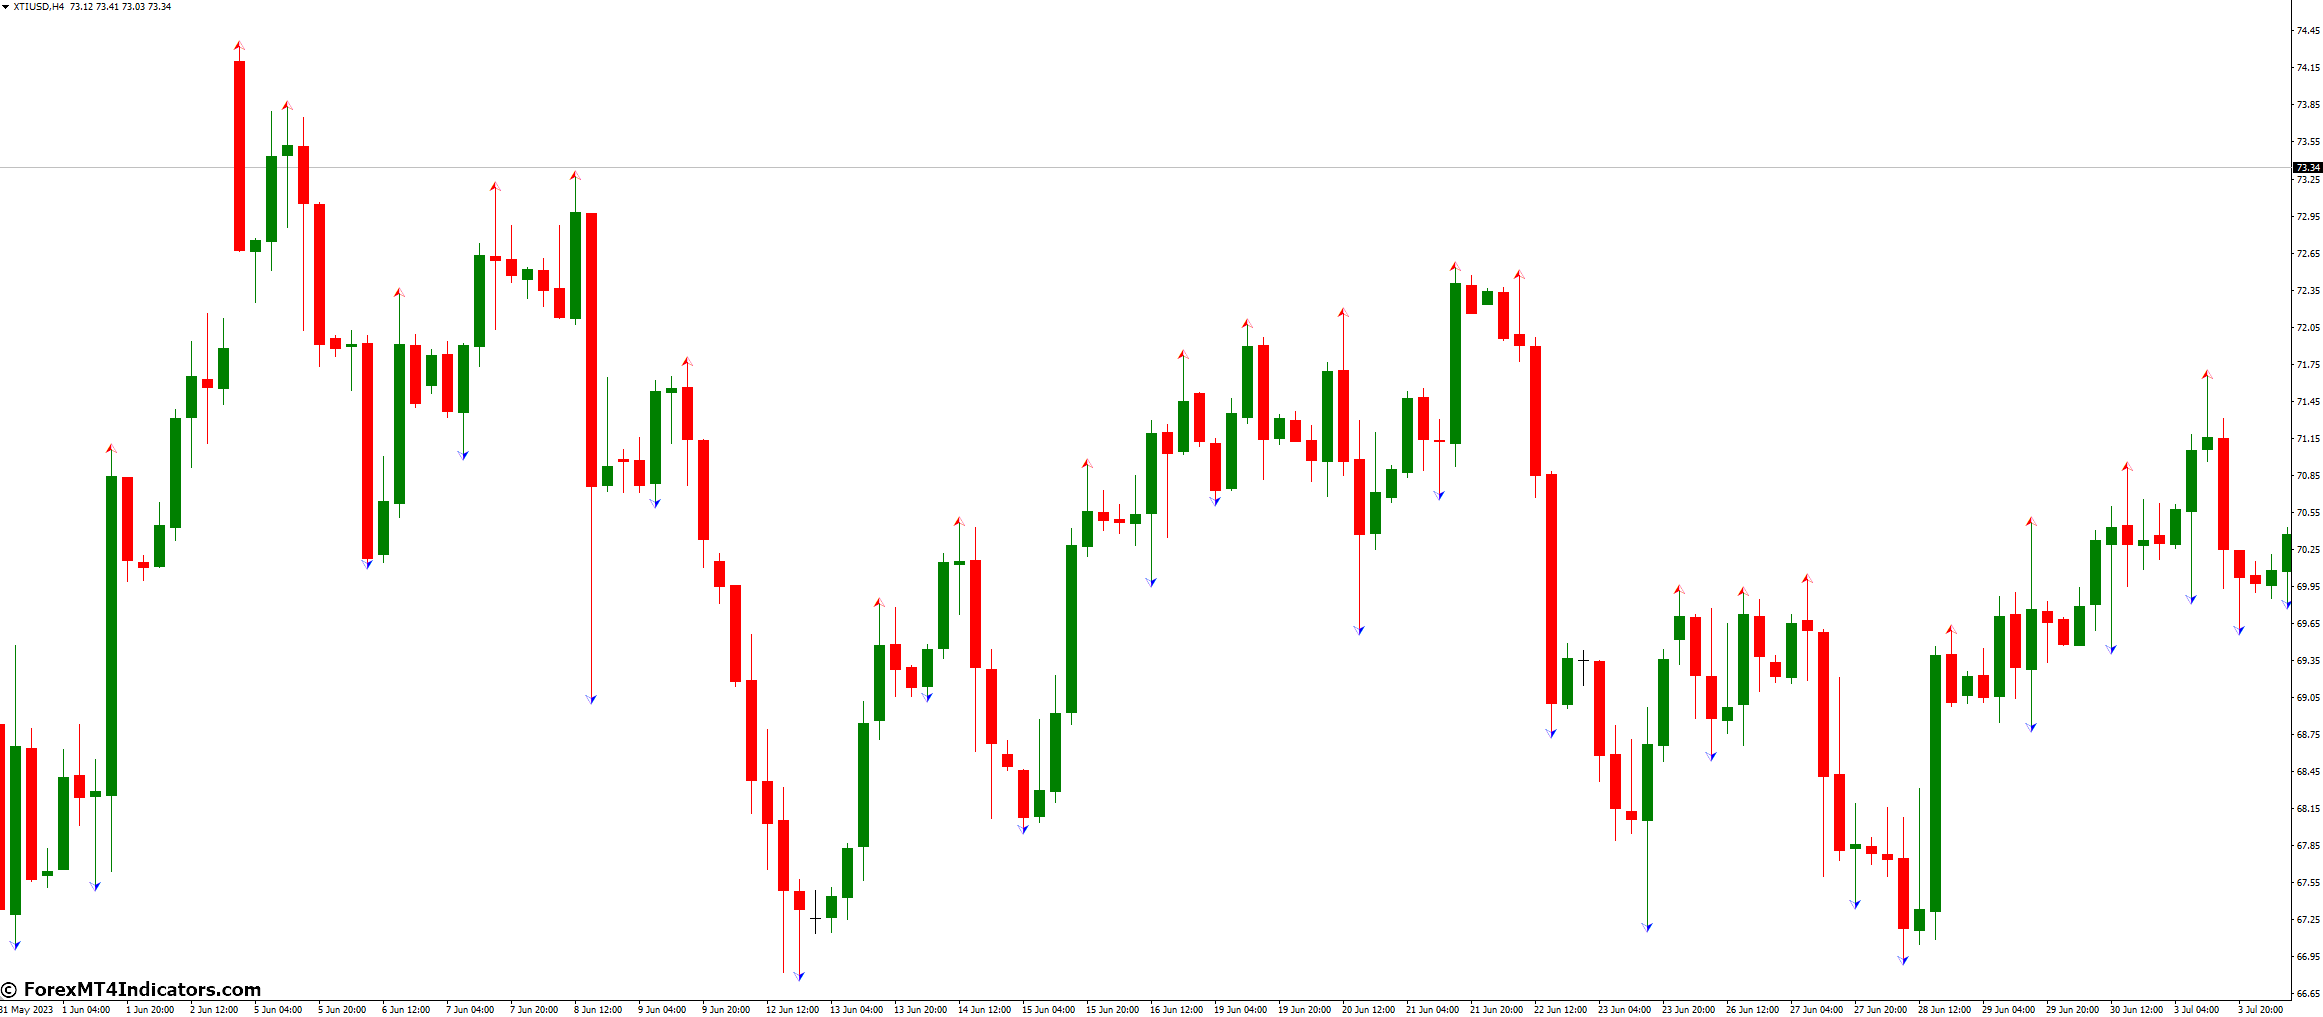
The Fractals Indicator identifies potential reversal points by looking for patterns in the price action of an asset. It does this by analyzing the highs and lows of the price action and looking for patterns that repeat themselves. When a pattern is identified, the indicator will draw an arrow above or below the candlestick to indicate a potential reversal point.
Why Is It Important?
The Fractals Indicator is important because it helps traders identify potential reversal points in the market. This can be useful for traders who are looking to enter or exit a trade at the right time. By identifying these reversal points, traders can make more informed trading decisions and potentially increase their profits.
What Are The Limitations?
While the Fractals Indicator can be a useful tool for traders, it is not without its limitations. One of the main limitations is that it can sometimes give false signals. This can happen when the price action is choppy or when there is a lot of noise in the market. Traders should always use the Fractals Indicator in conjunction with other technical analysis tools to confirm its signals.
What Are The Alternatives?
There are several alternatives to the Fractals Indicator that traders can use to identify potential reversal points in the market. Some of these alternatives include the Moving Average Convergence Divergence (MACD) Indicator, the Relative Strength Index (RSI) Indicator, and the Stochastic Oscillator Indicator.
Calculation of Fractals
The Fractals Indicator calculates potential reversal points by looking for patterns in the price action of an asset. It does this by analyzing the highs and lows of the price action and looking for patterns that repeat themselves. When a pattern is identified, the indicator will draw an arrow above or below the candlestick to indicate a potential reversal point.
Trading Strategies
There are several trading strategies that traders can use when trading with the Fractals Indicator. One popular strategy is to use the Fractals Indicator in conjunction with the Alligator Indicator to identify potential reversal points and confirm trends. Another strategy is to use the Fractals Indicator to identify potential reversal points and then use other technical analysis tools to confirm the signals.
Backtesting
Backtesting is an important part of any trading strategy. It involves testing a trading strategy on historical data to see how it would have performed in the past. Traders can use backtesting to test different trading strategies and see which ones are most effective when used with the Fractals Indicator.
Multiple Time Frame Analysis
Multiple Time Frame Analysis is a trading technique that involves analyzing the price action of an asset across multiple time frames. When used in conjunction with the Fractals Indicator, Multiple Time Frame Analysis can help traders identify potential reversal points and confirm trends.
Fractal Dimension
Fractal Dimension is a mathematical concept that is used to measure the complexity of a pattern. When applied to the Fractals Indicator, the Fractal Dimension can help traders identify patterns that are more likely to result in a reversal.
How to Trade with Fractals Indicator
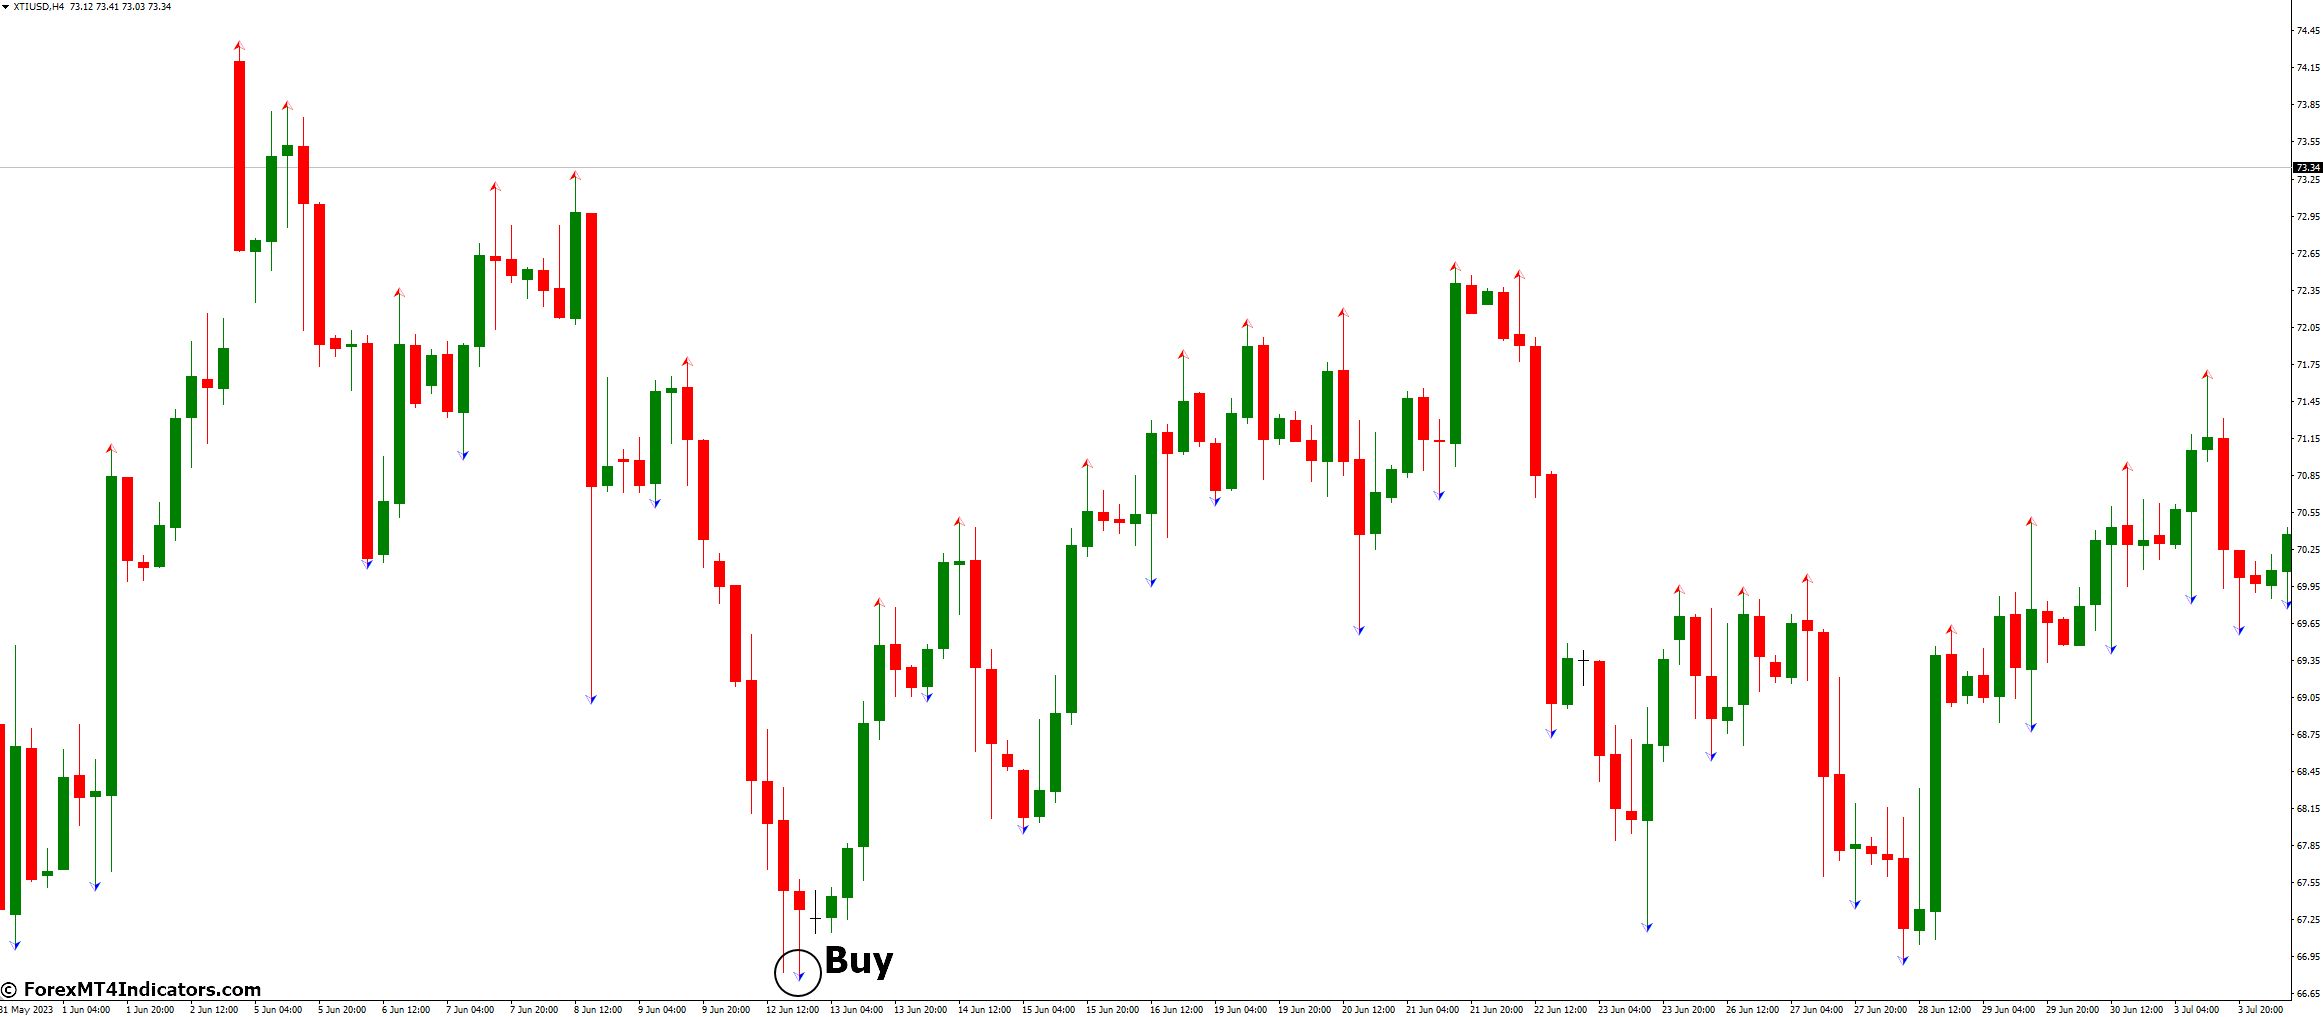
Buy Entry
- Wait for the Fractals Indicator to plot an up fractal on the chart.
- When the price breaks above the up fractal, it’s a signal to enter a buy trade.
- Place your stop-loss below the low of the fractal.
- Set your take-profit at a previous high or at a level where the risk-to-reward ratio is at least 1:2.
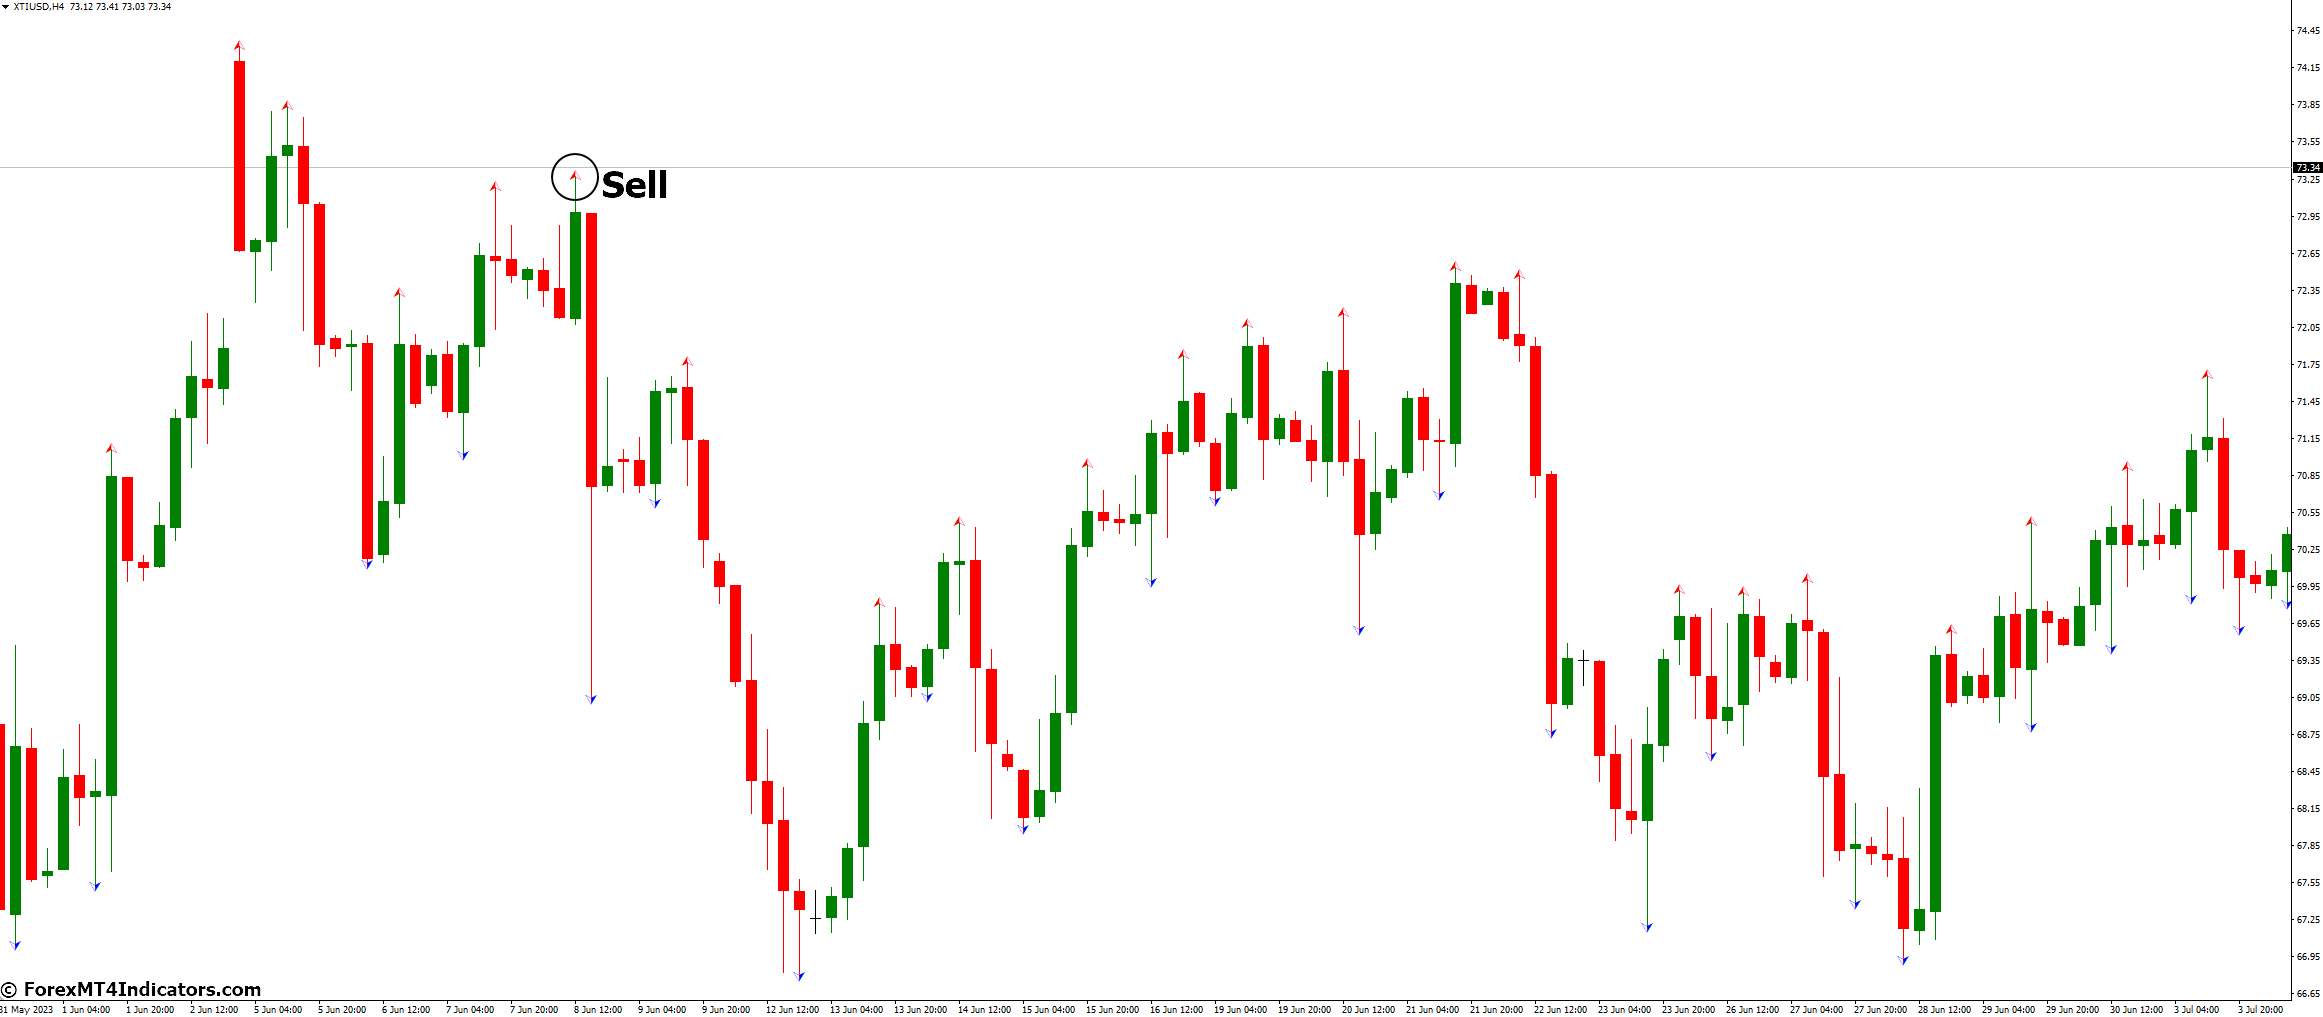
Sell Entry
- Wait for the Fractals Indicator to plot a down fractal on the chart.
- When the price breaks below the down fractal, it’s a signal to enter a sell trade.
- Place your stop-loss above the high of the fractal.
- Set your take-profit at a previous low or at a level where the risk-to-reward ratio is at least 1:2.
Conclusion
There are several advanced topics that traders can explore when using the Fractals Indicator. By understanding these topics, traders can take this as The Fractals Indicator is a technical analysis tool that helps traders identify potential buy and sell signals in the market.
Recommended MT4/MT5 Brokers
XM Broker
- Free $50 To Start Trading Instantly! (Withdraw-able Profit)
- Deposit Bonus up to $5,000
- Unlimited Loyalty Program
- Award Winning Forex Broker
- Additional Exclusive Bonuses Throughout The Year
>> Sign Up for XM Broker Account here <<
FBS Broker
- Trade 100 Bonus: Free $100 to kickstart your trading journey!
- 100% Deposit Bonus: Double your deposit up to $10,000 and trade with enhanced capital.
- Leverage up to 1:3000: Maximizing potential profits with one of the highest leverage options available.
- ‘Best Customer Service Broker Asia’ Award: Recognized excellence in customer support and service.
- Seasonal Promotions: Enjoy a variety of exclusive bonuses and promotional offers all year round.
>> Sign Up for FBS Broker Account here <<
(Free MT4 Indicators Download)
Click here below to download:


