


Momentum Swings are market scenarios wherein prices would rapidly move in one direction creating either a swing high or a swing low. These market scenarios often entice new traders to chase prices as momentum starts to break out. Chasing price on momentum breakouts is often not a good idea.
There are however ways we in which traders can trade in the direction of the momentum without chasing price. This is by trading on the pullback, which is what will be discussed here using the Donchian Channel Systems Indicator and the 20 EMA line.
Donchian Channel Systems
The Donchian Channel Systems is a trading technical indicator that is based on the Donchian Channel Indicator developed by Richard Donchian. This indicator was designed to help traders identify the direction of the market momentum based on the swing highs and swing lows of price action using a channel or band-like presentation of the market’s range.
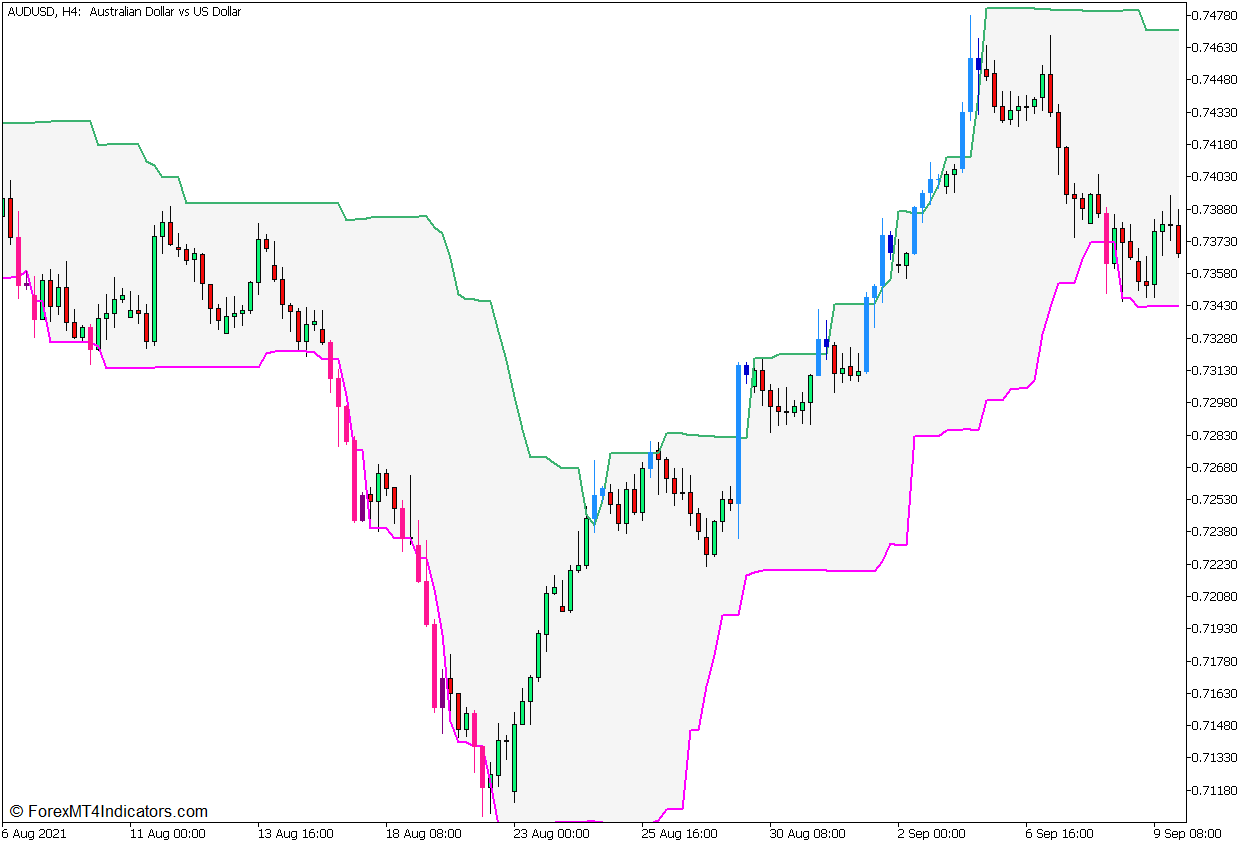
The Donchian Channel Indicator has an algorithm that detects the most recent swing highs and swing lows within a given period. This is typically preset as a 20-bar period. The indicator then draws two lines connecting the highest highs and lowest lows within a given period. This creates a channel-like structure that envelopes price action, shifting up and down as price action creates a new swing high or swing low.
The classic Donchian Channel Indicator also plots a middle line within the channel. This line is the median of price action within the given period. It is calculated by adding the highest high and the lowest low within the given period, and then dividing the sum by two.
The Donchian Channel Systems Indicator differs slightly from the classic Donchian Channel Indicator since it shifts the lines that it plots forward. This allows traders to visually identify newly formed swing highs and swing lows. It plots a deep pink bar whenever a bearish price candle forms a new low dropping below the lower line, and a purple line whenever a candle that is below the lower line forms a bullish candle. Inversely, it draws a dodger blue bar whenever a new swing high is formed, and a medium blue bar whenever a bearish candle forms above the upper line.
Traders may use this information to identify strong market momentum. The strong bullish market runs often cause the indicator to plot a dodger blue candle, while strong bearish momentum often causes the indicator to plot a deep pink candle.
20-Period Exponential Moving Average
Moving Average Lines are the most basic trend following technical indicators that traders use. Traders often identify the direction of the trend based on the general location of price action about its moving average line. Traders may also identify the direction of the trend based on the slope of its moving average line because moving average lines tend to follow the location of price action.
Moving Average Lines can also be used as dynamic support and resistance levels whenever the market is trending. Traders may use the area around price action as a support area whenever the market is bullish, or as a resistance area whenever the market is bearish.
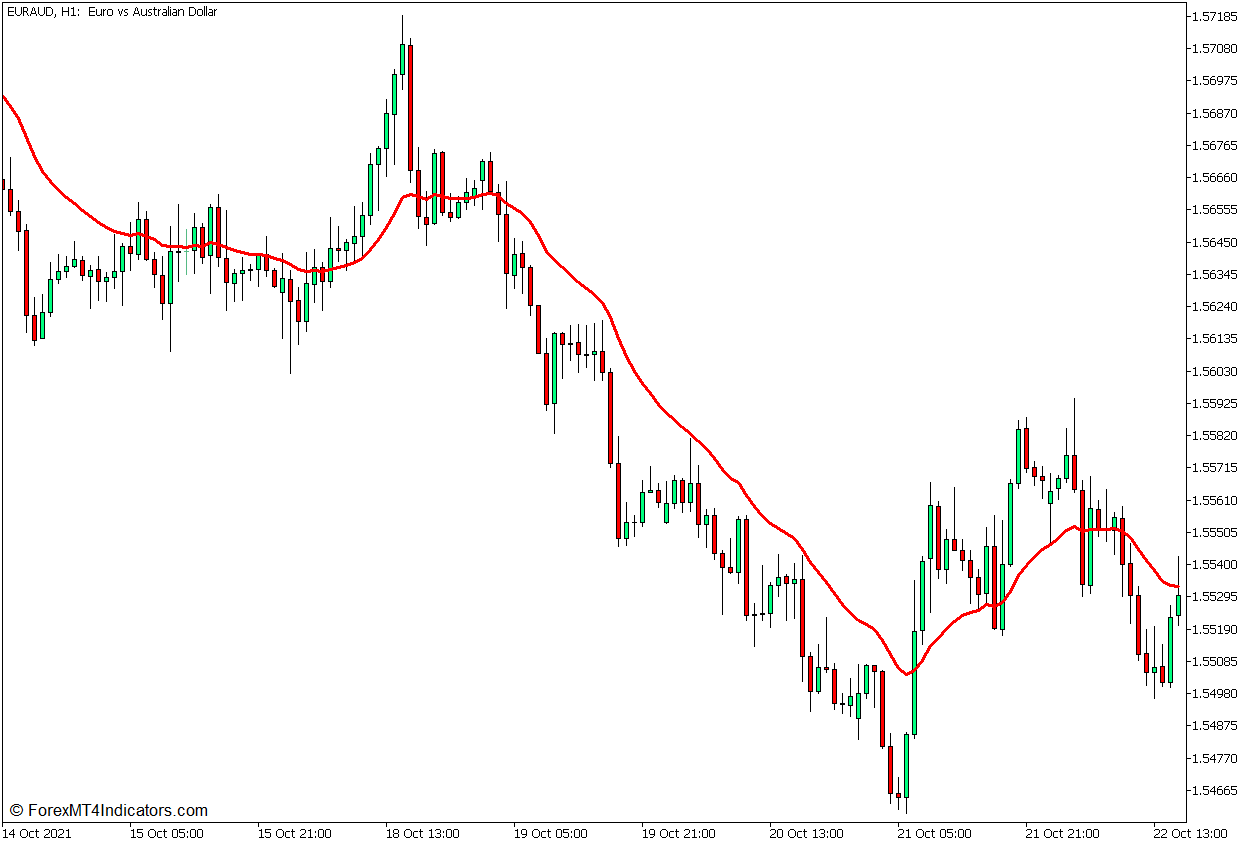
The 20-bar Exponential Moving Average (EMA) is one of the most popular moving average lines that traders use. This is because Exponential Moving Average lines tend to be very responsive to price action yet are also typically very smooth, creating a more reliable trend direction indication.
The 20 EMA line can be very useful for identifying short-term trend direction. Price action typically stays above the 20 EMA line whenever the market is in an uptrend, or below the 20 EMA line whenever the market is in a downtrend.
Incidentally, the 20 EMA line can also be effectively used as a Dynamic Area of Support or Resistance, depending on the direction of the trend. It can be used as a support area in an uptrend, or a resistance area in a downtrend.
Trading Strategy Concept
This trading strategy is a momentum continuation strategy that trades on the pullbacks that develop right after a strong momentum swing. To do this, we would need the Donchian Channel Systems Indicator, a 20 EMA line, and the Fibonacci Extension Tool.
The Donchian Channel Systems Indicator is used to spot strong momentum swings. This can be observed based on a strong momentum candle closing outside the Donchian Channel and the changing of the color of the line.
Price is then allowed to pull back towards the area of the 20 EMA line right after the strong momentum swing.
As soon as the price touches the area around the 20 EMA line, we should then observe a price rejection of the said area, indicating that the price has ended its pullback and is about to continue its strong momentum swing.
The Fibonacci Extension Tool is then drawn on the swing points of the momentum swing and towards the pullback swing. This is then used as a basis for identifying trade exits, which would primarily be the 100% Fibonacci Extension.
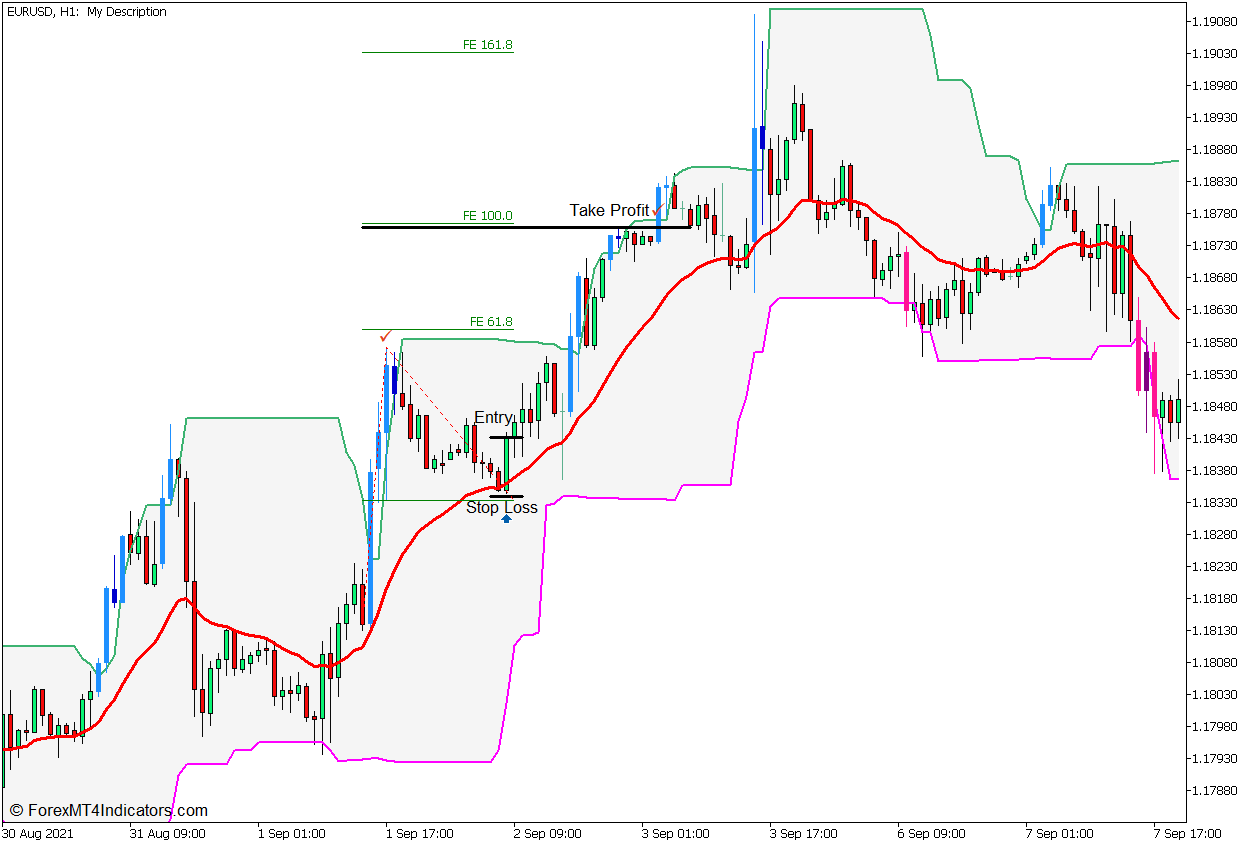
Buy Trade Setup
Entry
- A strong bullish momentum candle should swing above the upper line of the Donchian Channel Systems and draw a dodger blue candle.
- Price should pull back towards the 20 EMA line.
- Open a buy order if a bullish price rejection pattern forms near the 20 EMA line.
Stop Loss
- Set the stop loss on the fractal below the entry candle.
Exit
- Draw a Fibonacci Extension Tool on the swing points and set the 100% level as the take profit target.
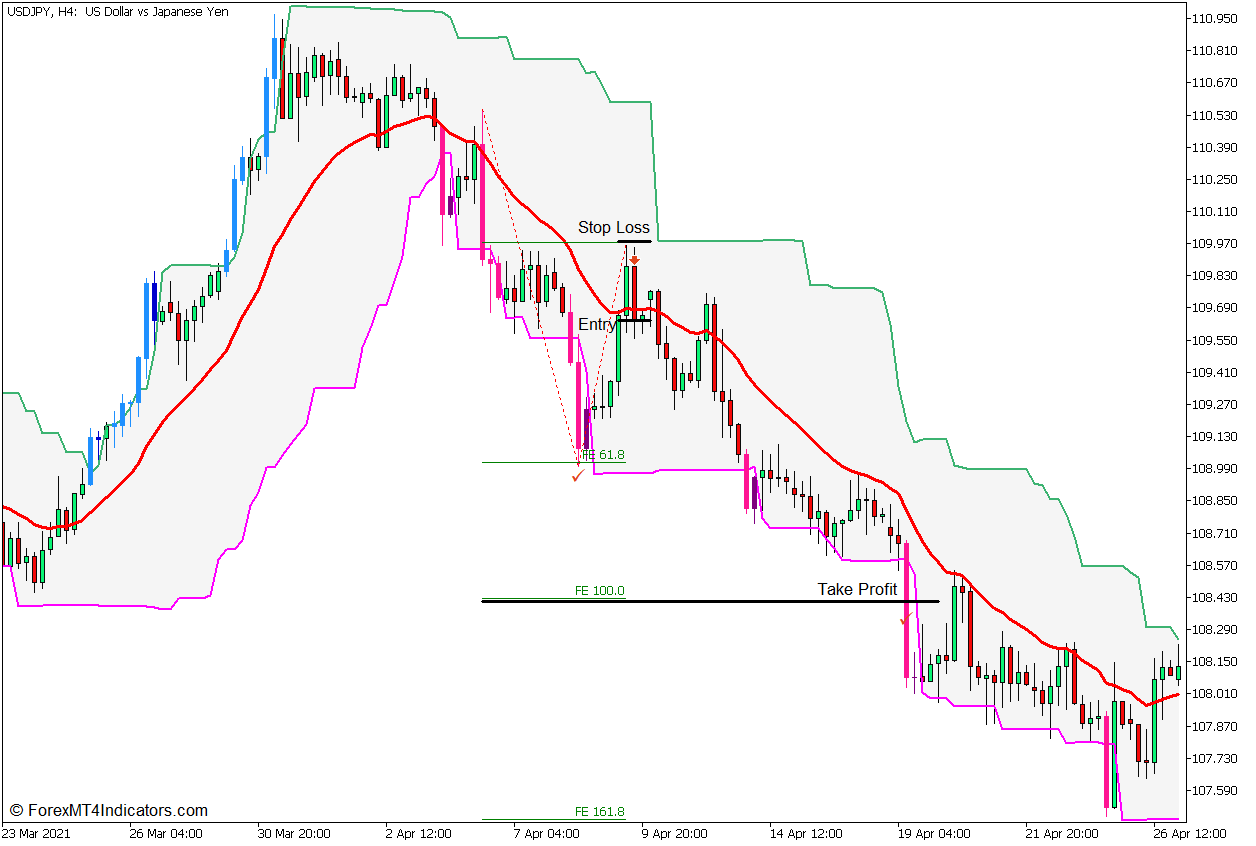
Sell Trade Setup
Entry
- A strong bearish momentum candle should swing below the lower line of the Donchian Channel Systems and draw a deep pink candle.
- Price should pull back towards the 20 EMA line.
- Open a sell order if a bearish price rejection pattern forms near the 20 EMA line.
Stop Loss
- Set the stop loss on the fractal above the entry candle.
Exit
- Draw a Fibonacci Extension Tool on the swing points and set the 100% level as the take profit target.
Conclusion
This is an excellent momentum trading strategy that traders can easily use. This strategy tends to develop in conjunction with flag and pennant patterns, which are continuation trading patterns that form a sequence of a strong momentum swing and a market pullback.
With that said, this strategy requires traders to practice and observe the market first before trading it consistently. Traders should instinctively identify the characteristics of a momentum breakout and pullback to trade this strategy effectively.
Recommended MT5 Brokers
XM Broker
- Free $50 To Start Trading Instantly! (Withdraw-able Profit)
- Deposit Bonus up to $5,000
- Unlimited Loyalty Program
- Award Winning Forex Broker
- Additional Exclusive Bonuses Throughout The Year

>> Sign Up for XM Broker Account here <<
FBS Broker
- Trade 100 Bonus: Free $100 to kickstart your trading journey!
- 100% Deposit Bonus: Double your deposit up to $10,000 and trade with enhanced capital.
- Leverage up to 1:3000: Maximizing potential profits with one of the highest leverage options available.
- ‘Best Customer Service Broker Asia’ Award: Recognized excellence in customer support and service.
- Seasonal Promotions: Enjoy a variety of exclusive bonuses and promotional offers all year round.

>> Sign Up for FBS Broker Account here <<
Click here below to download: