CCI Strength Forex Trading Strategy
There are thousands of different indicators available in the trading world as of today. Among those, there will be rubbish indicators, while many could and would also work. You could even pick out any built-in trading indicator available on your trading platform and make it work for you.
But you may say, “Why am I not making money with what I’m currently using?” It most likely isn’t the indicators fault, but instead your approach on how you use it.
You see, trading indicators are simply mathematical equations that plot lines on the price chart or plot a chart on another window, which are derived from price itself. Its purpose is basically given on how it is called – to “indicate” what price is doing based on an objective, data driven, mathematical equation. Notice that it is not called a “predictor” but rather an “indicator”. It couldn’t tell you what price will do, but it could give you an idea of what price has greater odds of doing based on how it has behaved in the past. In a way, indicators allow traders to make a sense of what the market condition is and what price is doing. It is more of a wind vane pointing where the wind is blowing, giving traders an idea which way direction has lesser headwinds.
Some traders get how indicators should be used, just as a way of reading the market condition. Still, they read the market condition wrongly because of how they use and read the indicator. What could be a fresh trend might be read as a market reversal condition. What could be a retracement might be seen as an end of a trend. This could be because of the wrong approach on how the indicator is used.
A Different Lens on the CCI
The Commodity Channel Index (CCI) is an indicator developed by Donald Lambert. It is an oscillating indicator that compares the current price to the historical average price based on the simple moving average of the high, low and close. The difference is that it is formulated in a way that 70% – 80% of the figures would fall within the +/-100 range. Any price that corresponds to the CCI going over this range is something that could impact market condition, simply because it is out of the usual range.
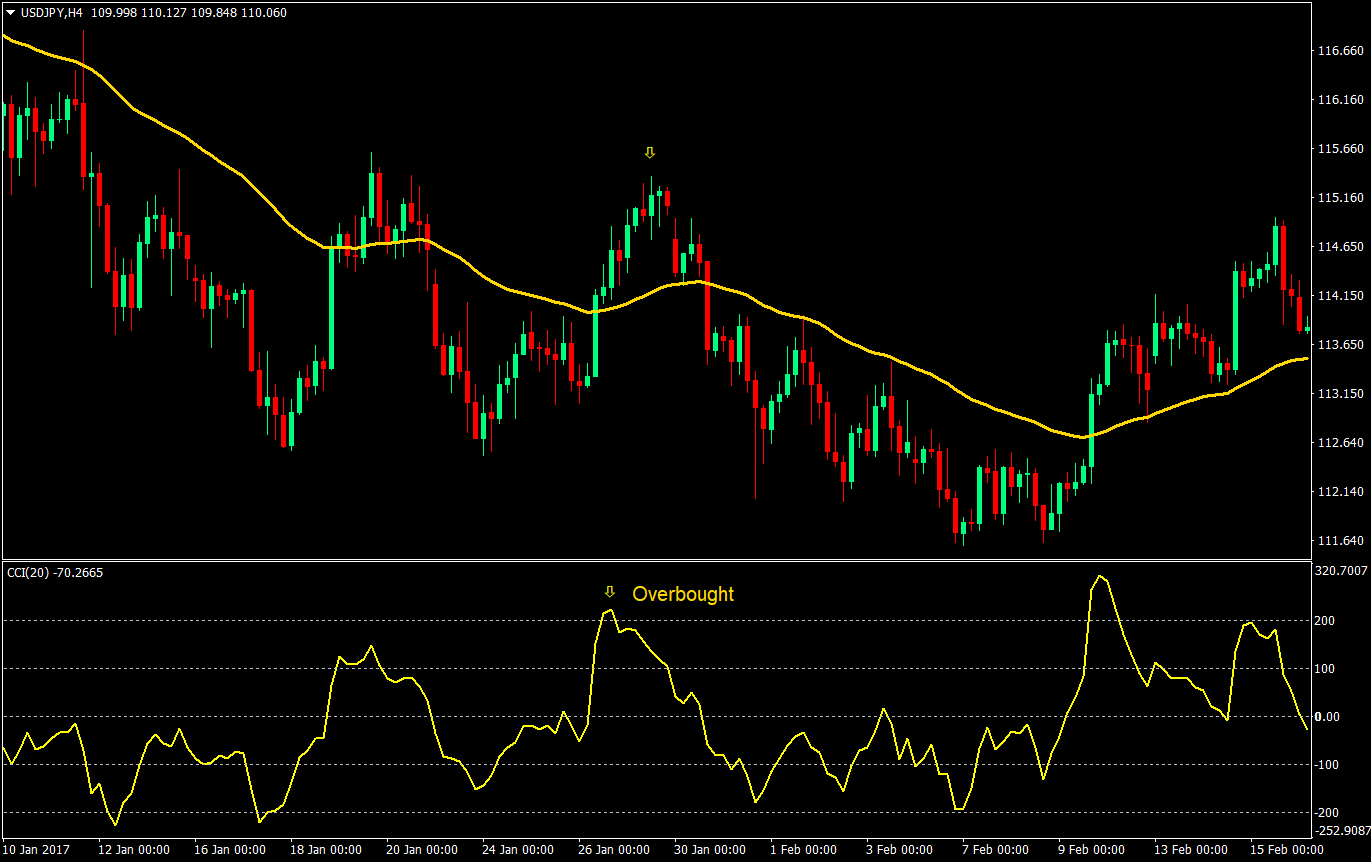
Many people use it as an overbought-oversold indicator. I’m not saying that it is wrong. It could work. In fact, in a ranging market environment, using the CCI as a mean reversion indicator could work.
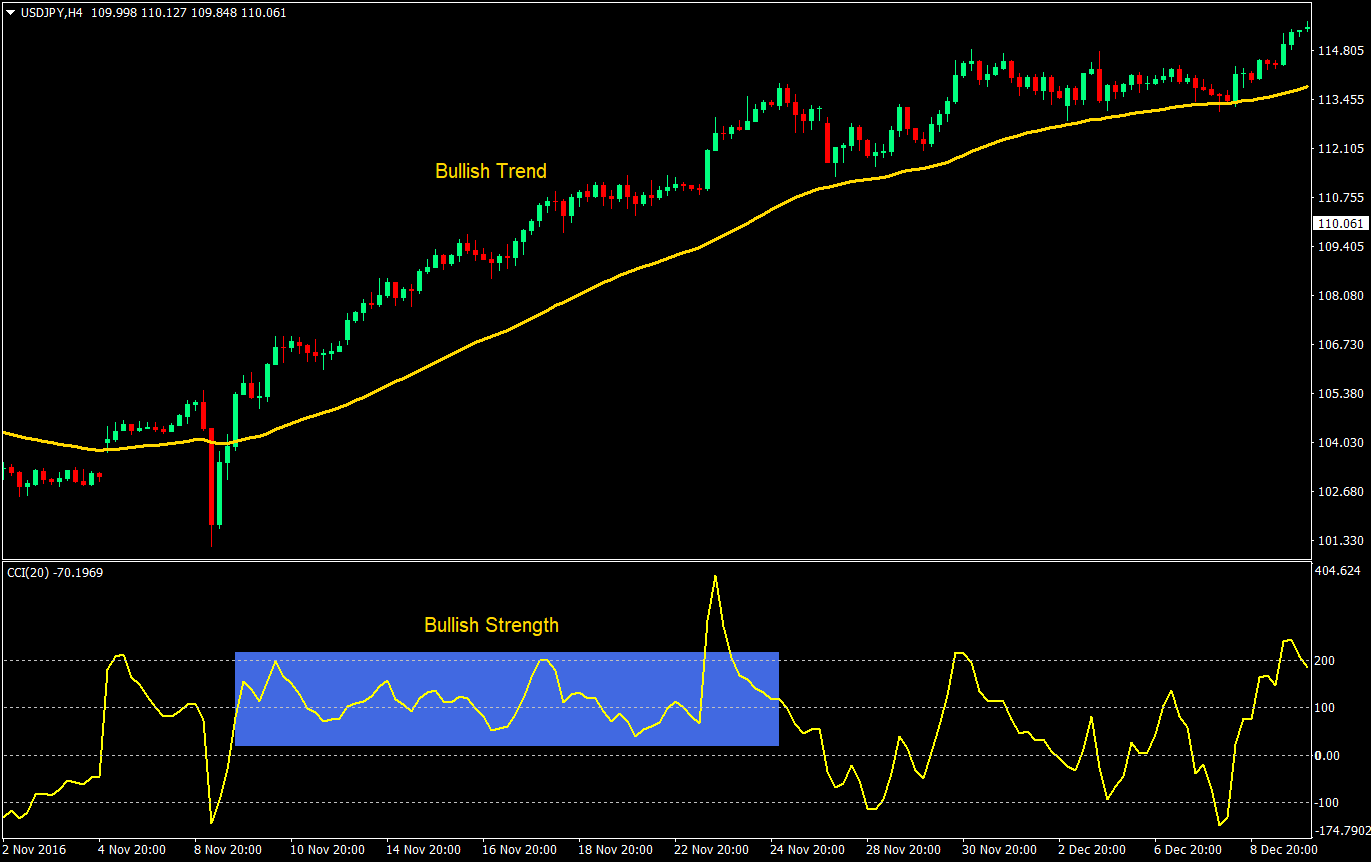
But this is not the only way to read it. You see, if the CCI goes over this range, it could also mean strength or a momentum shift. This is usually the case when a fresh trend is starting or is already established. In fact, during a trending market environment the CCI tends to hover around or over the +100 or -100.
Trading Strategy Concept
This strategy is based on reading the market correctly on a fresh trend and entering on retracements based on the CCI indicator.
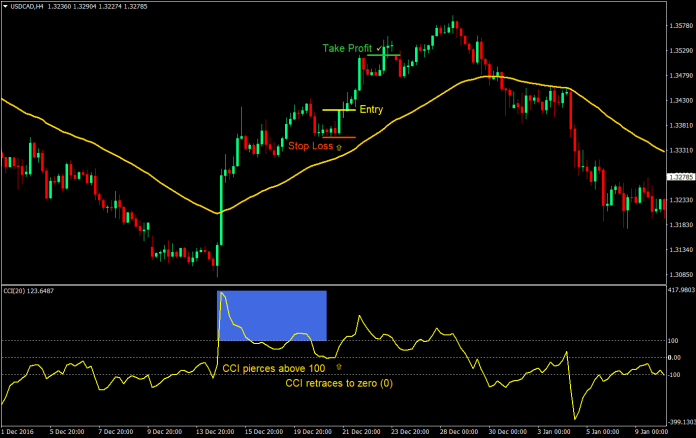
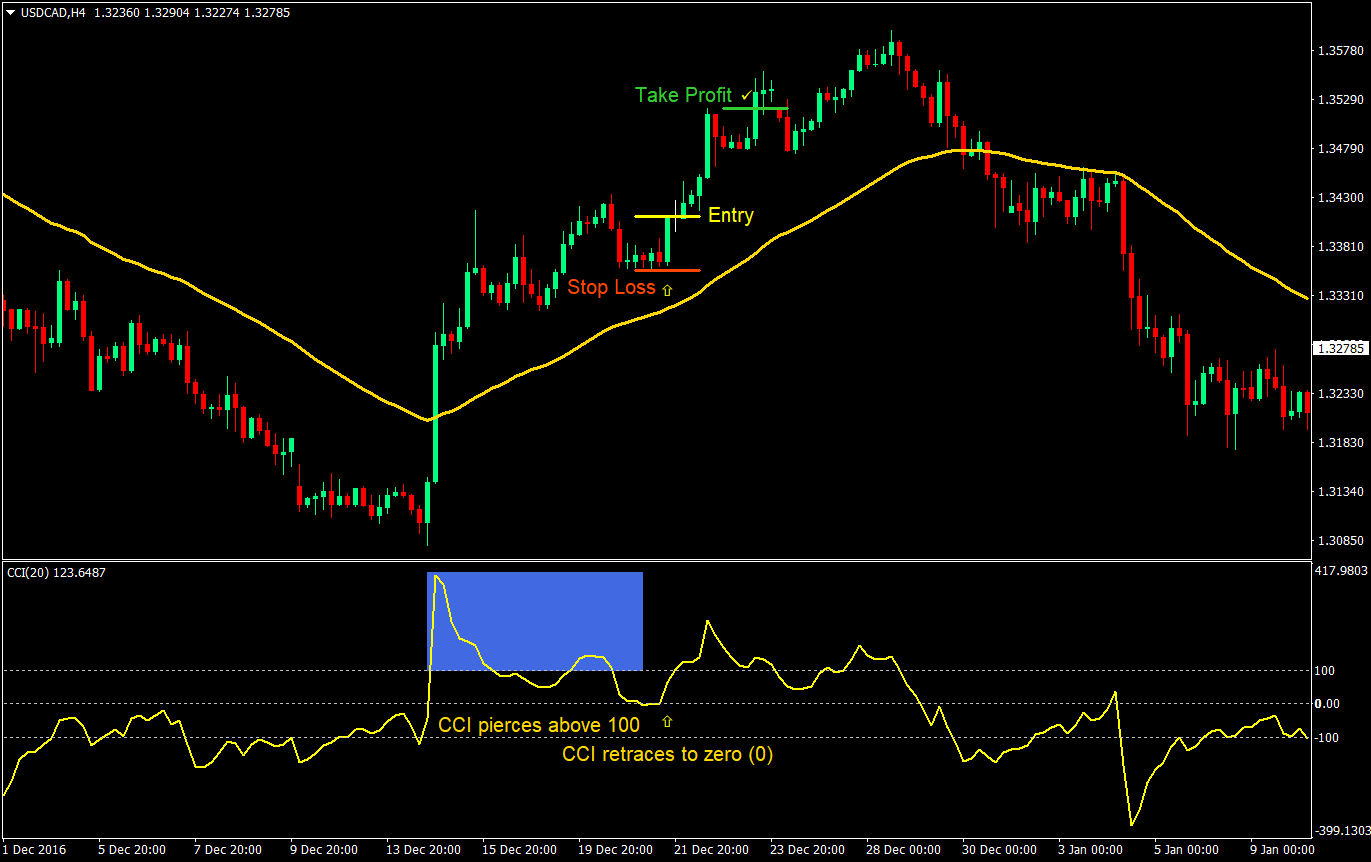
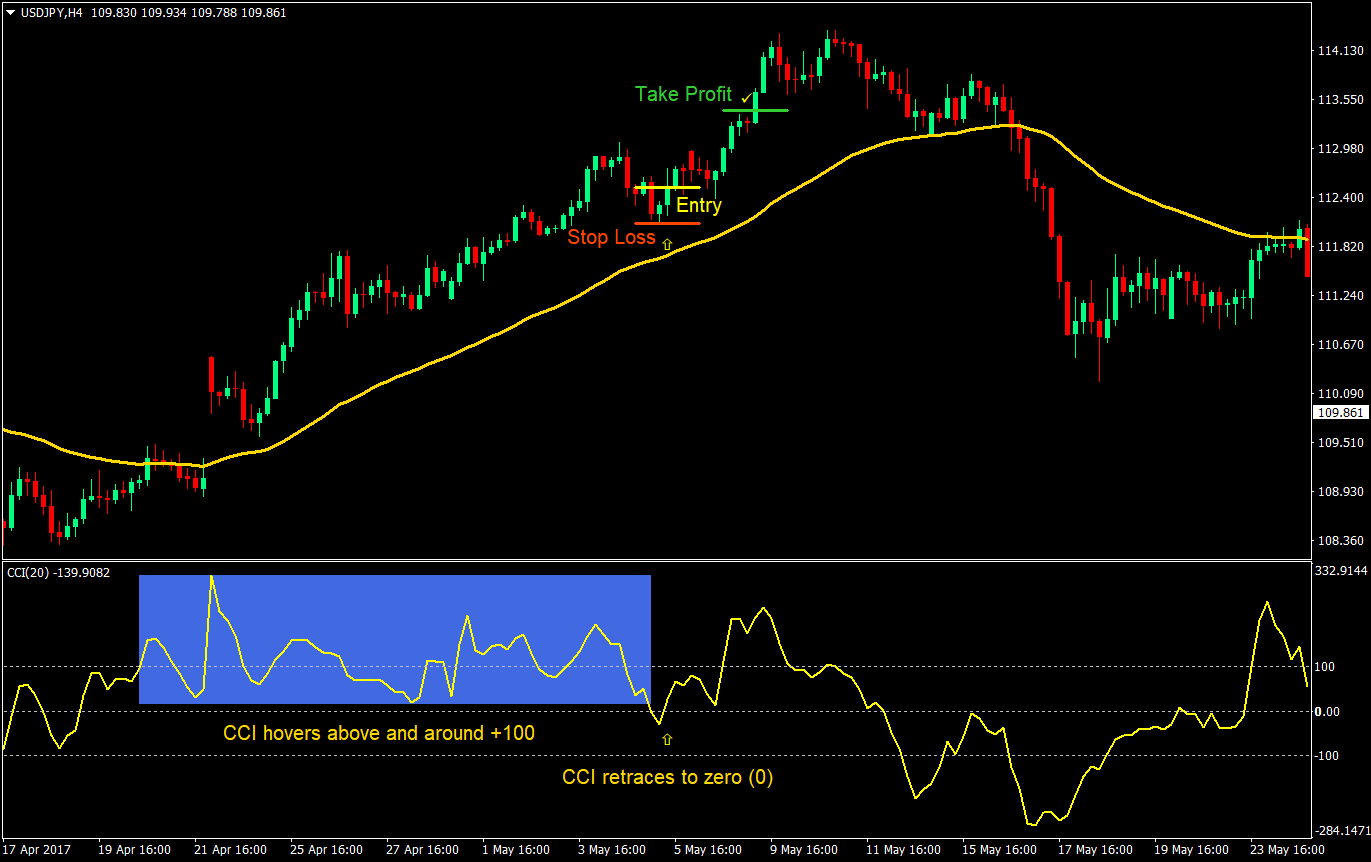
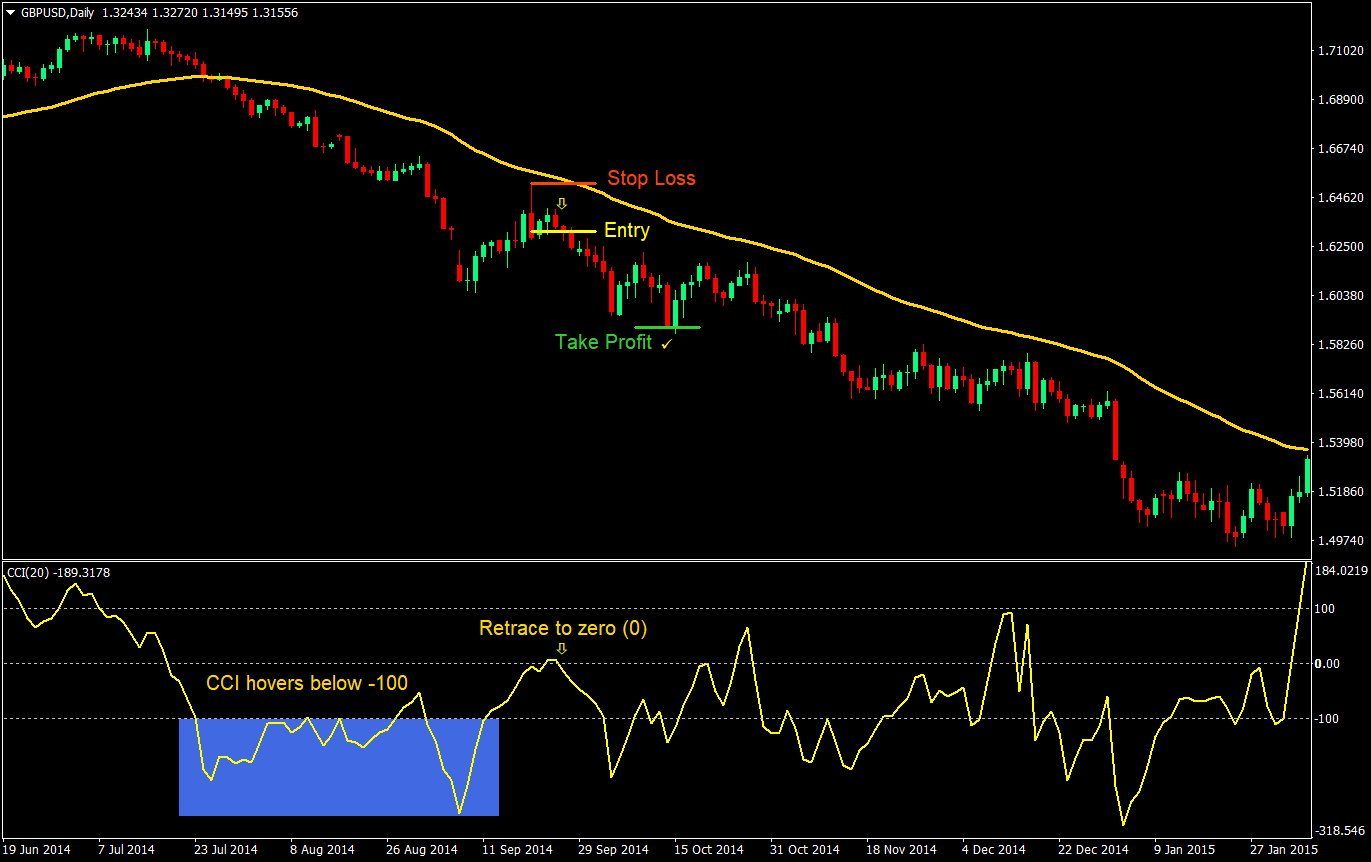
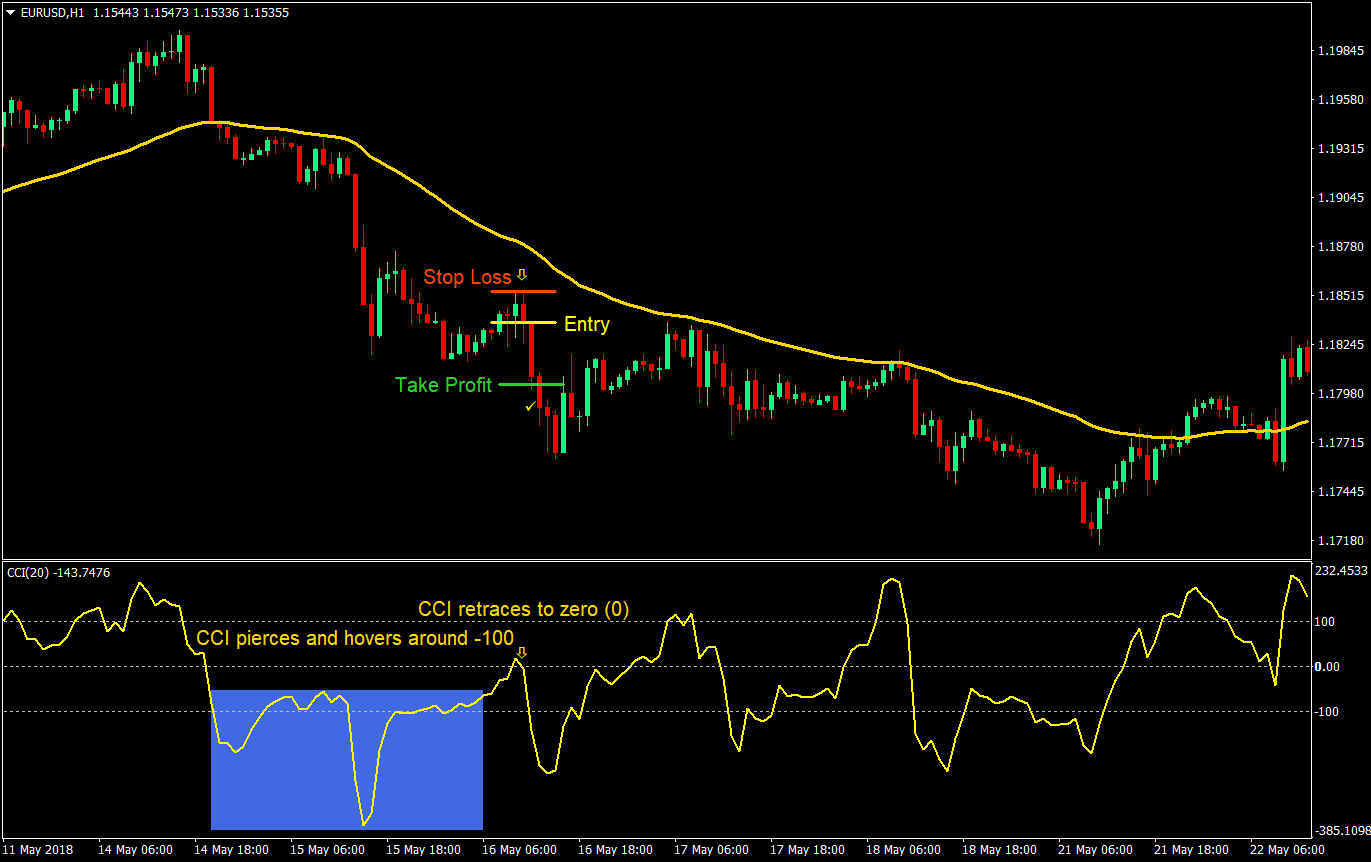
Knowing that the CCI tends to hover around the +100 or -100 on a trending market environment, we will be looking for a condition wherein it pierces over these figures indicating a probable start of a fresh trend or momentum. This should then be followed by a hover around this area, then a retrace to the zero level. The retrace should then be our entry point as this could be the area where price would resume the trend.
We will also be using the 50 Exponential Moving Average (EMA) just to filter out trades and identify fresh trends. Fresh trends usually coincide with price piercing over the 50 EMA with a momentum candle.
Indicators
- 50-period EMA (Gold)
- 20-period CCI
Currency Pairs: any
Timeframe: 1-hour and above
Trading Session: any
Buy (Long) Trade Setup Rules
Entry
- Price should be above the 50 EMA
- The CCI should pierce above the +100 level
- CCI should hover around +100 level a bit
- The CCI should retrace to zero
- Enter a buy market order as soon as the CCI hooks back up indicating a possible trend resumption
Stop Loss
- Set the stop loss at the swing low below the entry candle
Take Profit
- Set the take profit target at 2x the risk on the stop loss
Sell (Short) Trade Setup Rules
Entry
- Price should be below the 50 EMA
- The CCI should pierce below the -100 level
- CCI should hover around -100 level a bit
- The CCI should retrace to zero
- Enter a sell market order as soon as the CCI hooks back down indicating a possible trend resumption
Stop Loss
- Set the stop loss at the swing high above the entry candle
Take Profit
- Set the take profit target at 2x the risk on the stop loss
Conclusion
This is a standard trend following strategy using retracements as entry points. The difference is that we are using the CCI to indicate the strength of a crossover and a start of the new trend. By doing this, we are able to read the CCI correctly whenever a fresh trend is starting and when the probable entry points could be.
Using the CCI as an entry point though is not an exact entry. There will be times when price could stall a bit prior to continuing the trend. This is why we should set the stop loss at a logical point. A point which would invalidate our position because it is more likely that the trend will reverse.
This is not a purely “if-then” type of strategy. There is some form of discretionary observation that comes along with it. So, take time to practice it and develop the skill of reading trending market conditions.
Recommended MT4 Broker
- Free $50 To Start Trading Instantly! (Withdrawable Profit)
- Deposit Bonus up to $5,000
- Unlimited Loyalty Program
- Award Winning Forex Broker
- Additional Exclusive Bonuses Throughout The Year
>> Claim Your $50 Bonus Here <<
Click here below to download:


