


The trend is your friend!” You have probably heard this preached by many traders time and time again. This statement has been used and overused and is has become a trite adage among traders, but this is for a reason. This statement carries a lot of truth in it because it allows traders to take trade opportunities with a very high probability of gaining a profit on each trade. If managed correctly, traders can also maximize the potential profits on a trending market which could then result in high average yields per trade.
There are two ways to enter a trade in a trending market. One is to trade on breakouts as the price tries to continue pushing higher. This is a viable option as the price could gain momentum on the lower timeframes as it breaks a minor support or resistance level. However, a better option would be to wait for the dips or pullbacks. This is because trading on pullbacks means you are not chasing price and you are entering the market at a better price point. One way to do this is to look for temporary overbought or oversold price conditions caused by a pullback and trade in the direction of the trend as the pullback ends.
This strategy is an example of how we can trade trend continuation setups on deep pullbacks and maximize profits on a trend by holding the trade until the end of the trend.
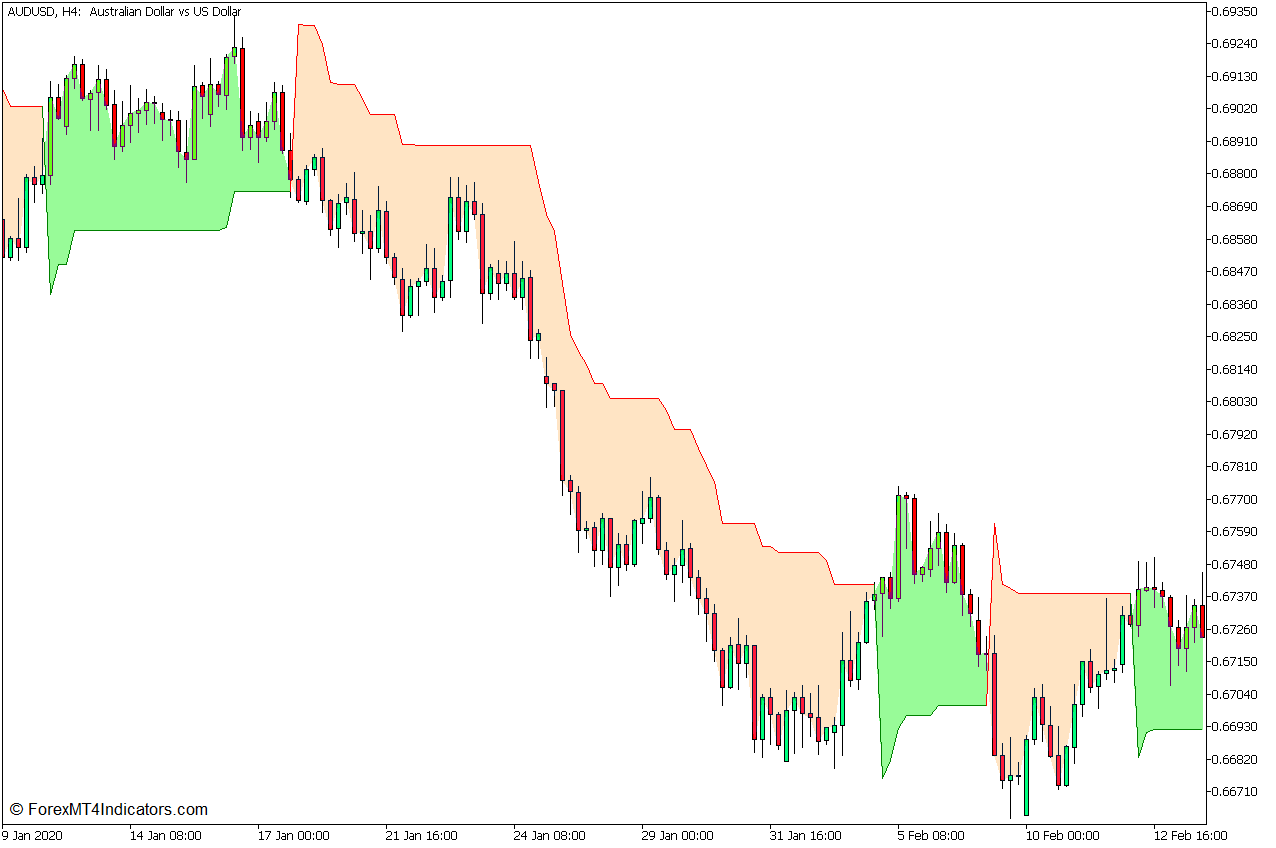
Supertrend Indicator
One way traders identify trend direction and trend reversals is with the use of the Average True Range (ATR). This is based on the price reversing against the current trend direction by a multiple of the ATR. For example, if the basis was a multiple of three times the ATR if the price reverses against the current trend direction by more than three times the ATR, then the trend would have reversed.
The Supertrend Indicator is based on this concept. It plots a green line below price action with a pale green shade on the area between the price and the line whenever it detects an uptrend. It also plots a red line above price action with a bisque shade between the price and the line whenever it detects a downtrend. The line shifts and changes color whenever the price crosses and closes over the line moving against the direction of the prior trend.
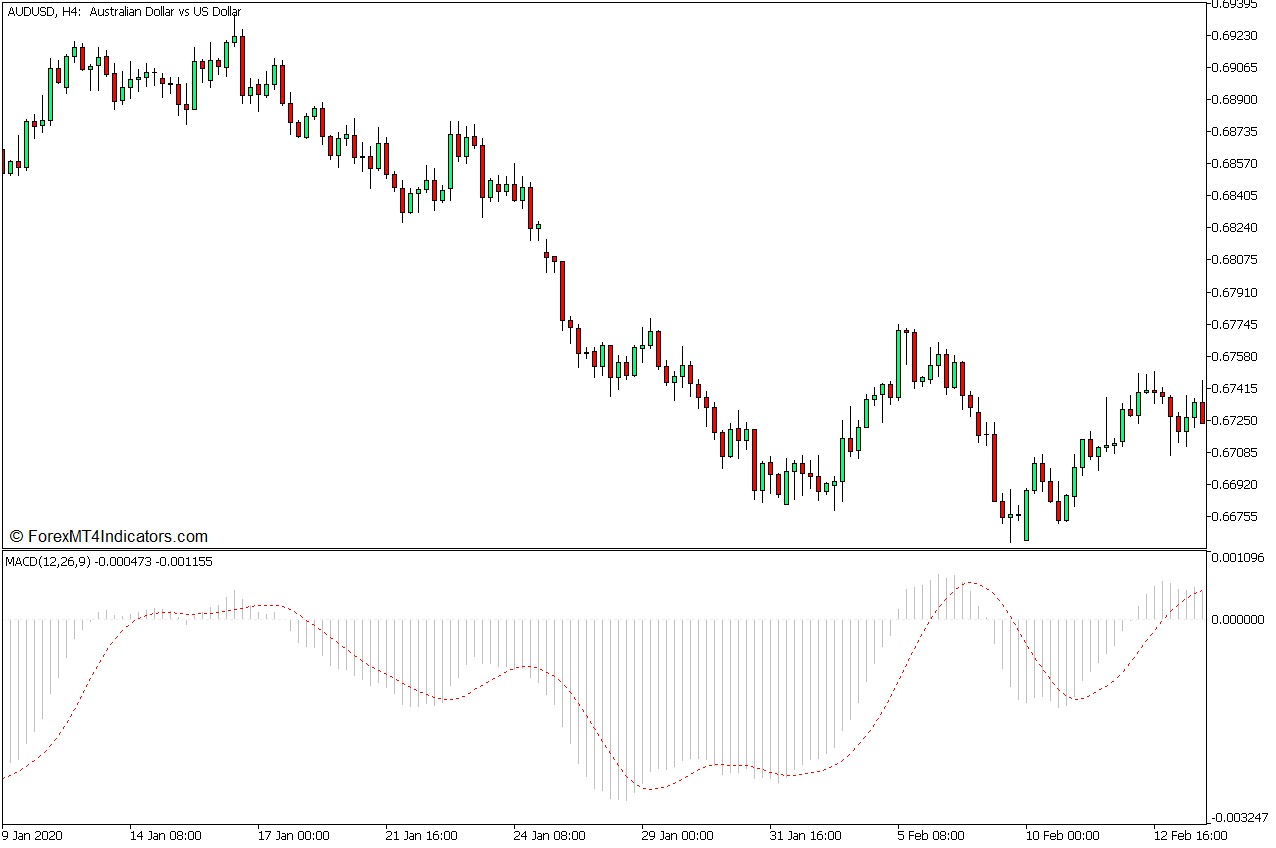
Moving Average Convergence and Divergence
The Moving Average Convergence and Divergence (MACD) is a momentum indicator that is presented as an oscillator.
The MACD is somehow derived from an underlying crossover of moving average lines. It computes the difference between two underlying Exponential Moving Average (EMA) lines. The result is then plotted as MACD bars. Positive MACD bars indicate a bullish trend bias, while negative MACD bars indicate a bearish trend bias.
This indicator also computes for a signal line which is a Simple Moving Average (SMA) of the MACD bars. The result is then plotted as a line, which is also displayed on the indicator window. Momentum can be identified based on how the two lines interact. Momentum is bullish whenever the MACD bars are above the signal line, and bearish whenever the MACD bars are below the signal line. Consequently, crossovers between the MACD bars and the signal line can signify a momentum reversal.
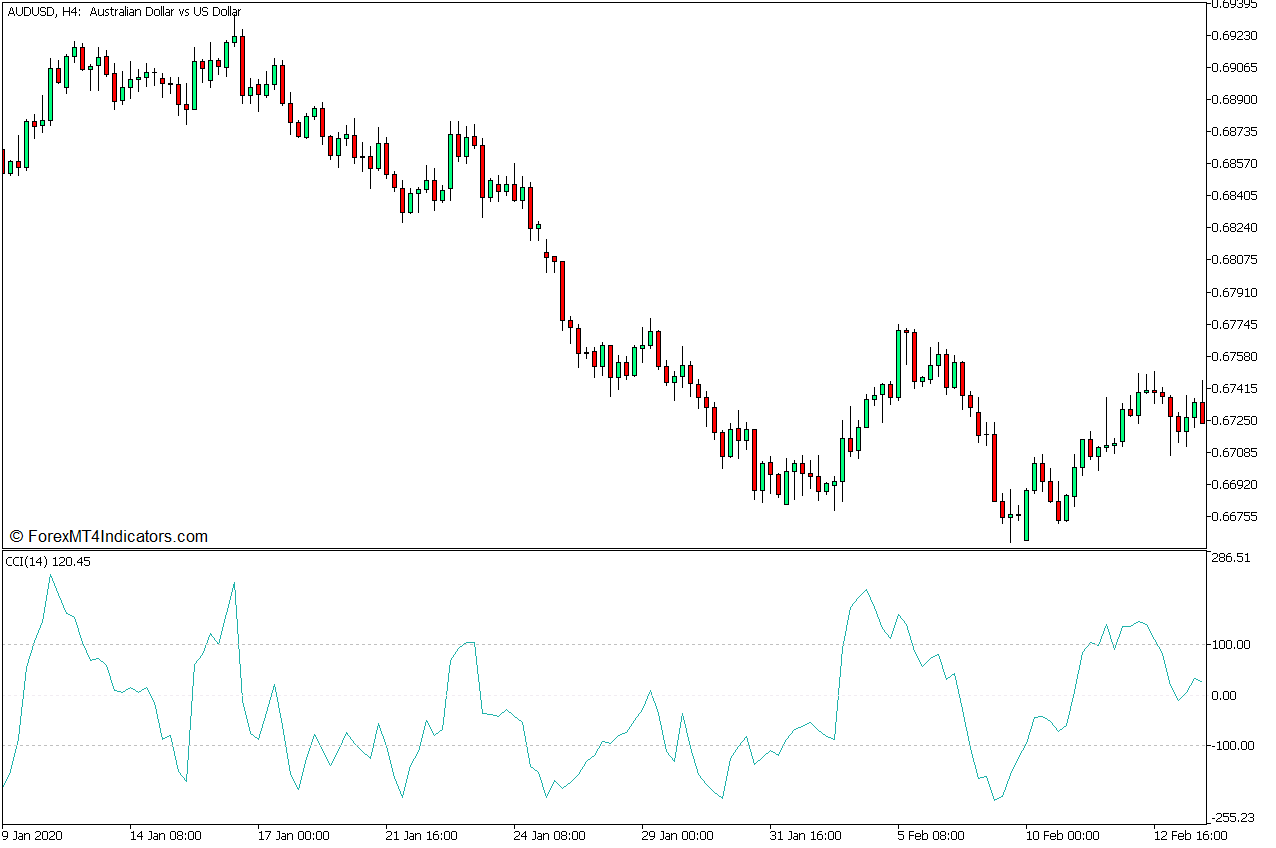
Commodity Channel Index
The Commodity Channel Index (CCI) is another momentum technical indicator that is also presented as an oscillator.
The CCI identifies momentum by comparing price movements with the average price. It does this by subtracting a Simple Moving Average from the Typical Price, which is the average of the high, low, and close of a bar. The difference is then normalized to identify the normal range and its outliers.
The range of the CCI typically has markers at levels 100 and -100, while its midpoint is at zero. A CCI line above 100 is indicative of an overbought market, while a CCI line which is below -100 is indicative of an oversold market, both of which are prime conditions for a possible mean reversal. However, the price may continue its trajectory despite these indications if momentum is strong.
Trading Strategy Concept
This trading strategy is a trend continuation strategy that trades on a deep pullback and closes the trade at the end of the trend using the Supertrend Indicator, the MACD, and the CCI.
The Supertrend Indicator would be used as the initial trend direction indicator. Trades are taken only in the trend direction indicated by the Supertrend line.
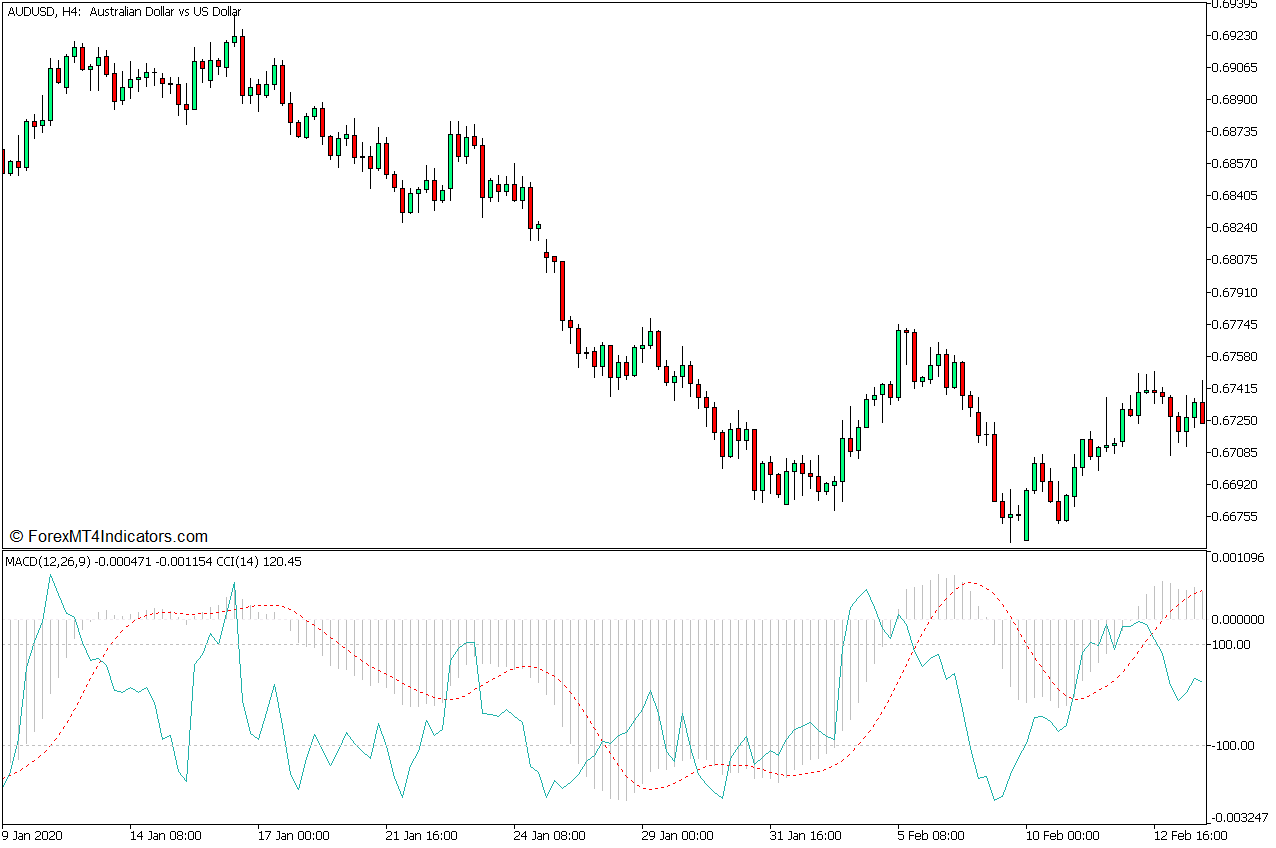
Although it is not a common practice, it is possible to overlay two oscillators one on top of the other. This would allow us to view the signals quite easily.
The MACD will be used to identify trend direction based on whether the MACD bars are positive or negative.
The CCI on the other hand will be used to identify overbought and oversold conditions based on lines spiking beyond the -100 to 100 range. These scenarios would develop whenever the price would have a deep pullback while still maintaining the trend direction.
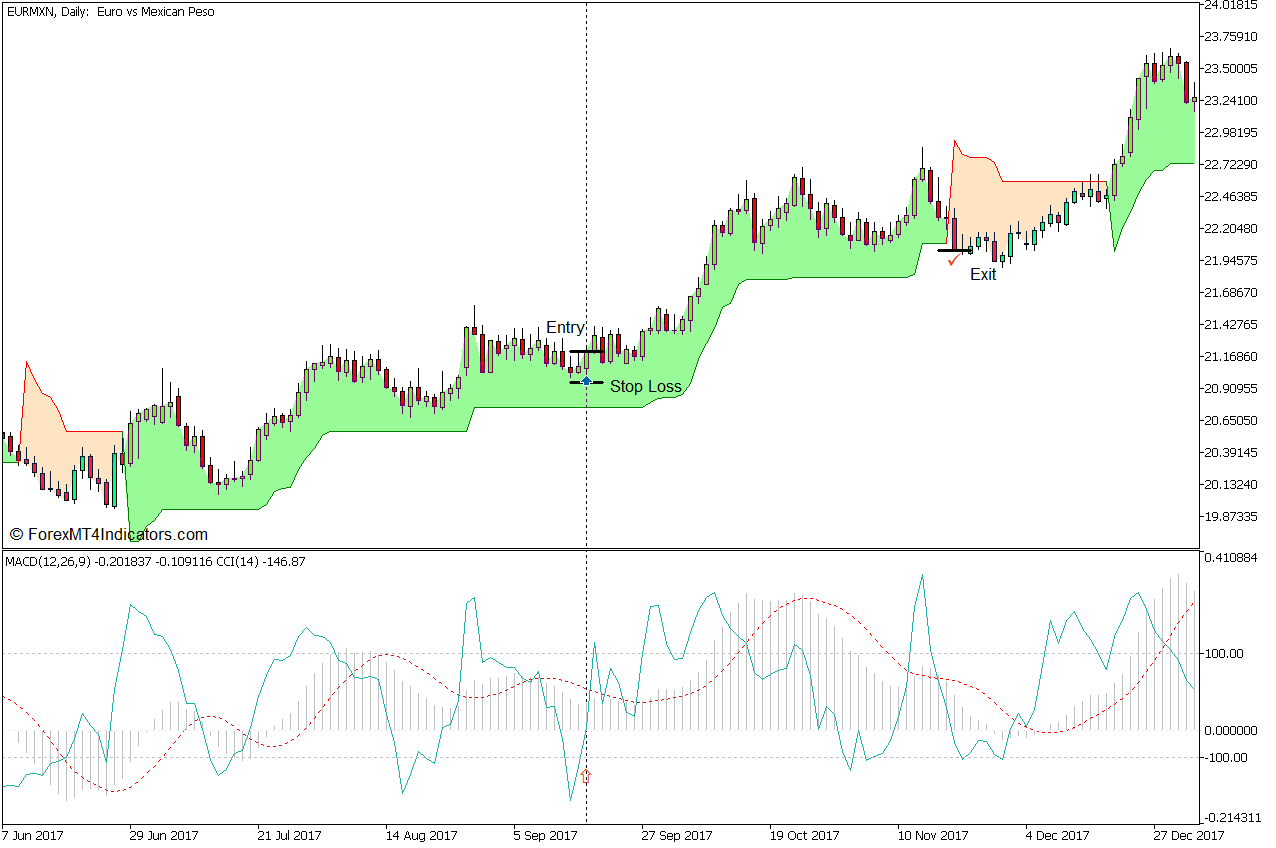
Buy Trade Setup
Entry
- The MACD bars should be positive.
- Price action should be above the Supertrend line while the line is green.
- Wait for the CCI line to dip below -100.
- Enter a buy order as soon as the CCI line crosses back above -100.
Stop Loss
- Set the stop loss on the support below the entry candle.
Exit
- Close the trade as soon as the price closes below the Supertrend line.
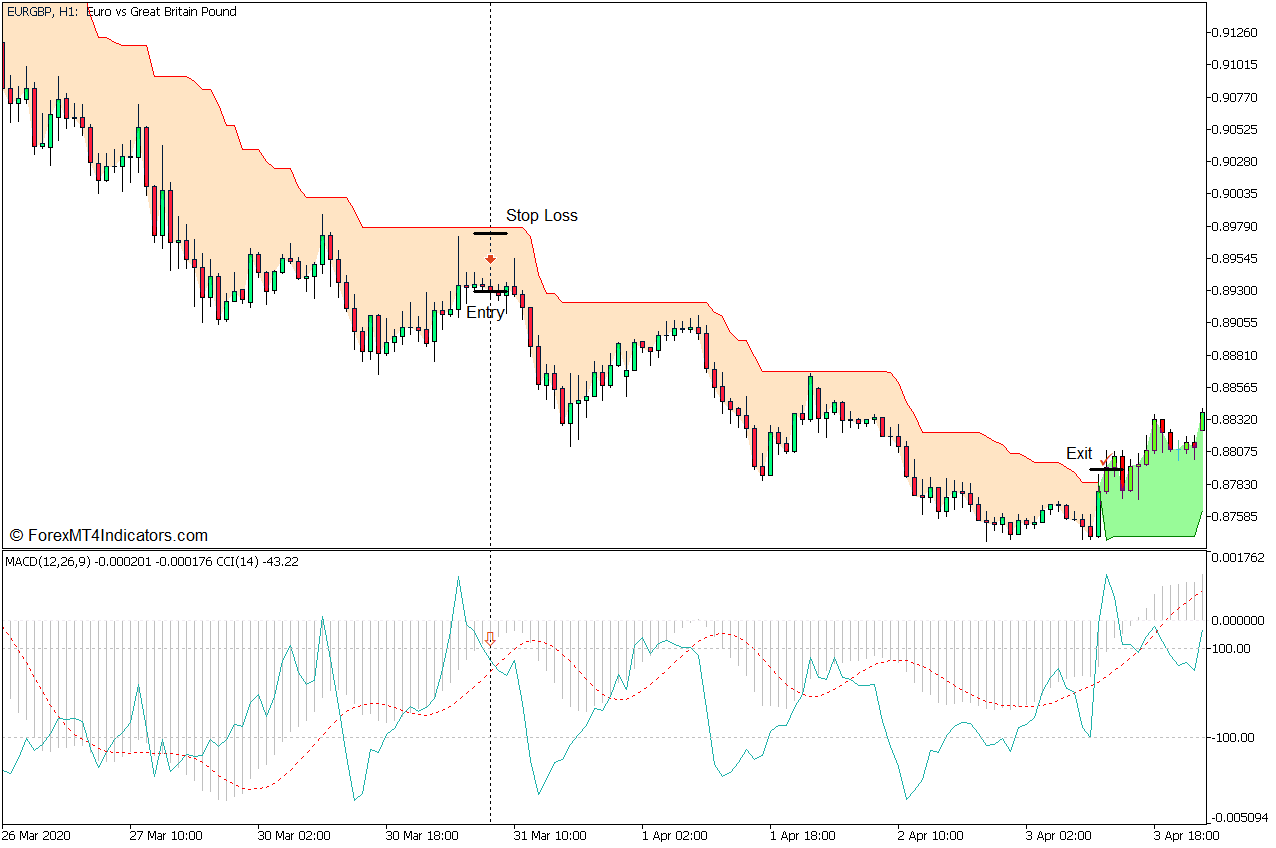
Sell Trade Setup
Entry
- The MACD bars should be negative.
- Price action should be below the Super Trend line while the line is red.
- Wait for the CCI line to breach above 100.
- Enter a sell order as soon as the CCI line crosses back below 100.
Stop Loss
- Set the stop loss on the resistance above the entry candle.
Exit
- Close the trade as soon as price closes above the Supertrend line.
Conclusion
This trading strategy is based on the concept of entering a trending market in the direction of the trend as the market pulls back.
The pullbacks on this setup are quite deep because it waits for the market to be slightly overbought or oversold due to the pullback, while still conforming to the direction of the trend. It also holds the trade until the end of the trend based on the Supertrend Indicator. This allows traders to maximize the possible profits on a trend continuation setup, which often results in an excellent risk-reward ratio.
Recommended MT5 Brokers
XM Broker
- Free $50 To Start Trading Instantly! (Withdraw-able Profit)
- Deposit Bonus up to $5,000
- Unlimited Loyalty Program
- Award Winning Forex Broker
- Additional Exclusive Bonuses Throughout The Year

>> Sign Up for XM Broker Account here <<
FBS Broker
- Trade 100 Bonus: Free $100 to kickstart your trading journey!
- 100% Deposit Bonus: Double your deposit up to $10,000 and trade with enhanced capital.
- Leverage up to 1:3000: Maximizing potential profits with one of the highest leverage options available.
- ‘Best Customer Service Broker Asia’ Award: Recognized excellence in customer support and service.
- Seasonal Promotions: Enjoy a variety of exclusive bonuses and promotional offers all year round.

>> Sign Up for FBS Broker Account here <<
Click here below to download: