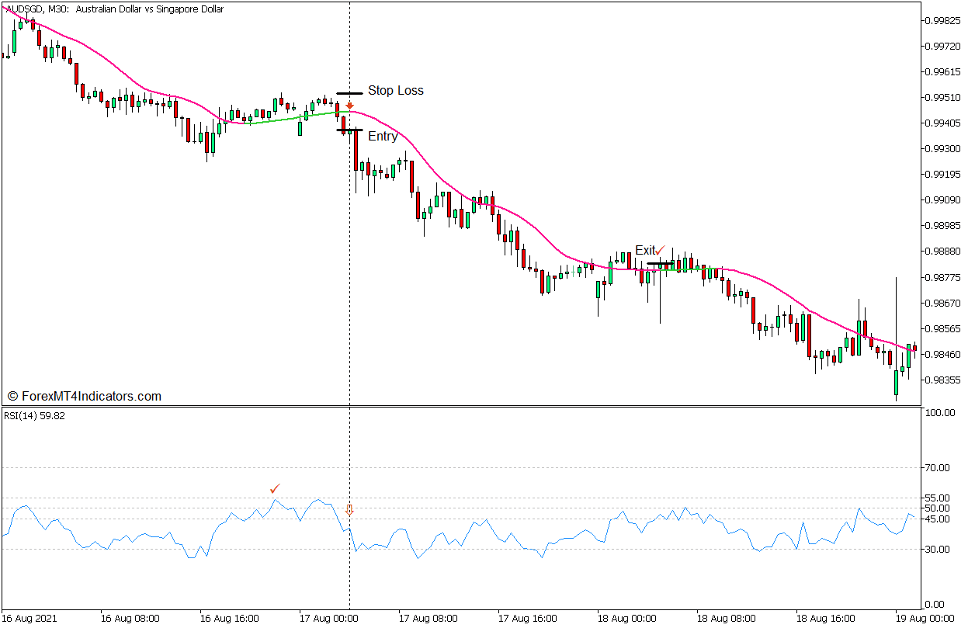
Price action and technical indicators go hand in hand. Technical traders may observe the direction of price based on price action and confirm trend direction objectively using technical indicators. Doing so would allow traders to respond to price movements more effectively while being objective with their trade decisions. The strategy discussed below is an example of how traders can incorporate price action and technical indicators within a trade setup.
ATR Adaptive T3 Indicator
The ATR Adaptive T3 indicator is a trend following technical indicator which is practically a modified moving average. This method of calculating for the moving average line is derived from the Triple Exponential Moving Average (T3) and the Average True Range (ATR).
The Triple Exponential Moving Average, developed by Tim Tillson, is also a modification of the classic Exponential Moving Average (EMA). The T3 indicator attempts to improve on the smoothing feature of the EMA line with the intention of having a more reliable trend indication.
The ATR on the other hand is a calculation of the average range of price movements within a given period. This indicator gives traders an objective assessment of the market’s volatility.
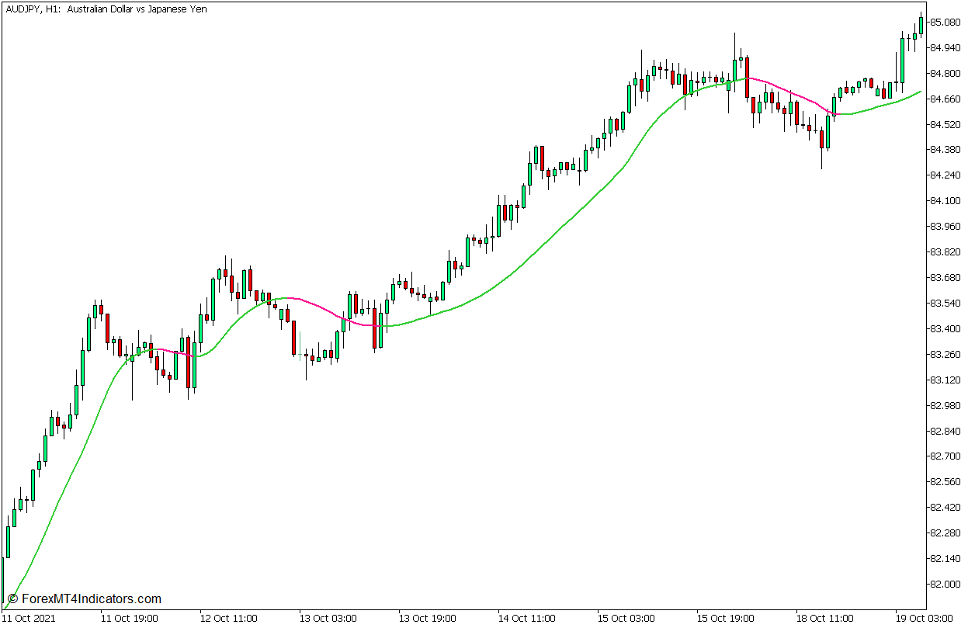
The ATR Adaptive T3 indicator is basically a T3 indicator which adds weight on each bar based on the normalized Average True Range. This creates a moving average line which retains the smoothening characteristics of the T3 line, while allowing the moving average line’s responsiveness to price movements become adaptive to the market’s volatility.
The ATR Adaptive T3 indicator also has a feature wherein the color of its line would change depending on the direction of its slope. It plots a lime green line whenever the line starts to slope up and a deep pink line whenever it starts to slope down. Traders can use this feature to identify and confirm probable trend reversals.
Relative Strength Index
The Relative Strength Index is a momentum technical indicator which was developed by J. Welles Wilder Jr. introduced in his book, “New Concepts in Technical Trading Systems”, in 1978. It presents the direction of the momentum of price as an oscillator, measuring the magnitude of recent price changes by comparing the current price with recent historical price data.
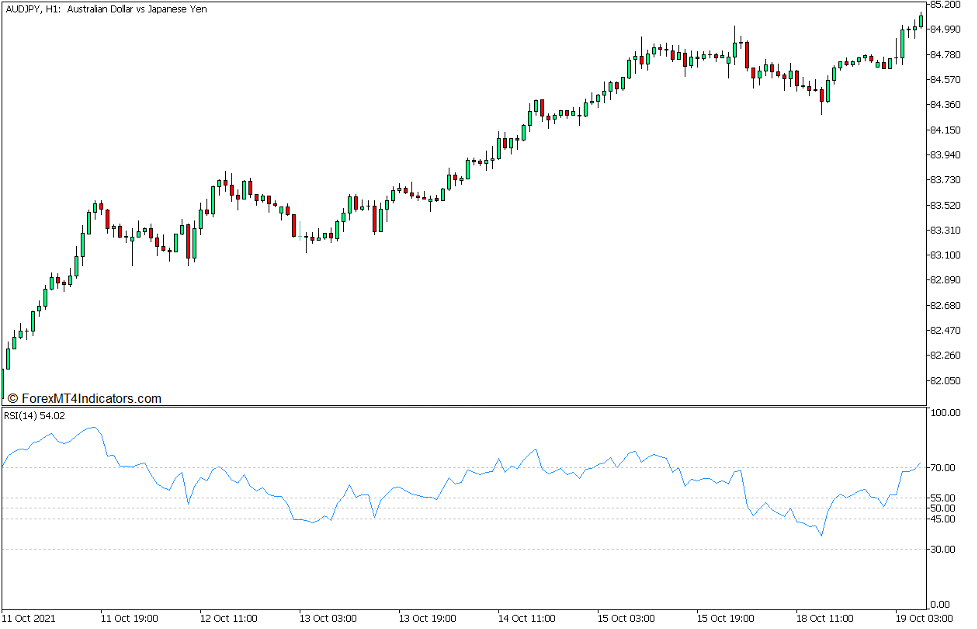
The RSI plots a line which oscillates within the range of 0 to 100. The said range also has markers at levels 30 and 70. These markers indicate the normal range of the RSI. Anything beyond this range may be considered overextended. RSI values above 70 are considered overbought, while values below 30 are considered oversold. Any reversal signal indication that may develop while the RSI is beyond the said range are considered high probability mean reversal signals.
Aside from being an oversold and overbought indicator, the RSI can also be modified so that it can be used to identify trend direction. Traders may add markers at levels 45, 50, and 55 to do this. The marker at 55 can be used to indicate the general trend direction or bias. The levels 45 and 55 on the other hand may be used as support and resistance levels for the RSI. In an uptrend market, the RSI should generally stay above 50 while the RSI line finds support at 45. Inversely, in a downtrend market, the RSI should stay below 50 and find resistance at 55. Levels 45 and 55 may also be used to confirm trend continuation as the RSI line would typically break above 55 as price action expands upward or drop below 45 as price action expands downward.
Trading Strategy Concept
ATR Adaptive T3 Trend Continuation Forex Trading Strategy is a trend continuation strategy which uses the confluence of the RSI indicator and the ATR Adaptive T3 indicator in order to find high probability trade opportunities.
First, we would have to observe price action in order to identify the general trend direction based on price swings. We should then confirm the trend based on the general location of the RSI line in relation to the 50 marker. At the same time, the ATR Adaptive T3 indicator should also indicate a momentum direction which is in confluence with the trend.
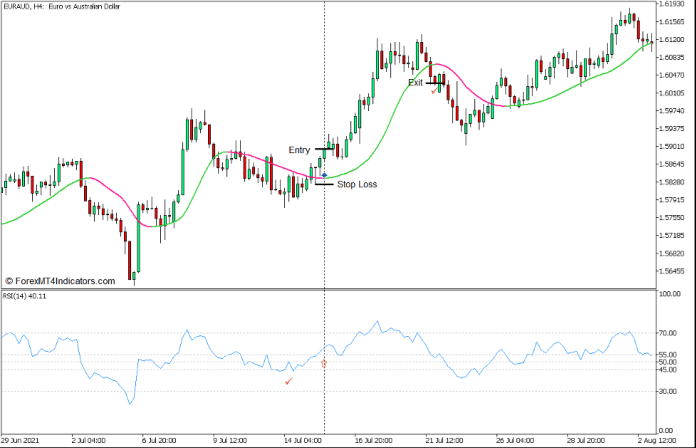
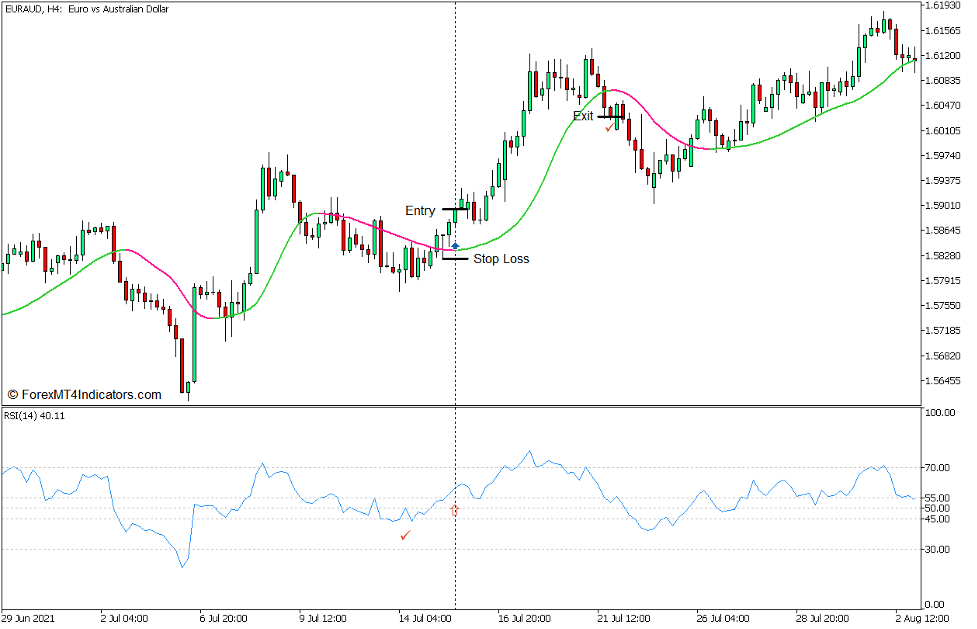
As soon as these conditions are confirmed, we could then observe for pullbacks. The pullbacks would cause the ATR Adaptive T3 line to temporarily change color against the trend and cause the RSI line to temporarily cross the 50 marker. However, the RSI line should either find support at 45 or resistance at 55, which would confirm the trend. Trade signals are then confirmed at the confluence of the ATR Adaptive T3 color change and the reversion of the RSI line back to the direction of the trend.
Buy Trade Setup
Entry
- Price swings should indicate an uptrend market.
- The RSI line should generally be above 50.
- The ATR Adaptive T3 line should be lime green.
- Price should pull back causing the RSI line to temporarily drop below 50 and the ATR Adaptive T3 line to temporarily change to deep pink.
- The RSI line should find support at 45.
- Open a buy order on the confluence of the RSI line breaking back above 55 and the ATR Adaptive T3 line reverting back to lime green.
Stop Loss
- Set the stop loss on the fractal below the entry candle.
Exit
- Close the trade as soon as the ATR Adaptive T3 line changes to deep pink.
Sell Trade Setup
Entry
- Price swings should indicate a downtrend market.
- The RSI line should generally be below 50.
- The ATR Adaptive T3 line should be deep pink.
- Price should pull back causing the RSI line to temporarily breach above 50 and the ATR Adaptive T3 line to temporarily change to lime green.
- The RSI line should find resistance at 55.
- Open a sell order on the confluence of the RSI line dropping back below 45 and the ATR Adaptive T3 line reverting back to deep pink.
Stop Loss
- Set the stop loss on the fractal above the entry candle.
Exit
- Close the trade as soon as the ATR Adaptive T3 line changes to lime green.
Conclusion
This trading strategy can be an effective trend following strategy as it has the element of being objective while at the same time having a direct input of what the market is doing based on price action. However, traders using this strategy should first learn how to read trend direction based on price action as this is the key element to this strategy.
Recommended MT5 Brokers
XM Broker
- Free $50 To Start Trading Instantly! (Withdraw-able Profit)
- Deposit Bonus up to $5,000
- Unlimited Loyalty Program
- Award Winning Forex Broker
- Additional Exclusive Bonuses Throughout The Year
>> Sign Up for XM Broker Account here <<
FBS Broker
- Trade 100 Bonus: Free $100 to kickstart your trading journey!
- 100% Deposit Bonus: Double your deposit up to $10,000 and trade with enhanced capital.
- Leverage up to 1:3000: Maximizing potential profits with one of the highest leverage options available.
- ‘Best Customer Service Broker Asia’ Award: Recognized excellence in customer support and service.
- Seasonal Promotions: Enjoy a variety of exclusive bonuses and promotional offers all year round.
>> Sign Up for FBS Broker Account here <<
Click here below to download:


