


One way of assessing a trending market is by identifying the swing patterns of price, whether the market is consistently making new swing highs or swing lows. This is a very reliable method of identifying trend direction which many price action traders use. However, most new traders lack the skill to objectively identify trends using this method. In this strategy, we will be looking at how we can trade with the trend in confluence with price action making higher highs or lower lows using a couple of technical indicators.
Aroon Oscillator
The Aroon Oscillator is a technical indicator developed by Tushar S. Chande, CEO of “Tuscarora Capital Management” and author of the books “The New Technical Trader: Boost Your Profit by Plugging into the Latest Indicators” and “Beyond Technical Analysis: How to Develop and Implement a Winning Trading System”.
The Aroon Oscillator is a trend-following indicator that presents the direction of momentum based on historical price movements. However, unlike most momentum indicators, the Aroon Oscillator disregards the direct value of price particularly the magnitude of price swings based on value. Instead, it detects trend and momentum direction based on price swings over time.
As mentioned above, the Aroon Oscillator measures the time distance between price swings, both the swing highs and swing lows. To do this, the indicator calculates two values which are represented by the Aroon Up and Aroon Down lines.
The Aroon Up line is calculated by subtracting the number of periods from the last swing high from a preset number of periods. It then divides the difference by the preset number of periods and multiplies the result by 100.
Aroon Up = [(n Periods – periods since n Period high) / n Periods] x 100
Inversely, the Aroon Down line is calculated by subtracting the period count since the last swing low from the preset number of periods, the result of which is divided by the same number of periods and multiplied by 100.
Aroon Down = [(n Periods – periods since n Period low) / n Periods] x 100
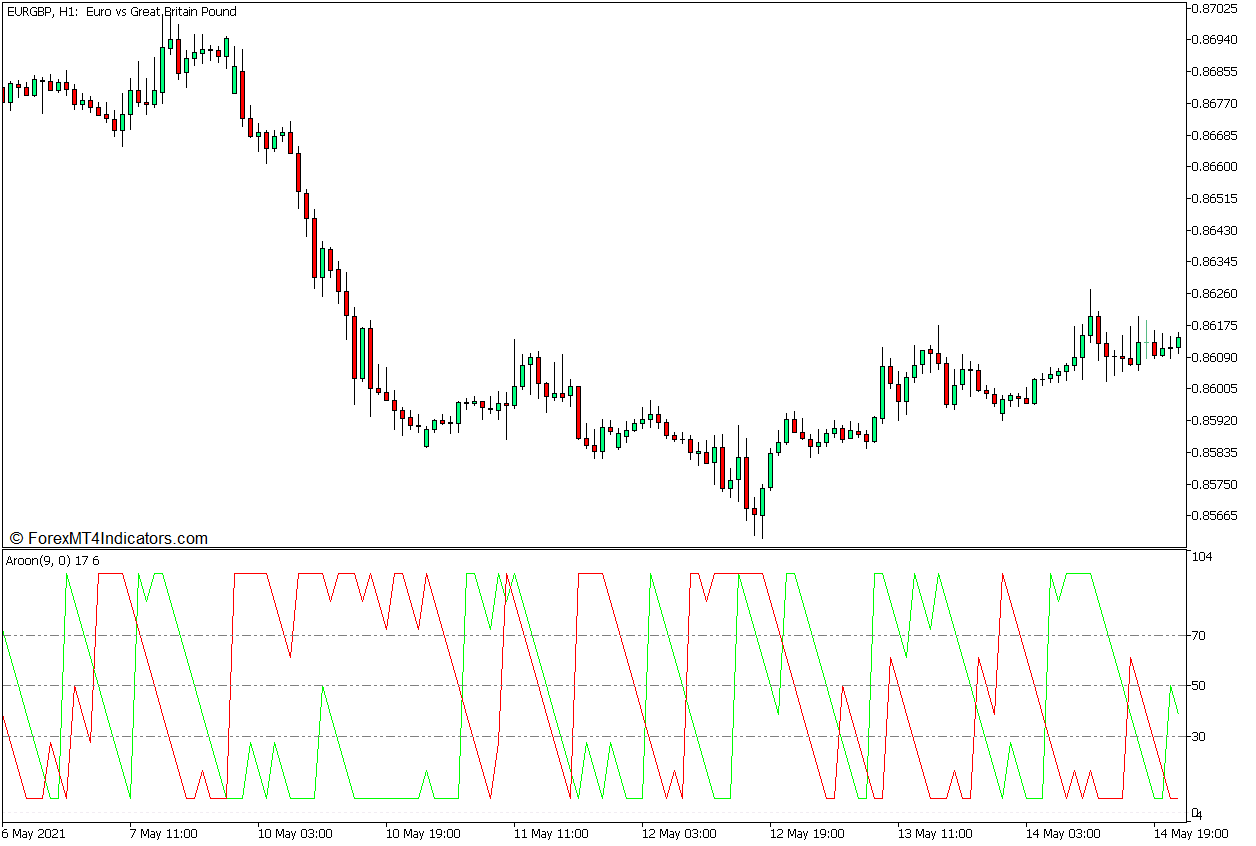
The resulting lines oscillate within a range of 0 to 100. The Aroon Up line spikes up whenever there is a new high and gradually drops on each bar where there is no new high. Inversely, the Aroon Down line spikes whenever there is a new low and gradually drops until a new low is reached.
Crossovers between the Aroon Up and Aroon Down lines indicate that a new swing high or swing low is formed. Momentum direction may also be identified based on whether the Aroon Up or Aroon Down line is on top.
This indicator plots the Aroon Up line lime and the Aroon Down line red.
50 Exponential Moving Average
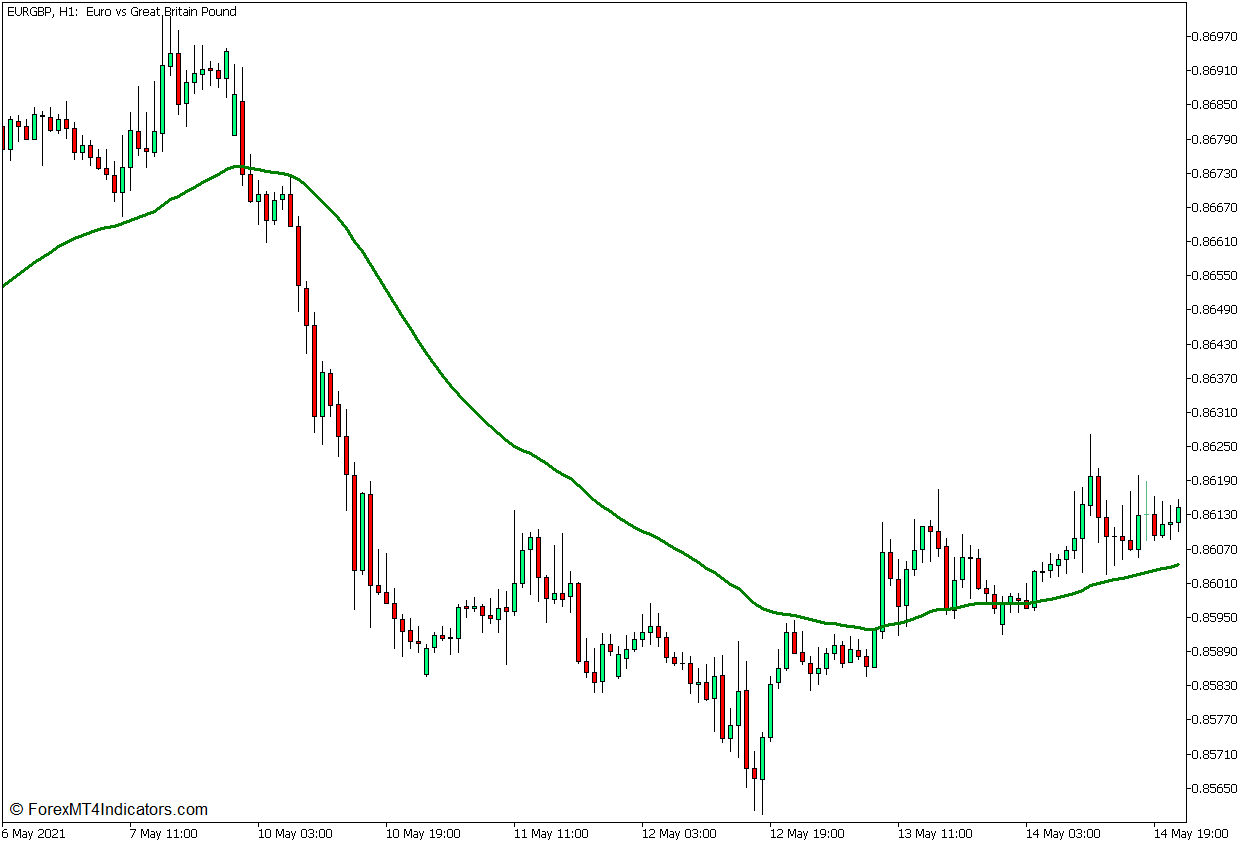
Moving Averages are one of the most basic indicators used to identify trend direction. Traders do this by observing the general location of price action about the moving average line as well as the slope of the line. The market is considered to have an uptrend bias whenever price action is above the moving average line while the line slopes up. On the other hand, the market is considered to be in a downtrend bias whenever price action is below the moving average line while the line slopes down.
Moving Average lines usually have two disadvantages. One is that it could often be susceptible to false signals whenever the market is choppy and has a lot of market noise. Another is that it could also be too lagging causing traders to react to trend reversals a little too late.
The Exponential Moving Average (EMA) is usually used to address the disadvantages mentioned above. This method of calculating for a moving average line places more weight on recent price movements causing it to be more responsive to price action. Incidentally, it also creates a smoother moving line which makes it less susceptible to false signals.
The 50-period moving average line is widely accepted as an intermediate-term trend direction indicator. As such, the 50 EMA line would be a good setting to use on a moving average line.
Trading Strategy Concept
This trading strategy is a trend continuation strategy that uses momentum breakouts as a means of entering the market with the assumption that the short-term horizon momentum breakout would result in a market run.
To execute this strategy we will be using the 50 EMA line and the Aroon Oscillator.
The 50 EMA line is applied on the chart for traders to objectively assess the direction of the intermediate term direction. This is identified based on the general location of price action about the line, as well as the slope of the line.
As soon as the trend direction bias is identified, we may then isolate our trades in the direction of the trend.
The Aroon Oscillator is then used to identify the momentum breakout entry signals. Momentum breakout signals are confirmed based on the crossing over of the Aroon Up and Aroon Down lines. Crossovers that are in confluence with the trend are considered valid signals.
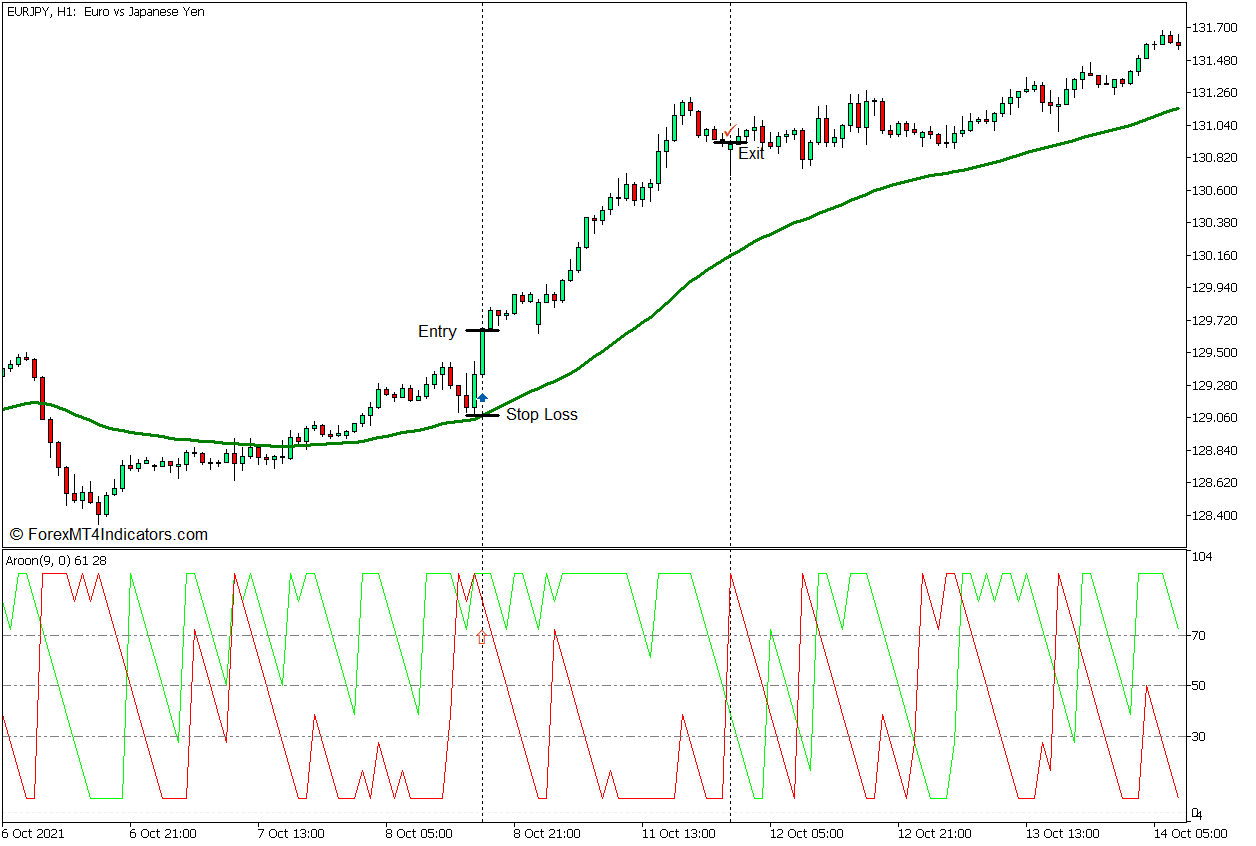
Buy Trade Setup
Entry
- Price action should generally be above the 50 EMA line while the 50 EMA line slopes up.
- Price action should pull back towards the 50 EMA line causing the Aroon Up line to temporarily dip below the Aroon Down line.
- Open a buy order as soon as the Aroon Up line crosses above the Aroon Down line.
Stop Loss
- Set the stop loss on the fractal below the entry candle.
Exit
- Close the trade as soon as the Aroon Up line crosses below the Aroon Down line.
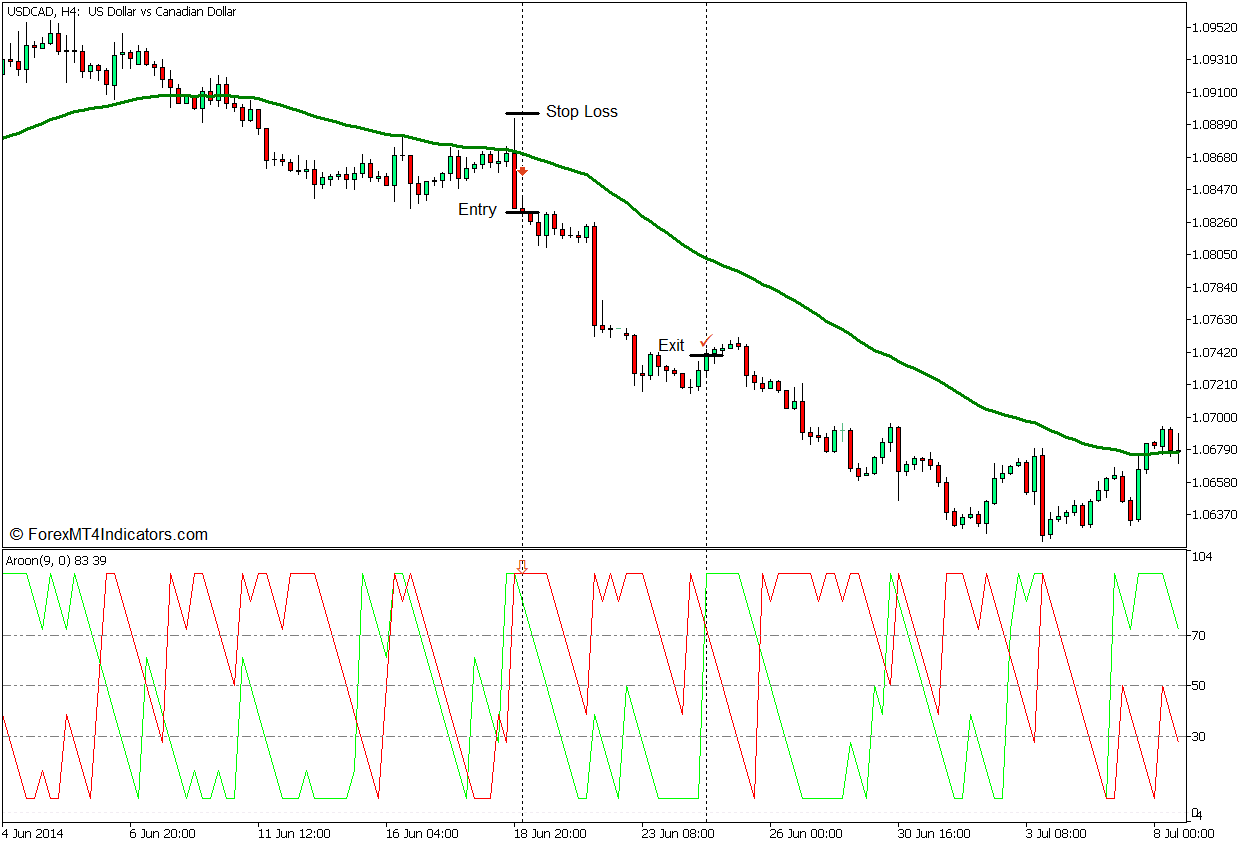
Sell Trade Setup
Entry
- Price action should generally be below the 50 EMA line while the 50 EMA line slopes down.
- Price action should pull back towards the 50 EMA line causing the Aroon Down line to temporarily dip below the Aroon Up line.
- Open a sell order as soon as the Aroon Down line crosses above the Aroon Up line.
Stop Loss
- Set the stop loss on the fractal above the entry candle.
Exit
- Close the trade as soon as the Aroon Down line crosses below the Aroon Up line.
Conclusion
The concept behind this strategy is very logical. However, because trades are opened at the break of a new swing high or low, trades are often entered at a less efficient level. Often these trades would imply that we are chasing momentum but could also mean that the breakout might result in a run.
Recommended MT5 Brokers
XM Broker
- Free $50 To Start Trading Instantly! (Withdraw-able Profit)
- Deposit Bonus up to $5,000
- Unlimited Loyalty Program
- Award Winning Forex Broker
- Additional Exclusive Bonuses Throughout The Year

>> Sign Up for XM Broker Account here <<
FBS Broker
- Trade 100 Bonus: Free $100 to kickstart your trading journey!
- 100% Deposit Bonus: Double your deposit up to $10,000 and trade with enhanced capital.
- Leverage up to 1:3000: Maximizing potential profits with one of the highest leverage options available.
- ‘Best Customer Service Broker Asia’ Award: Recognized excellence in customer support and service.
- Seasonal Promotions: Enjoy a variety of exclusive bonuses and promotional offers all year round.

>> Sign Up for FBS Broker Account here <<
Click here below to download: