


Supply and Demand type of strategies in trading begins with identifying the Supply and Demand Zones. Supply Zones refer to the area on the price chart where many sellers are willing to sell at that price range. Demand Zones on the other hand refers to the area on the price chart where many buyers are willing to buy.
This strategy is a method that makes it easier to identify potential Supply and Demand Zones as well as the signals that indicate that price action is potentially reversing from these Supply and Demand Zones.
Zigzag Indicator as a Tool for Identifying Supply and Demand Zones
Supply and Demand Zones are typically identified as areas on the price chart where prices quickly reverse. Classic Supply and Demand traders use certain patterns to define these areas. These patterns include rallies, drops, and bases. These patterns have different combinations. Patterns such as rally base and drop or drop base and rally are somewhat similar to that of a swing high or swing low. Continuation patterns on the other hand are either rally base and rally or drop base and drop.
Although this is the textbook way of identifying Supply and Demand Zones, there is an easier way to identify some of these zones using the concept of swing highs and swing lows. Swing highs and swing lows with patterns that show the price has quickly moved up or down from the area are usually also Supply or Demand Zones. As such, we can just use the wicks of the candles forming the swing high or swing low as the basis for the Supply and Demand Zones.
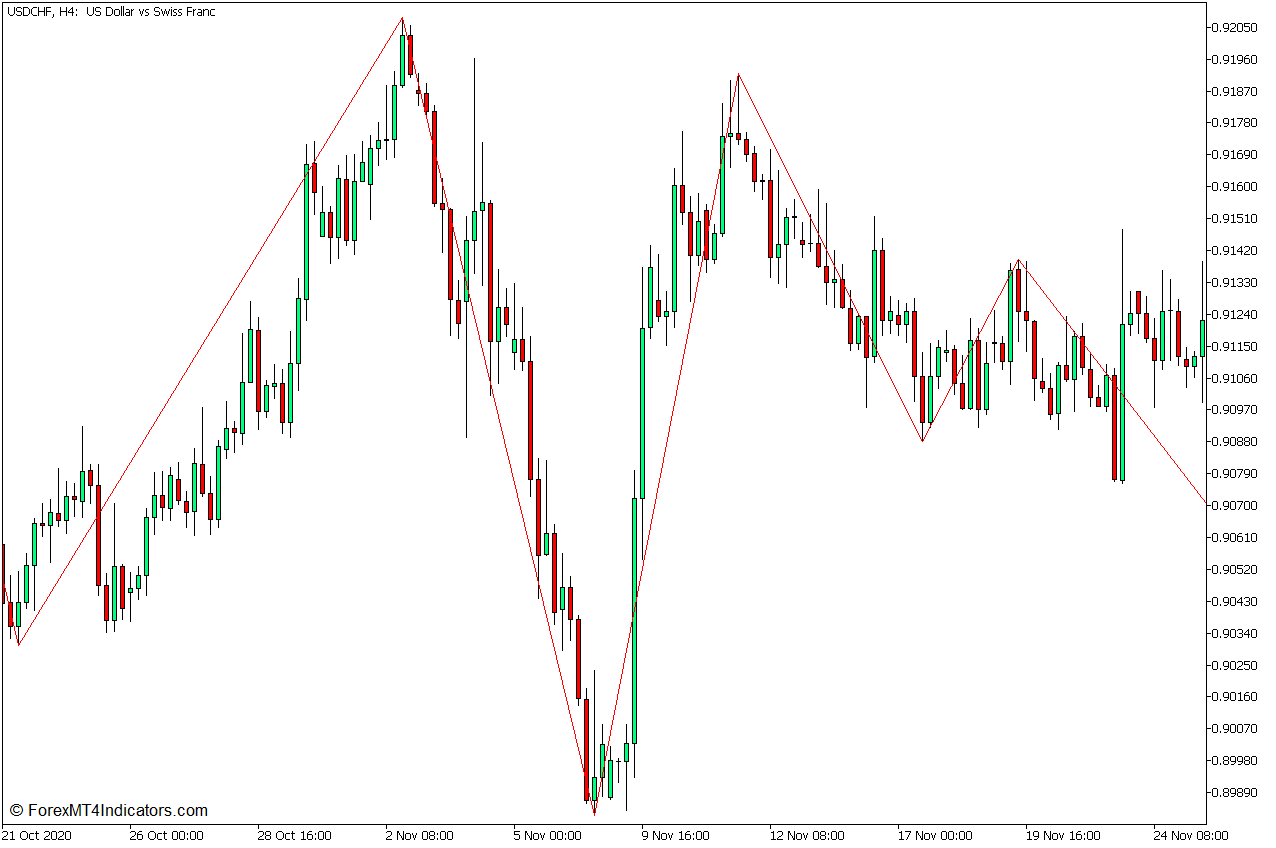
The Zigzag indicator can be very useful for this purpose. The Zigzag indicator is a technical indicator that identifies points on the price chart where there are steep reversals that are greater than the predetermined variable with the indicator’s algorithm. This effectively identifies the swing highs and swing lows of price action. The Zigzag indicator then plots a line connecting these swing highs and swing lows creating a Zigzag-like pattern.
Because the Zigzag indicator identifies swing highs and swing lows and many of such swing highs and swing lows are also Supply and Demand Zones, likely, the area around the swing high or swing low identified by the indicator is a Supply or Demand Zone.
To identify probable Supply and Demand Zones, we should look at how the price candles formed on the swing high or swing low. If it signifies that the price quickly reversed from that level, then it could be a probable supply or demand zone. We then mark the area on the wicks of the candles on the swing high or swing low and treat it as our Supply or Demand Zone. Then, we wait for price action to revisit the area and see how the price reacts to our Supply and Demand Zones. If the price shows signs that it is going to reverse, then we could assume that it is a Supply or Demand Zone and that the price may reverse.
Hammer and Star Pattern using Patterns on Chart Indicator
Reversal candlestick patterns can be telltale signs that the price is about to reverse. What is good about candlestick patterns is that they provide the least lag among most reversal signals.
The Hammer pattern is a high-probability bullish reversal pattern formed by a candle with a small body near the top of the candle and a long wick at the bottom. This signifies that the market is rejecting prices from the bottom.
The Shooting Star pattern is the opposite of the Hammer pattern. It is a high probability bearish reversal pattern with a small body at the bottom and a long wick at the top. This signifies that the market is reversing prices from the top.
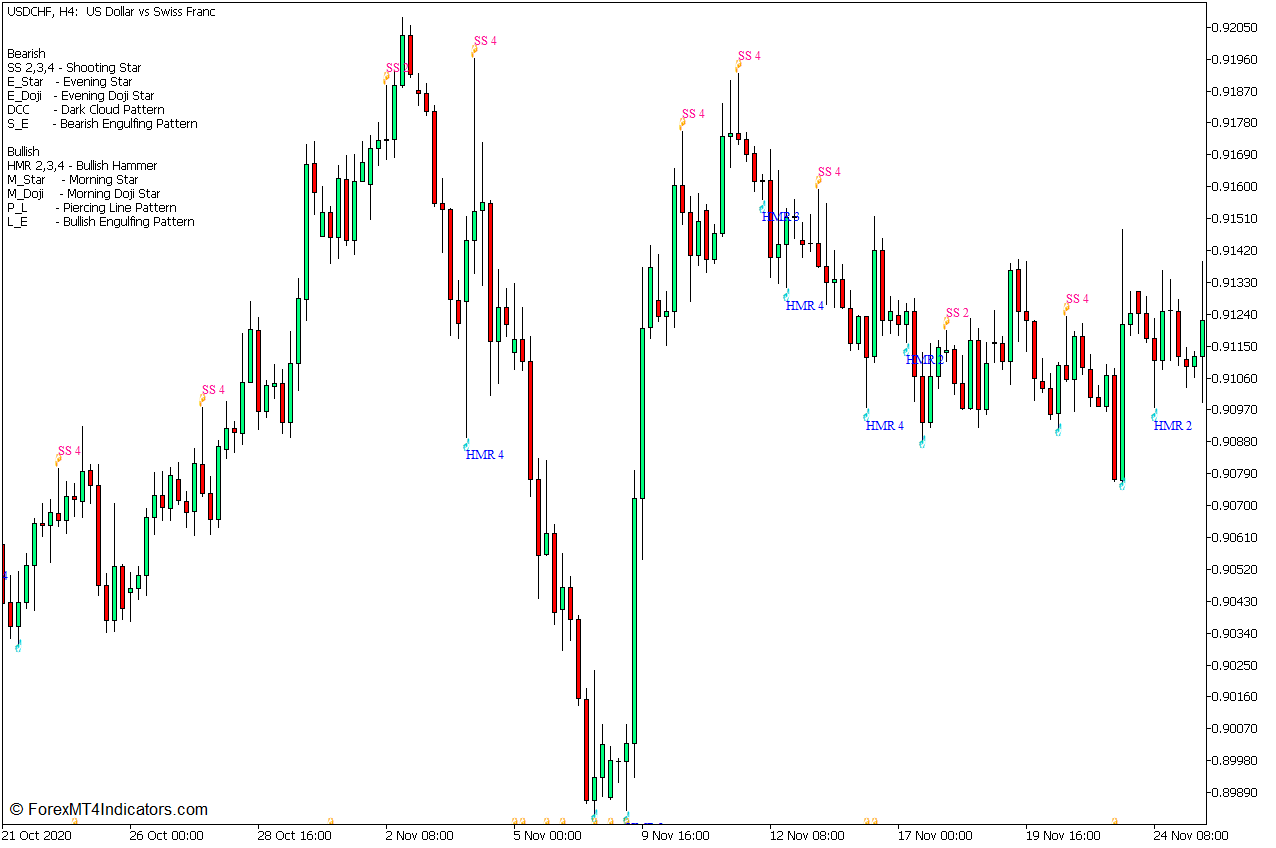
The Patterns on Chart Indicator is a custom technical indicator that automatically identifies various candlestick patterns. It automatically labels candlesticks whenever it identifies a reversal pattern. The shorthand labels and their corresponding pattern names are also displayed in the upper left corner of the chart. Users may also modify the types of candlestick patterns that the indicator would identify within the indicator’s settings.
Trading Strategy Concept
We will use the Zigzag Indicator to simplify the process of identifying supply and demand zones. We will mark the area where the Zigzag Indicator has identified a swing high or swing low based on the wicks of the swing high or swing low candle. We will then observe price action as it revisits the supply or demand zone.
The Patterns on the Chart Indicator will then be used to help us objectively identify hammer and shooting star formations. We should also visually confirm if the pattern identified by the indicator is indeed a shooting star or hammer pattern.
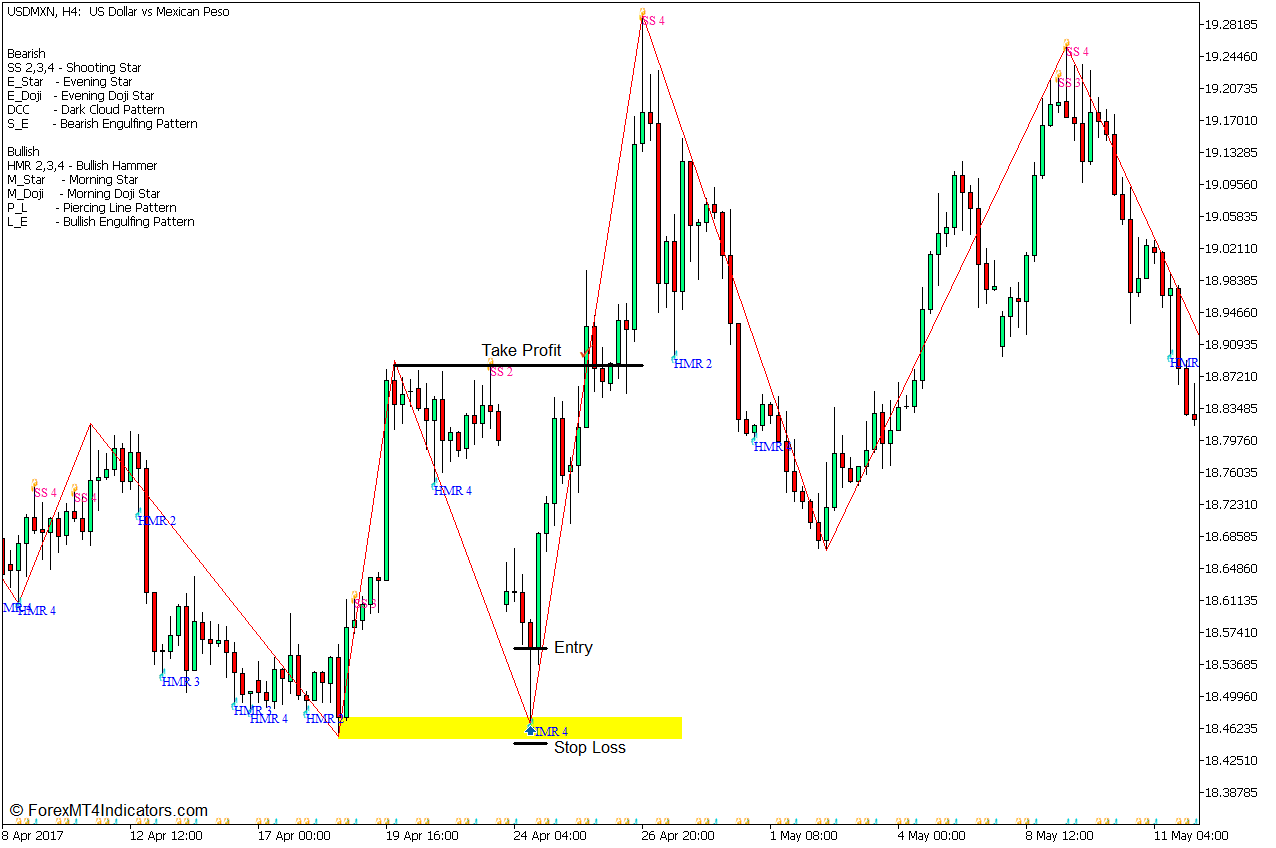
Buy Trade Setup
Entry
- Identify a swing low where price action shows that the price quickly reversed from that level using the Zigzag Indicator.
- Mark the area on the lower wick of the candles forming the swing low as a Demand Zone.
- Wait for the price to revisit the area.
- Enter a buy order as soon as the Patterns on the Chart Indicator identify a Hammer pattern rejecting the Demand Zone.
Stop Loss
- Set the stop loss below the Demand Zone.
Exit
- Set the take profit target on the next swing high.
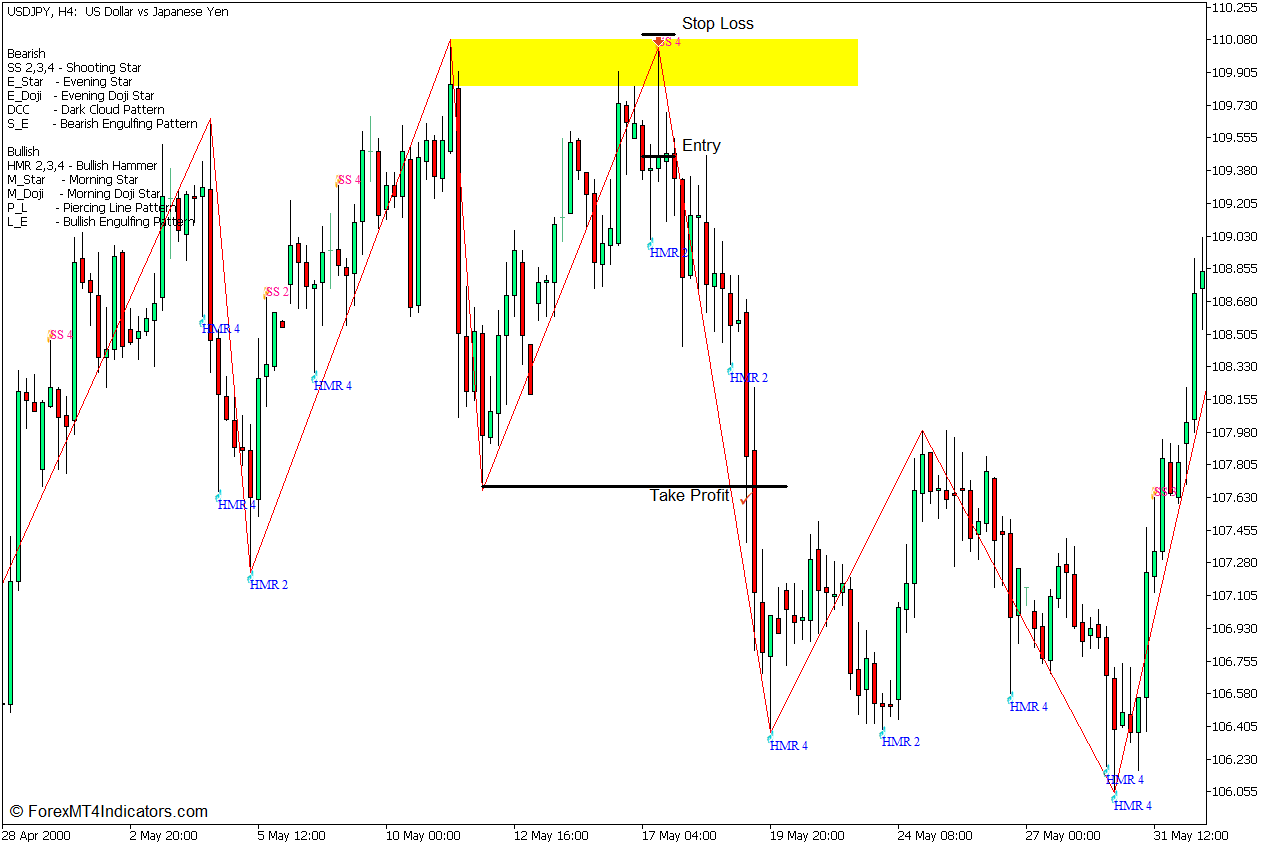
Sell Trade Setup
Entry
- Identify a swing high where price action shows that the price quickly reversed from that level using the Zigzag Indicator.
- Mark the area on the upper wick of the candles forming the swing high as a Supply Zone.
- Wait for the price to revisit the area.
- Enter a sell order as soon as the Patterns on the Chart Indicator identify a Shooting Star pattern rejecting the Supply Zone.
Stop Loss
- Set the stop loss above the Supply Zone.
Exit
- Set the take profit target on the next swing low.
Conclusion
Supply and Demand trading strategies are usually high-probability types of trading strategies. Many professional traders would say that this type of trading strategy is what is used by many highly profitable professional traders. However, identifying supply and demand zones manually would take a lot of practice and skill. This would require a lot of time looking at price charts and familiarizing how price moves to form supply and demand zones. This strategy simplifies the process with the use of the Zigzag Indicator and the signals coming from the Patterns on the Chart Indicator.
Recommended MT5 Brokers
XM Broker
- Free $50 To Start Trading Instantly! (Withdraw-able Profit)
- Deposit Bonus up to $5,000
- Unlimited Loyalty Program
- Award Winning Forex Broker
- Additional Exclusive Bonuses Throughout The Year

>> Sign Up for XM Broker Account here <<
FBS Broker
- Trade 100 Bonus: Free $100 to kickstart your trading journey!
- 100% Deposit Bonus: Double your deposit up to $10,000 and trade with enhanced capital.
- Leverage up to 1:3000: Maximizing potential profits with one of the highest leverage options available.
- ‘Best Customer Service Broker Asia’ Award: Recognized excellence in customer support and service.
- Seasonal Promotions: Enjoy a variety of exclusive bonuses and promotional offers all year round.

>> Sign Up for FBS Broker Account here <<
Click here below to download: