The foreign exchange market, or Forex for short, is a thrilling yet often unpredictable beast. Prices can surge and dip with lightning speed, leaving even seasoned traders scrambling to keep their footing. This inherent volatility, while exciting, can also pose a significant challenge. But fear not, intrepid trader! The world of technical analysis offers a treasure trove of tools to help you navigate these market fluctuations. Today, we’ll be delving into a specific gem – the Volatility Ratio 2 Indicator for MT5.
Understanding Volatility and Technical Analysis
Before we dive into the specifics of the Volatility Ratio 2 Indicator, let’s establish a solid foundation. Imagine volatility as the market’s heartbeat. A steady, rhythmic beat often indicates a stable market, while a rapid, erratic pulse suggests heightened volatility. Understanding this “heartbeat” is crucial for making informed trading decisions.
Here’s where technical analysis comes in. This approach utilizes various indicators and charts to identify patterns and trends in historical price data. By analyzing this data, traders can make educated guesses about future price movements and potentially capitalize on market fluctuations, including periods of high or low volatility.
The Core Concept of the Volatility Ratio 2 Indicator
The Volatility Ratio 2 Indicator steps into the spotlight as a valuable tool for gauging market volatility within the MT5 platform, a popular choice for many Forex traders. But how exactly does it work? Buckle up, because we’re about to peek under the hood.
At its core, the Volatility Ratio 2 Indicator relies on a concept called standard deviation. Imagine you have a set of historical price data points. The standard deviation tells you how much, on average, those price points deviate from the average price (the mean). So, a high standard deviation indicates significant price fluctuations – a sign of high volatility. Conversely, a low standard deviation suggests the prices are tightly clustered around the mean, implying lower volatility.
The Volatility Ratio 2 Indicator takes this concept a step further by comparing the current standard deviation to a standard deviation calculated over a specific period in the past. This comparison helps traders identify whether the market is currently more or less volatile compared to its recent historical average.
Interpreting Values and Market States
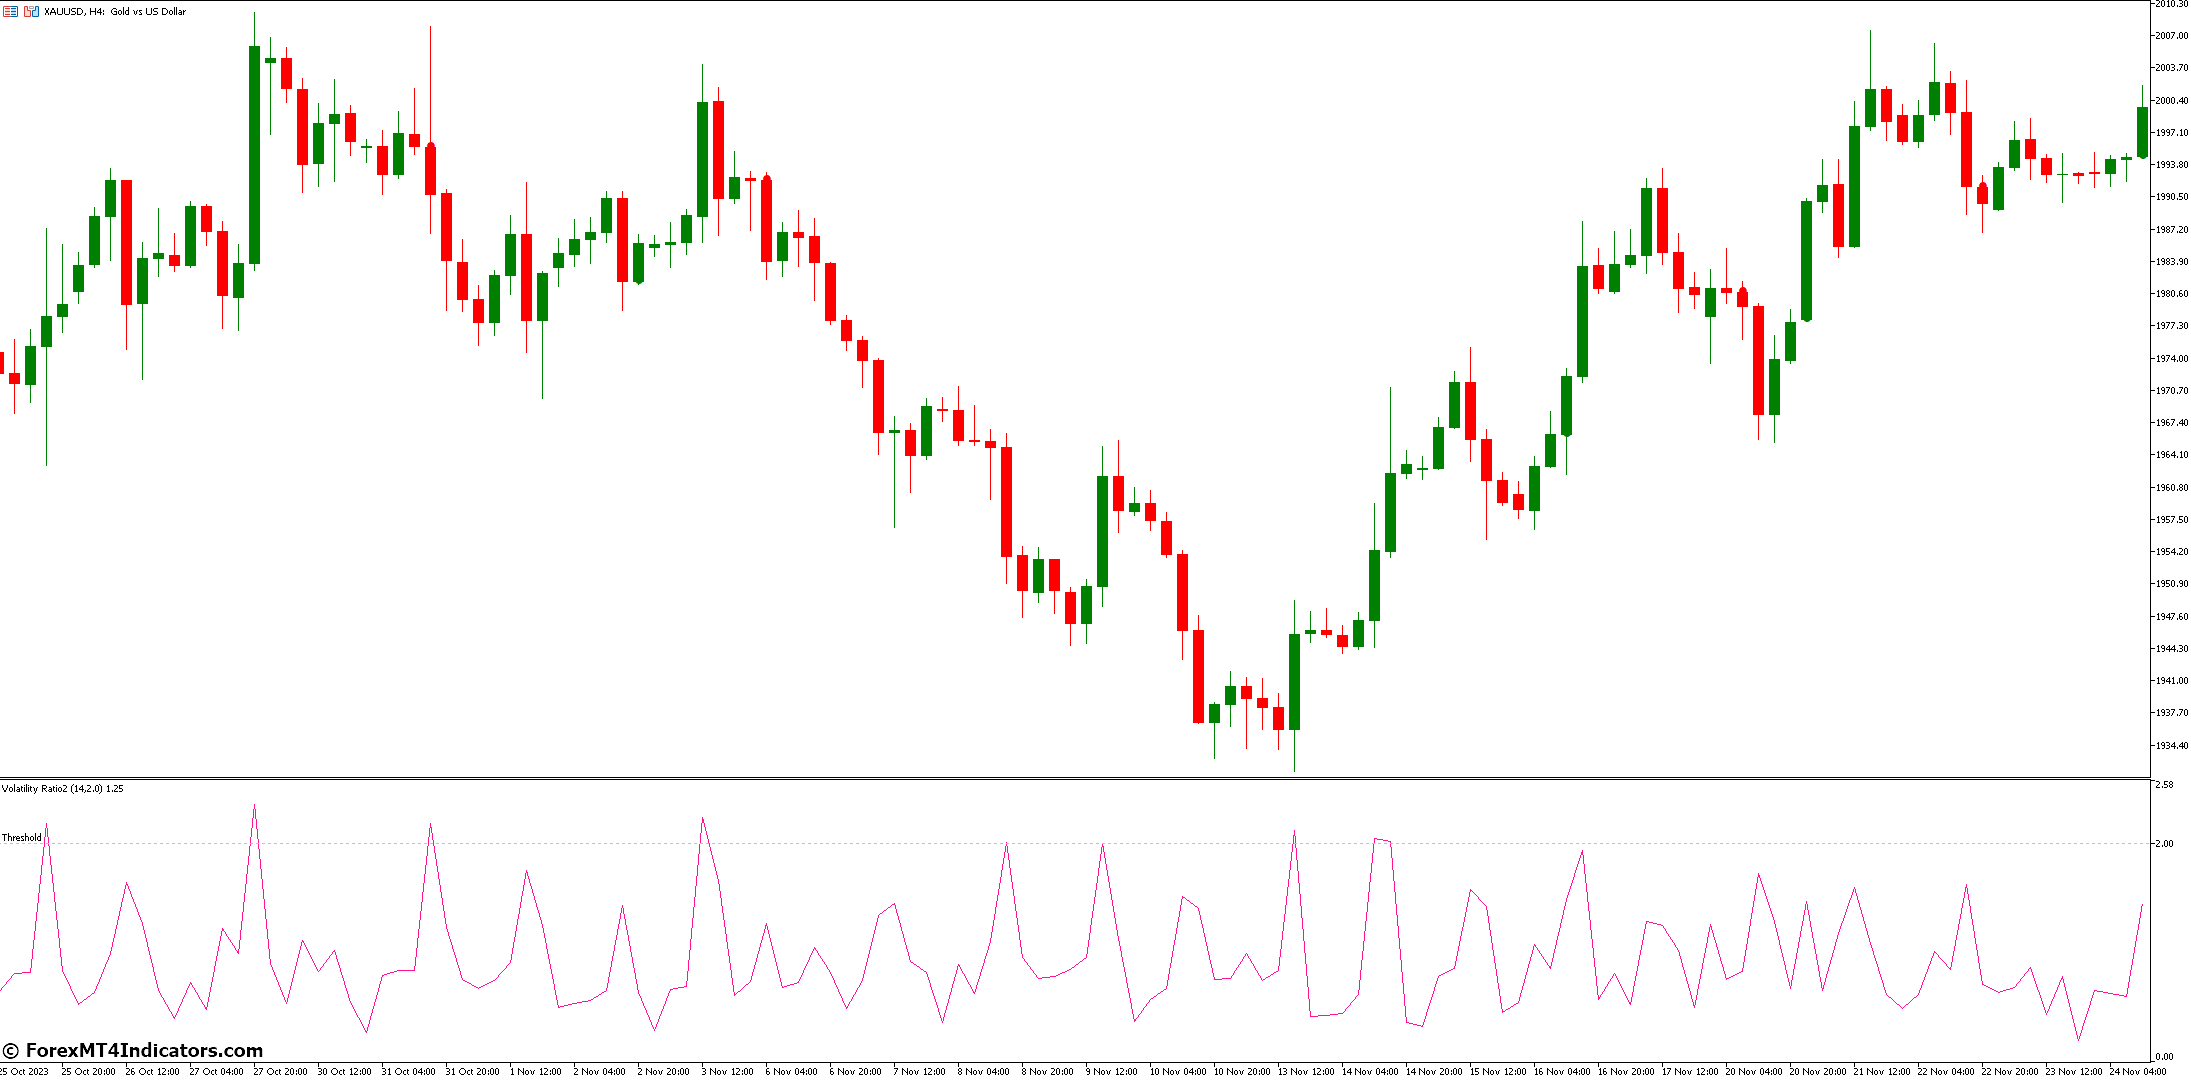
Now that we understand the inner workings of the Volatility Ratio 2 Indicator, let’s explore how to interpret its values. The indicator typically displays a line that fluctuates above or below a central level (often set at 1). Here’s a breakdown of what these movements might suggest:
- Values Above 1: When the line climbs above 1, it generally indicates that the current standard deviation is higher than the historical average. This suggests increased volatility in the market. This could be a potential signal for trend reversals or heightened price swings.
- Values Below 1: Conversely, if the line dips below 1, it implies that the current standard deviation is lower than the historical average. This signifies decreased volatility in the market, which might suggest a period of price consolidation or potentially a continuation of the current trend.
Customizing the Volatility Ratio 2 Indicator
The beauty of the Volatility Ratio 2 Indicator lies in its adaptability. Here’s how you can customize it to suit your trading style:
Adjusting The Calculation Period: The indicator usually allows you to adjust the historical period used to calculate the standard deviation. A shorter period will make the indicator more sensitive to recent market fluctuations, while a longer period will provide a broader perspective on historical volatility. Experiment with different timeframes to find what works best for your trading strategy.
Exploring Additional Parameters (If Applicable): Some variations of the Volatility Ratio 2 Indicator might offer additional parameters for customization. These could include the type of moving average used for the historical standard deviation calculation or the smoothing level applied to the indicator’s line. Explore these options if available to further refine the indicator’s behavior.
Leveraging the Volatility Ratio 2 Indicator
Now that you’re equipped with an understanding of the Volatility Ratio 2 Indicator, let’s explore how it can be integrated into your trading strategies:
Identifying Potential Trend Reversals: When the indicator value shoots up above 1, signifying a sudden increase in volatility, it might be a sign that a prevailing trend is nearing exhaustion and a potential reversal could be on the horizon. However, this is just one piece of the puzzle. Always confirm such signals with other technical indicators and fundamental analysis before making a trade.
Gauging Market Volatility For Entry And Exit Points: The Volatility Ratio 2 Indicator can also be a valuable tool for pinpointing potential entry and exit points for your trades. During periods of low volatility (indicator values below 1), the market might be consolidating or trending sideways. This could be a good time to wait for a clearer directional signal before entering a trade. Conversely, when the indicator suggests increased volatility (values above 1), it might indicate an opportune moment to enter a trade, potentially capitalizing on price swings. However, remember that high volatility can also lead to false signals and increased risk. Always prioritize prudent risk management strategies.
Combining The Indicator With Other Technical Tools For Confirmation: The Volatility Ratio 2 Indicator is a powerful tool, but it shouldn’t be used in isolation. For a more robust trading strategy, consider combining it with other technical indicators that complement its strengths. For instance, you might use trend-following indicators like moving averages or Relative Strength Index (RSI) to confirm potential trend reversals signaled by the Volatility Ratio 2 Indicator.
Advantages
- Simplicity: The Volatility Ratio 2 Indicator is a relatively straightforward tool to understand and implement. Its core concept of comparing current standard deviation to a historical average makes it easy for beginners to grasp.
- Adaptability: As discussed earlier, the ability to customize the calculation period and potentially other parameters allows traders to tailor the indicator to their specific trading style and market conditions.
- Trend Reversal Insights: By highlighting periods of increased volatility, the indicator can offer valuable insights into potential trend reversals, helping traders anticipate potential shifts in market direction.
Limitations
- Potential for False Signals: No indicator is perfect, and the Volatility Ratio 2 Indicator is no exception. Periods of high volatility can sometimes be short-lived and not necessarily lead to sustained trend reversals. This can generate false signals, leading to losing trades if not carefully interpreted.
- Dependence on Historical Data: The indicator relies on historical price data to calculate the standard deviation. While valuable, historical data doesn’t guarantee future performance. Markets can be dynamic, and unforeseen events can disrupt established patterns.
Advanced Applications of the Volatility Ratio 2 Indicator
We’ve explored the fundamental applications of the Volatility Ratio 2 Indicator, but its potential goes beyond the basics. Let’s delve into some advanced applications for seasoned traders:
Multi-Timeframe Analysis: The indicator can be used across different timeframes, providing insights into both short-term and long-term market volatility. Analyzing the indicator on a higher timeframe (e.g., daily chart) can help identify major shifts in market behavior while using it on a lower timeframe (e.g., hourly chart) can offer insights into potential short-term trading opportunities.
Combining With Other Volatility Measures: For a more comprehensive understanding of market volatility, consider using the Volatility Ratio 2 Indicator alongside other volatility measures like the Average True Range (ATR) or Bollinger Bands. Each indicator offers a unique perspective on volatility, and combining them can provide a richer picture of the market’s current state.
Backtesting Strategies: Before deploying any trading strategy live in the market, it’s crucial to test its effectiveness on historical data. Backtesting allows you to see how the Volatility Ratio 2 Indicator, when combined with your chosen strategy, would have performed in the past. This can help you refine your approach and identify potential weaknesses before risking real capital.
How to Trade with Volatility Ratio 2 Indicator
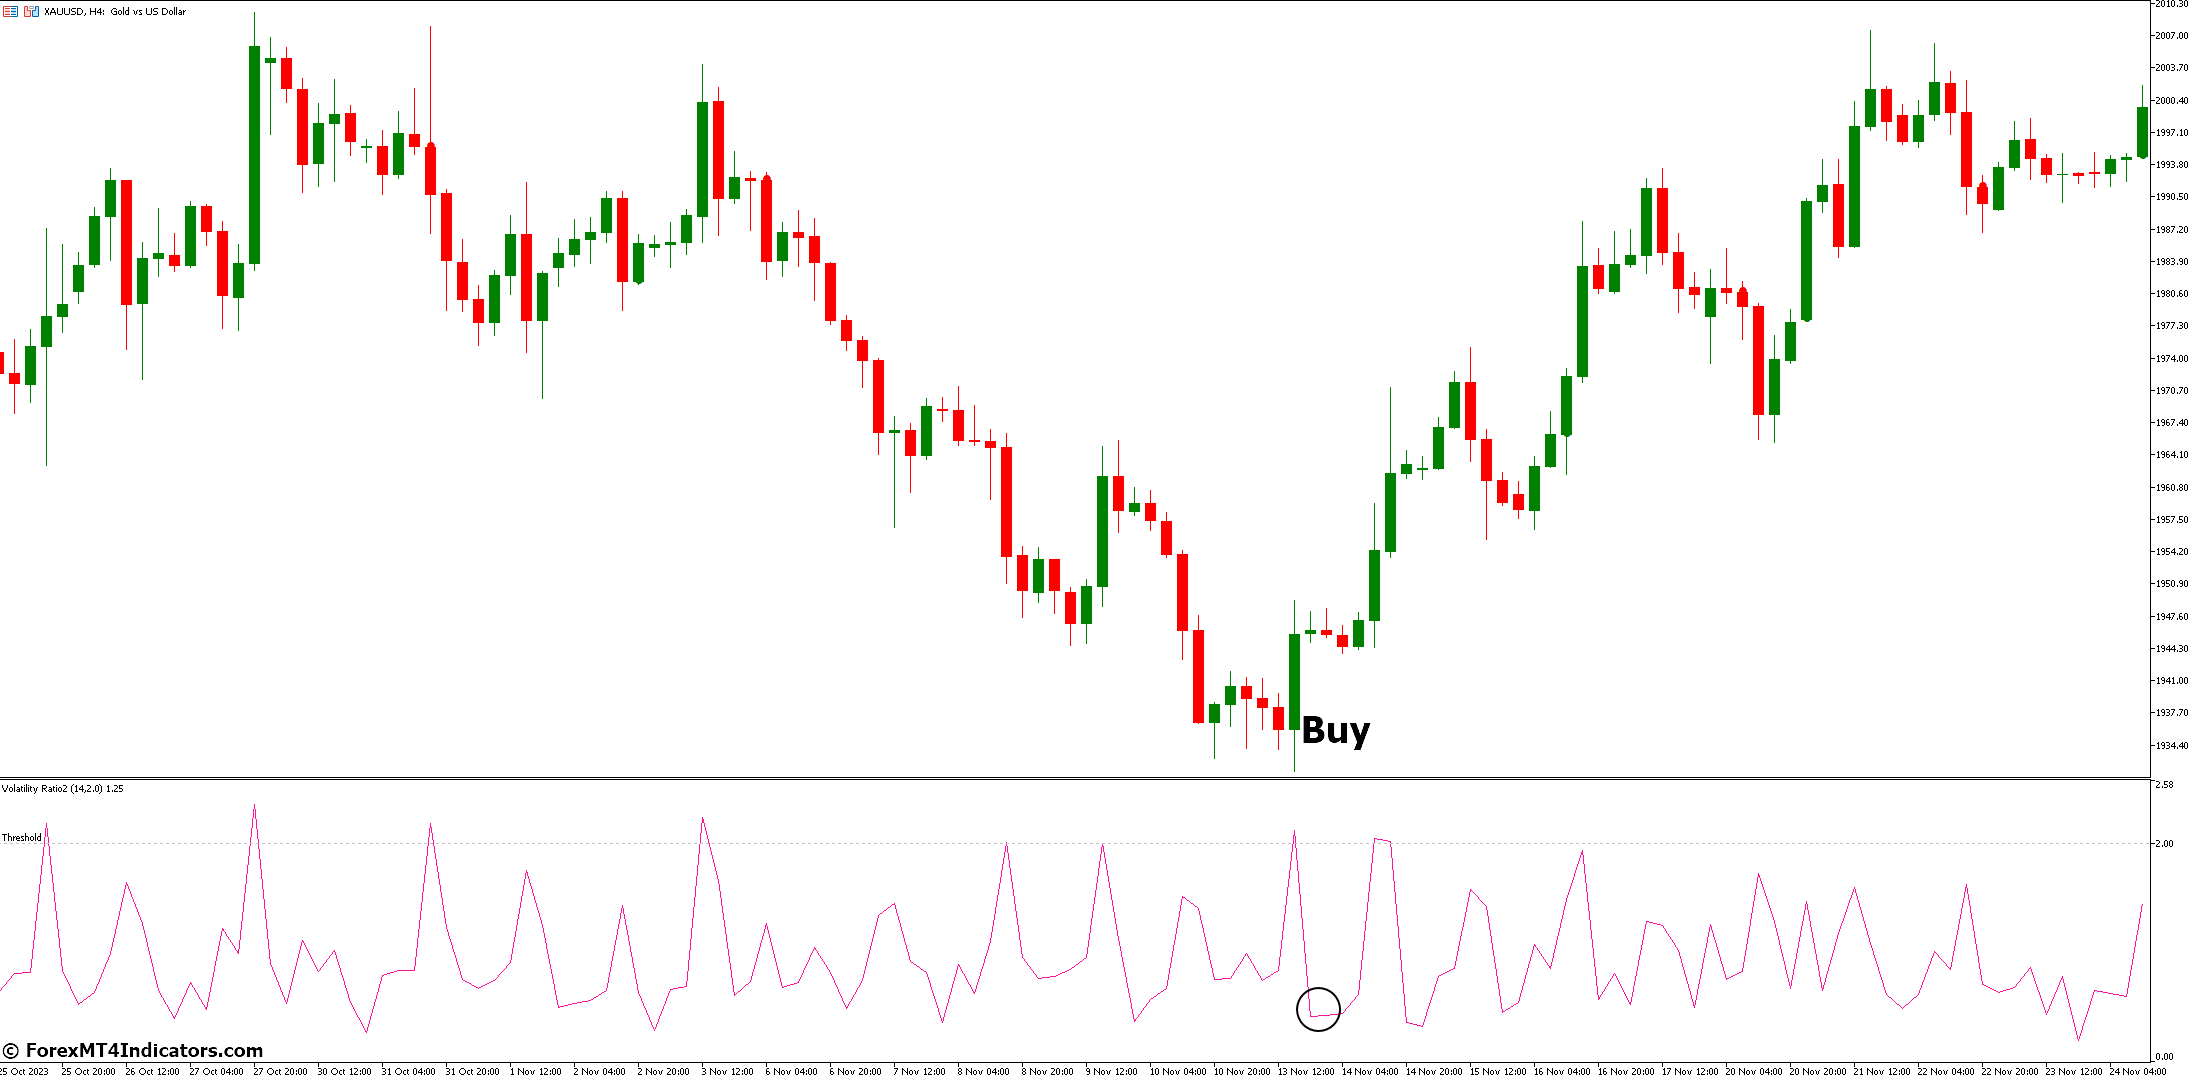
Buy Entry
- Breakout Above 1 with Confirmation:
- When the Volatility Ratio 2 Indicator value decisively breaks above 1, potentially signaling increased volatility and a trend reversal.
- Look for additional confirmation from other technical indicators, such as bullish candlestick patterns or rising price momentum indicators (e.g., RSI).
- Place a stop-loss order below a recent swing low or support level to limit potential losses.
- Consider taking profits at a predetermined level based on technical analysis (e.g., resistance level) or a trailing stop-loss that adjusts as the price moves in your favor.
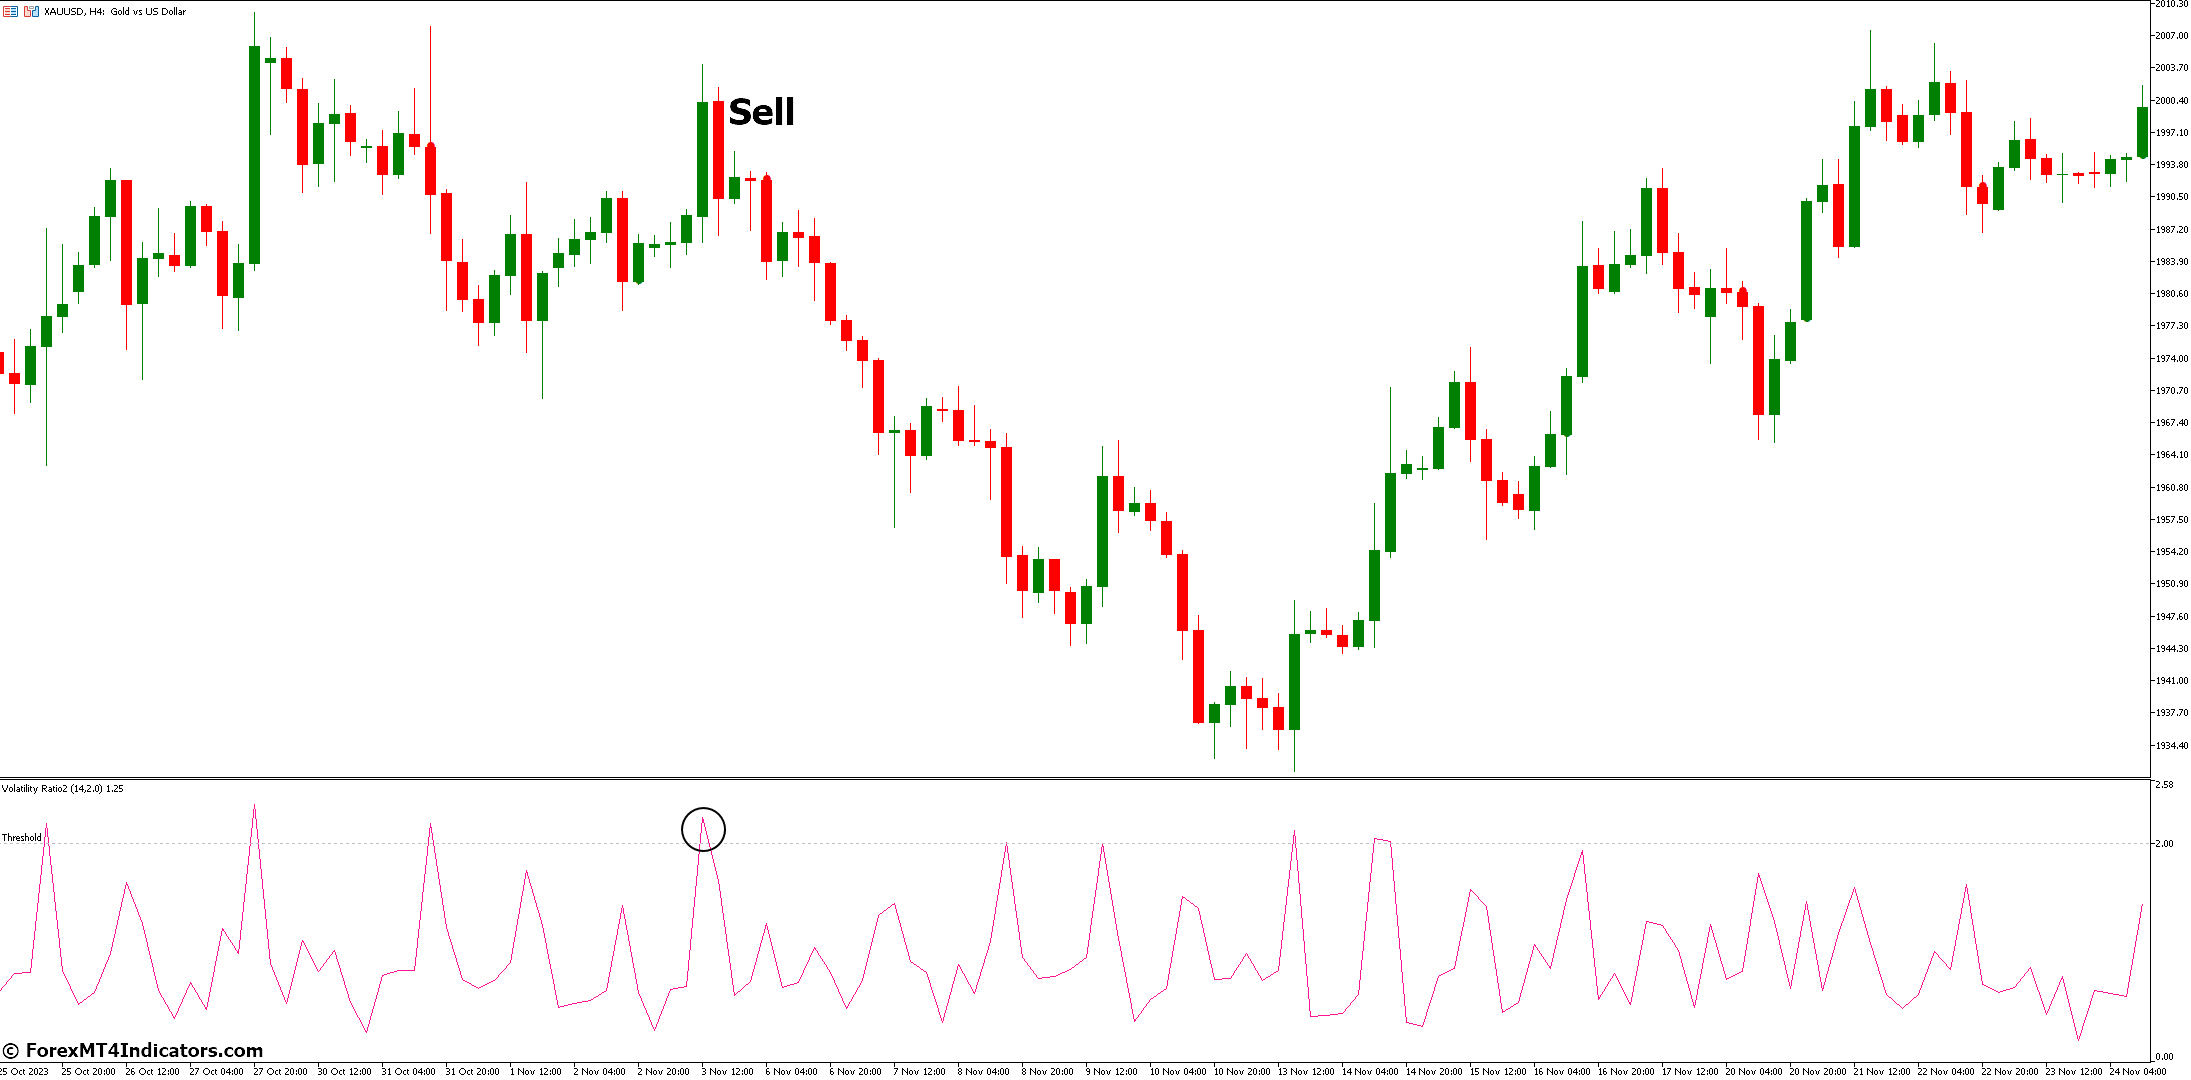
Sell Entry
- Sharp Drop Below 1 with Divergence:
- When the Volatility Ratio 2 Indicator value sharply dips below 1, potentially indicating a decrease in volatility and a weakening trend.
- Look for confirmation from a bearish divergence between the indicator and price action (e.g., price continues to rise while the indicator falls).
- Place a stop-loss order above a recent swing high or resistance level to limit potential losses.
- Consider taking profits at a predetermined level based on technical analysis (e.g., support level) or a trailing stop-loss that adjusts as the price moves in your favor.
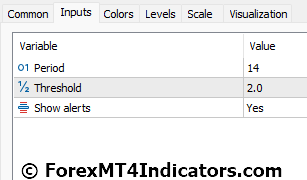
Volatility Ratio 2 Indicator Settings
Conclusion
We’ve embarked on a journey to unveil the power of the Volatility Ratio 2 Indicator. Now, let’s explore how to integrate this knowledge into your trading practice: Remember, the Volatility Ratio 2 Indicator is a valuable tool for gauging market volatility, offering insights into potential trend reversals and periods of heightened activity.
However, it’s not a crystal ball. Always prioritize responsible trading practices. Combine the Volatility Ratio 2 Indicator with other technical analysis tools and fundamental analysis. Implement sound risk management strategies like stop-loss orders and position sizing. The financial markets are a dynamic ecosystem.
Recommended MT5 Brokers
XM Broker
- Free $50 To Start Trading Instantly! (Withdraw-able Profit)
- Deposit Bonus up to $5,000
- Unlimited Loyalty Program
- Award Winning Forex Broker
- Additional Exclusive Bonuses Throughout The Year
>> Sign Up for XM Broker Account here <<
FBS Broker
- Trade 100 Bonus: Free $100 to kickstart your trading journey!
- 100% Deposit Bonus: Double your deposit up to $10,000 and trade with enhanced capital.
- Leverage up to 1:3000: Maximizing potential profits with one of the highest leverage options available.
- ‘Best Customer Service Broker Asia’ Award: Recognized excellence in customer support and service.
- Seasonal Promotions: Enjoy a variety of exclusive bonuses and promotional offers all year round.
>> Sign Up for FBS Broker Account here <<
(Free MT5 Indicators Download)
Click here below to download:


