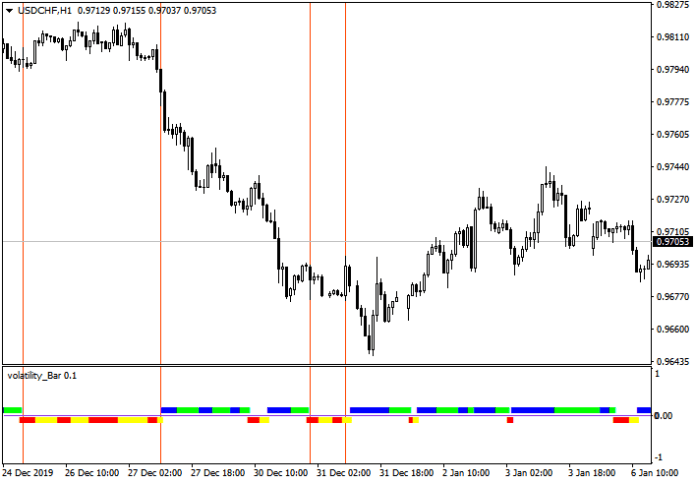
Volatility Bar MT4 Indicator is designed to measure and visualize market volatility. Unlike traditional indicators that rely solely on price movements, this tool considers both high and low prices. Let’s dive into the specifics:
Why Is It Important?
Market volatility is akin to the ebb and flow of ocean waves. It impacts your trading decisions, risk management, and overall profitability. By using the Volatility Bar MT4 Indicator, you gain a clear understanding of how volatile the market is at any given moment. This knowledge empowers you to adjust your strategy accordingly.
How Does It Work?
The indicator calculates volatility based on the difference between the high and low prices within a specified period. It then presents this information as bars on your MT4 chart. Blue bars indicate rising volatility, while gray bars signal decreasing volatility. As a trader, you can use these visual cues to time your entries and exits effectively.
How To Understand The Volatility Bar Mt4 Indicator
To interpret the indicator, pay attention to the following:
- Bar Length: Longer bars signify greater volatility, while shorter bars indicate calmer market conditions.
- Color Coding: Blue bars suggest increased volatility, signaling potential trading opportunities. Gray bars, on the other hand, hint at subdued market activity.
- Context: Consider the broader market context. Is the volatility spike related to news events, economic data releases, or technical patterns?
Volatility Clusters And Predictive Power
When analyzing the Volatility Bar MT4 Indicator, pay attention to clusters of consecutive blue bars. These clusters often precede significant price movements. Imagine them as the calm before the storm a buildup of energy waiting to be unleashed. As a trader, spotting these clusters can provide valuable insights.
When you observe a sequence of rising volatility bars, consider it a signal to prepare for potential breakouts or trend reversals. Keep in mind that the length of the cluster matters; longer clusters tend to have more pronounced effects.
Combining With Other Technical Tools
Volatility Bar MT4 Indicator is even more potent when combined with other technical indicators. Experiment with pairing it alongside oscillators like the Relative Strength Index (RSI) or the Moving Average Convergence Divergence (MACD).
These complementary tools can validate or enhance your analysis. For instance, if the indicator shows rising volatility (blue bars), check if the RSI confirms overbought conditions. Conversely, when volatility decreases (gray bars), look for convergence or divergence with the MACD. Remember, the synergy between indicators often reveals hidden patterns.
Intraday Vs Swing Trading Strategies
Your trading style influences how you interpret and utilize the indicator. Let’s explore two scenarios, If you’re an intraday trader, focus on short-term volatility. Use the indicator on lower timeframes (such as 15 minutes or 1 hour) to capture quick price movements. Look for sudden spikes in volatility that align with other signals (e.g., candlestick patterns or support/resistance levels).
Tighten your stop-loss orders during high volatility to protect gains. Swing Traders: Swing traders operate on longer timeframes (daily or weekly). For them, the Volatility Bar MT4 Indicator serves as a compass for trend confirmation. When blue bars coincide with a breakout above a key resistance level, it validates the bullish trend. Conversely, during consolidation phases (gray bars), consider waiting for clearer signals. Remember, patience pays off in swing trading—wait for the right setup before committing.
How to Trade with Volatility Bar Indicator
Buy Entry
- Observe the indicator for rising blue bars, indicating increased volatility.
- Once you spot a significant blue bar, consider entering when the next candlestick opens.
- Look for additional confirmation from other technical tools (e.g., moving averages or trendlines).
- Set your stop-loss just below the low of the blue bar or a recent swing low.
Sell Entry
- Look for gray bars, indicating decreased volatility or a potential reversal.
- Wait for a strong downward bar (longer than usual) to confirm bearish momentum.
- Consider entering when the next candlestick opens after a significant gray bar.
- Confirm with other technical indicators (e.g., RSI or MACD) if possible.
- Set your stop-loss just above the high of the gray bar or a recent swing high.
- Use trailing stops to lock in profits as the price moves in your favor.
Conclusion
Volatility Bar MT4 Indicator is your compass in the turbulent sea of trading. Embrace its insights, adapt your strategies, and navigate the markets with confidence. Remember, volatility isn’t your enemy—it’s your ally when wielded wisely.
Recommended MT4/MT5 Brokers
XM Broker
- Free $50 To Start Trading Instantly! (Withdraw-able Profit)
- Deposit Bonus up to $5,000
- Unlimited Loyalty Program
- Award Winning Forex Broker
- Additional Exclusive Bonuses Throughout The Year
>> Sign Up for XM Broker Account here <<
FBS Broker
- Trade 100 Bonus: Free $100 to kickstart your trading journey!
- 100% Deposit Bonus: Double your deposit up to $10,000 and trade with enhanced capital.
- Leverage up to 1:3000: Maximizing potential profits with one of the highest leverage options available.
- ‘Best Customer Service Broker Asia’ Award: Recognized excellence in customer support and service.
- Seasonal Promotions: Enjoy a variety of exclusive bonuses and promotional offers all year round.
>> Sign Up for FBS Broker Account here <<
(Free MT4 Indicators Download)
Click here below to download:


