


Momentum reversals often develop whenever the market is at an oversold or overbought level. This scenario is called a mean reversal and is an excellent opportunity for traders to trade. However, overextended market levels are often difficult to identify solely based on a naked chart. This strategy shows us how we can use technical indicators to identify possible mean reversal trading opportunities based on confluences objectively.
T3 Ergodic Candlestick Oscillator
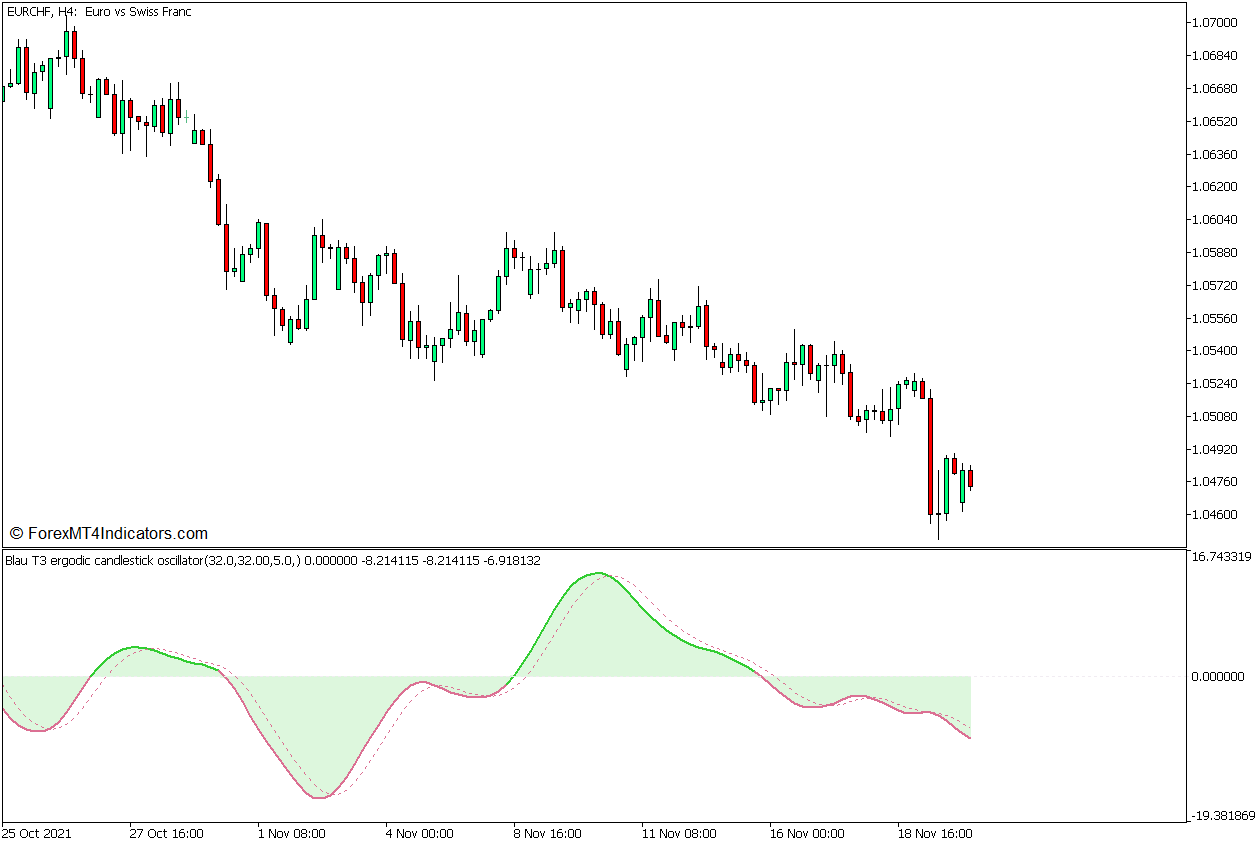
The T3 Ergodic Candlestick Oscillator is a momentum technical indicator developed by W. Blau. The intention for developing this technical indicator was to create an oscillator that would impinge or include all data points represented on the chart, thus it is called “ergodic”.
This oscillator is based on the concept of using the body of the candlesticks, taking into account its size and direction. Despite being based on the body of each candlestick, this indicator’s algorithm is intrinsically unaffected by price gaps, unlike most momentum-based technical indicators, allowing it to include all data points on the price chart.
The T3 Ergodic Candlestick Oscillator plots two lines which are based on a modified moving average line that emphasizes its smoothening feature. It subtracts the difference between its two underlying modified moving average lines, the value of which is drawn as a line that oscillates around a midline, which is zero. It then calculates the moving average of the difference between the two modified moving average lines, the result of which becomes the data points for the signal line.
This indicator plots its main oscillator line as a solid line. This line changes color depending on the general trend direction. It plots a lime green line whenever it detects a bullish trend direction and a pale violet red line whenever it detects a bearish trend direction.
The signal line on the other hand is represented by a dashed line.
Momentum direction may also be identified based on the interaction between the main oscillator line and its signal line. Momentum is bullish whenever the main line is above the signal line, and bearish whenever the main line is below the signal line.
As an oscillator, this indicator may also be used to identify divergences. Crossovers between the two lines that develop as part of a divergence may indicate a strong momentum reversal.
Bollinger Bands
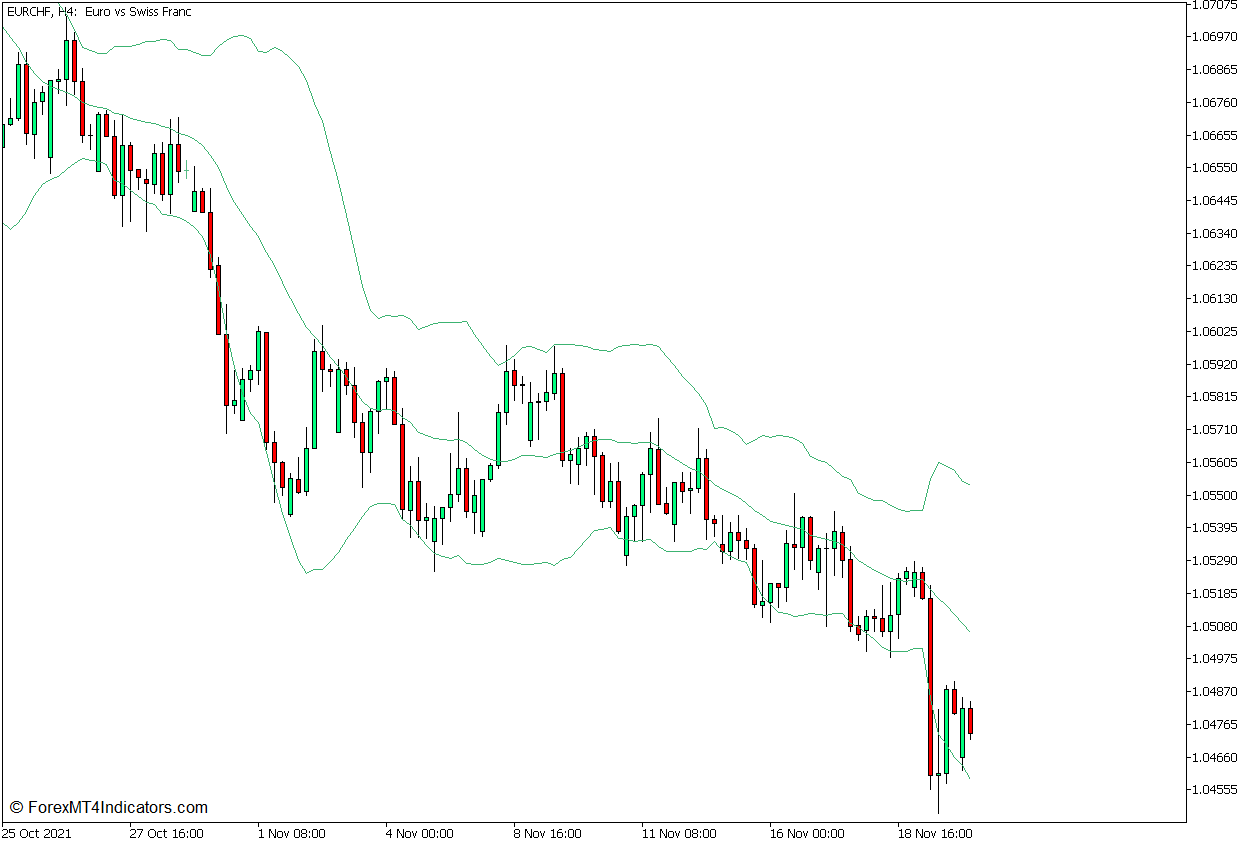
The Bollinger Bands is a versatile technical indicator that may be used to identify trend direction, and volatility as oversold and overbought markets.
The Bollinger Bands is composed of three lines. The middle line is basically a Simple Moving Average (SMA) line, which is usually set at a 20-bar calculation. The outer lines on the other hand are standard deviations based on the movements of price shifted above and below the middle line. These three lines create a band-like structure which typically envelopes price action.
Since the Bollinger Bands is based on moving averages, it can also be used to identify trends the same way moving average lines are used. Markets are considered to have a bullish trend bias whenever price action is generally on the upper half of the band, and bearish whenever price action is generally on the lower half of the band.
It can also be used to identify volatility based on the contraction and expansion of the outer lines. The market is considered to be in a market contraction phase whenever the band is contracting and in a market expansion phase whenever the band is expanding.
The outer lines are also used to identify oversold and overbought markets, acting as threshold markers for the normal range of the market based on its volatility. Price levels above the upper line are considered overbought while price levels below the lower line are considered oversold. Price rejection signals forming at or beyond the lines are considered strong indications of a potential market reversal.
Trading Strategy Concept
This trading strategy is a momentum reversal trading strategy which is based on market reversal signals developing in oversold or overbought market conditions. In particular, we will be looking for reversal trades based on divergences that are in confluence with a probable mean reversal signal.
The Bollinger Bands act as the primary indication of a probable mean reversal based on price action showing signs of price rejection at levels beyond its outer lines, which may either be oversold or overbought.
The T3 Ergodic Candlestick Oscillator is then used to identify divergences that are in confluence with the oversold or overbought market conditions based on the Bollinger Bands.
If both conditions are met, we may then look for trade entry signals which are the crossovers between the main line and signal line of the T3 Ergodic Candlestick Oscillator.
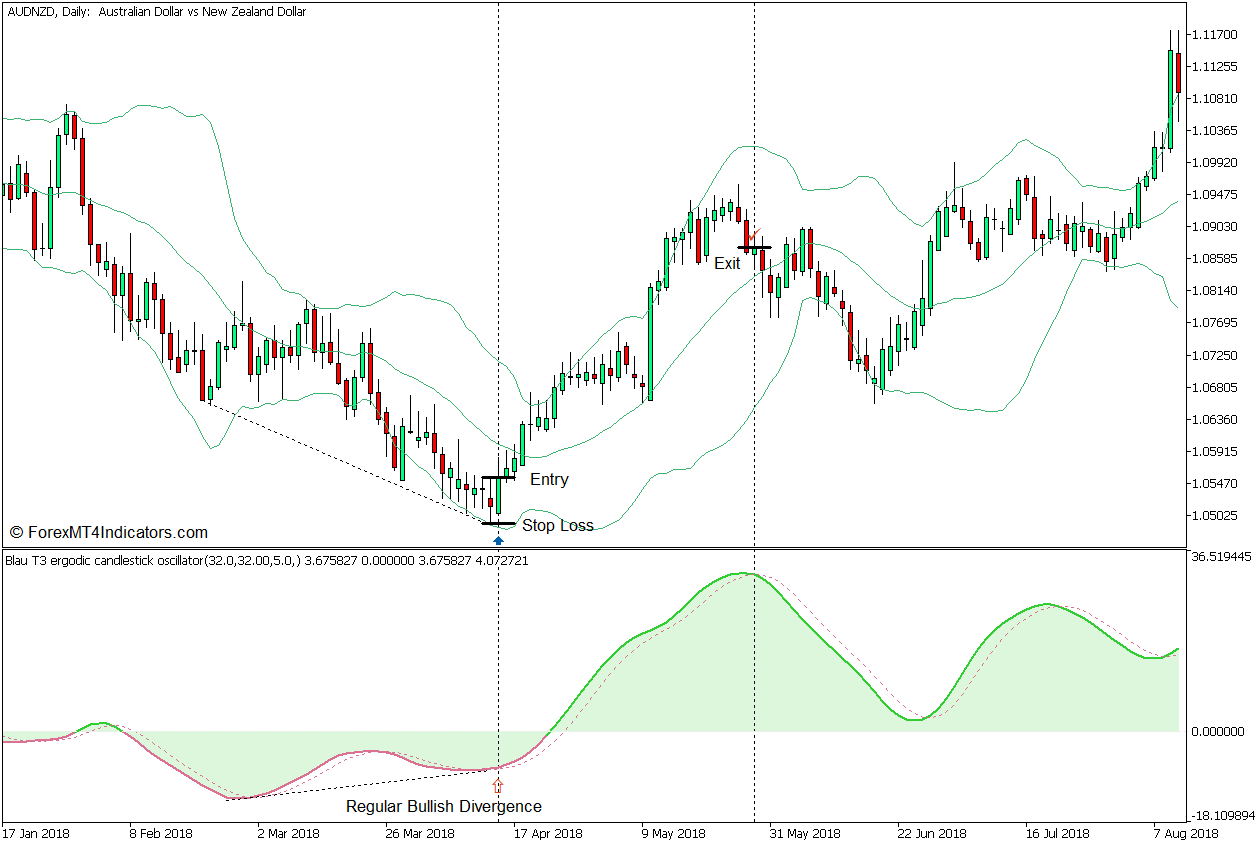
Buy Trade Setup
Entry
- Price action should drop to the area below the lower line of the Bollinger Bands and show signs of price rejection.
- A bullish divergence between the T3 Ergodic Candlestick Oscillator and price action should be identified.
- Open a buy order as soon as the main oscillator line crosses above the signal line.
Stop Loss
- Set the stop loss on the fractal below the entry candle.
Exit
- Close the trade as soon as the main oscillator line crosses below the signal line.
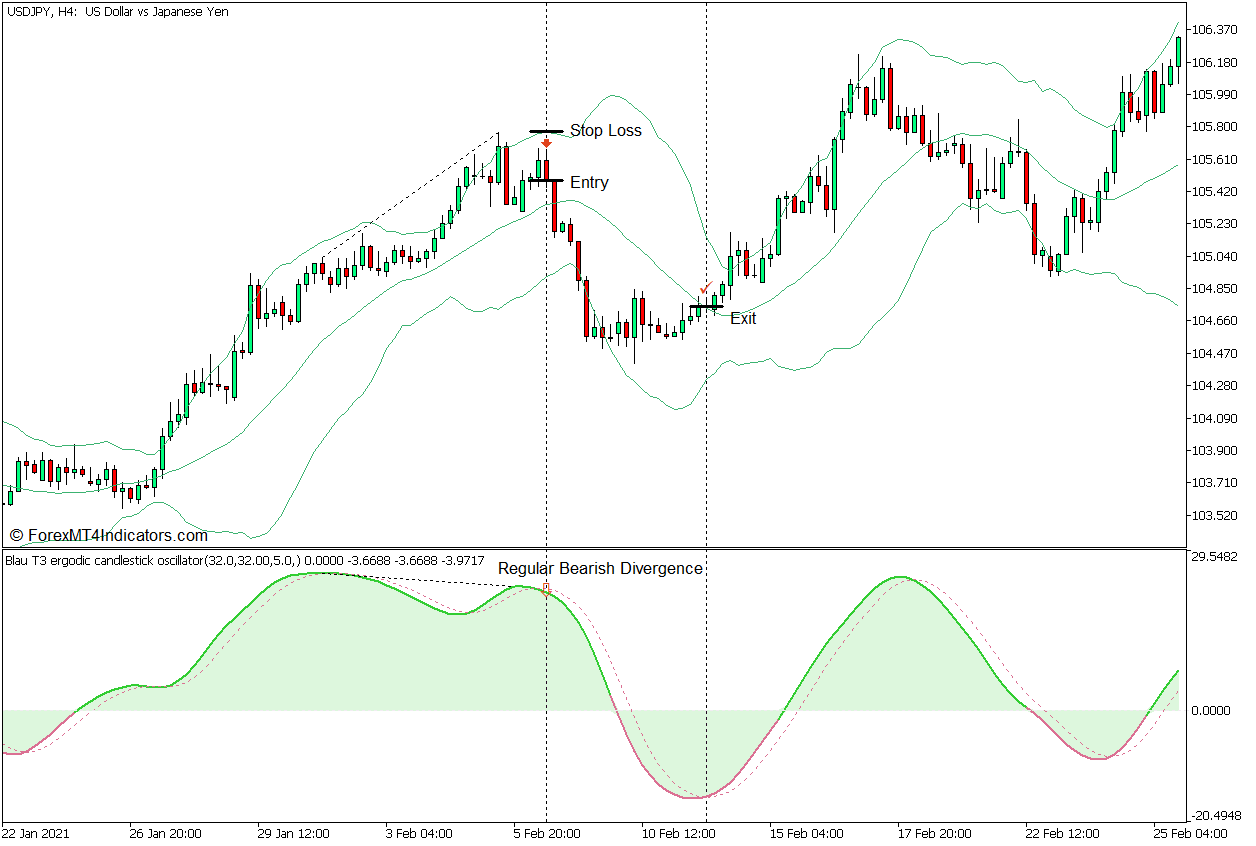
Sell Trade Setup
Entry
- Price action should spike to the area above the upper line of the Bollinger Bands and show signs of price rejection.
- A bearish divergence between the T3 Ergodic Candlestick Oscillator and price action should be identified.
- Open a sell order as soon as the main oscillator line crosses below the signal line.
Stop Loss
- Set the stop loss on the fractal above the entry candle.
Exit
- Close the trade as soon as the main oscillator line crosses above the signal line.
Conclusion
This strategy can provide decent reversal trade setups that are based on price action as well as identifiable indicator signals that may provide clues of a probable momentum reversal. However, since this strategy is mainly based on technical indicators, it is mostly indicative and not causative. The indicators may indicate that the market is about to reverse but these are not the reasons why the market would reverse. As such, it is still best to trade this strategy on areas where the market should reverse, which is usually based on the market structure of the higher timeframes.
Recommended MT5 Brokers
XM Broker
- Free $50 To Start Trading Instantly! (Withdraw-able Profit)
- Deposit Bonus up to $5,000
- Unlimited Loyalty Program
- Award Winning Forex Broker
- Additional Exclusive Bonuses Throughout The Year

>> Sign Up for XM Broker Account here <<
FBS Broker
- Trade 100 Bonus: Free $100 to kickstart your trading journey!
- 100% Deposit Bonus: Double your deposit up to $10,000 and trade with enhanced capital.
- Leverage up to 1:3000: Maximizing potential profits with one of the highest leverage options available.
- ‘Best Customer Service Broker Asia’ Award: Recognized excellence in customer support and service.
- Seasonal Promotions: Enjoy a variety of exclusive bonuses and promotional offers all year round.

>> Sign Up for FBS Broker Account here <<
Click here below to download: