


Trends and runs are inherently the same. The only difference is in the time horizon in which it is taking shape. Trends might be considered more of a mid-term trend horizon, while runs have a more short-term indication. As some traders would say, the only difference is in the timeframe in which they are visible. This strategy shows us how we could trade on the confluence between the mid-term trend direction and the short-term momentum reversals using two technical indicators.
Supertrend Indicator
The Supertrend indicator is a trend-following technical indicator that takes into account the average movement of price. In particular, the Supertrend indicator is based on the concept of using the Average True Range (ATR) as a basis for identifying trend direction.
One of the ways traders identify trend direction is by using the ATR as a basis for spotting trends and trend reversals. Traders may use a multiple of the ATR to measure the distance from the recent high or low which would be the threshold for identifying trend reversals. The most common multipliers are 2 and 3. For example, in an uptrend market, we could use a value that is 3x the ATR and subtract it from the highest high of the current trend.
If the price drops below that threshold, the market is considered to have reversed to a downtrend. Inversely, in a downtrend market, the same value should be added to the lowest low of the trend in order to arrive at the threshold. If the price breaks above it, then the market has reversed to an uptrend.
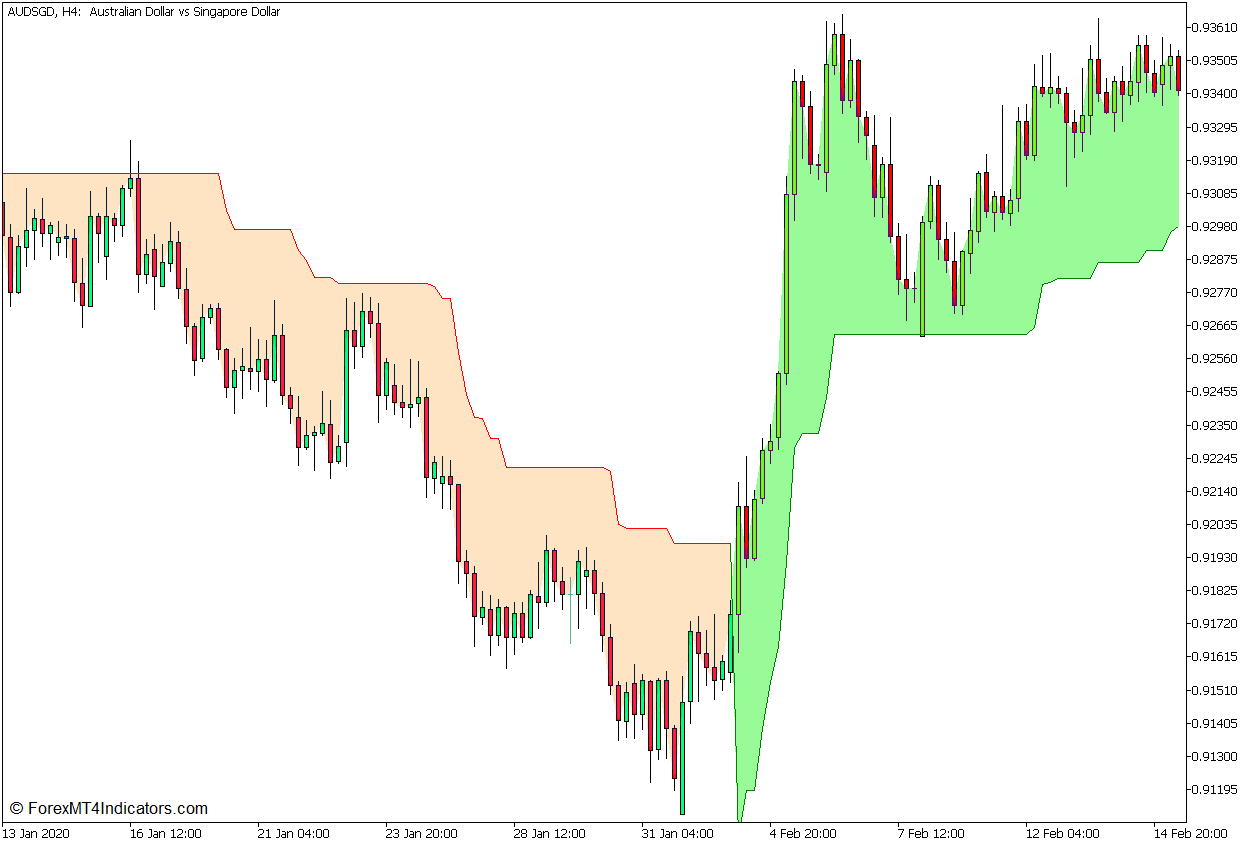
The Supertrend indicator uses the same concept mentioned above, making the presentation of the trend, as well as the threshold more visual. The indicator simply plots a line indicating the threshold of the trend. If the price crosses the threshold and closes opposite the direction of the trend, the threshold line shifts indicating a trend reversal.
This version of the Supertrend indicator also shades the area between price action and the threshold to indicate the direction of the trend. It shades the area pale green to indicate an uptrend and bisque to indicate a downtrend.
VEMA MACD Indicator
The VEMA MACD indicator is an oscillator type of technical indicator that is used to help traders identify momentum direction. Specifically, it is a modified MACD oscillator that incorporates volume within its algorithm.
The Moving Average Convergence and Divergence (MACD) is an oscillator that calculates for the difference between two Exponential Moving Average (EMA) lines. The value is then used as a data point for the oscillator line. It also calculates the Simple Moving Average (SMA) of the difference between the two EMA lines, which becomes the data points used for its signal line.
This creates an oscillator that plots two lines that oscillate around a midline of zero. Negative lines indicate a downtrend, while positive lines indicate an uptrend. Lines that have extended far from zero can also indicate oversold or overbought markets, both of which are prime conditions for a mean reversal. Crossovers between the main MACD line and the signal line also indicate a potential momentum reversal.
The VEMA MACD indicator modifies the basic MACD by using EMAs which add weight to a price data point based on the volume within its corresponding bar. It is in fact a “volume-weighted” MACD, making it more reliable as an indicator since it adds emphasis on data points that have more volume behind them.
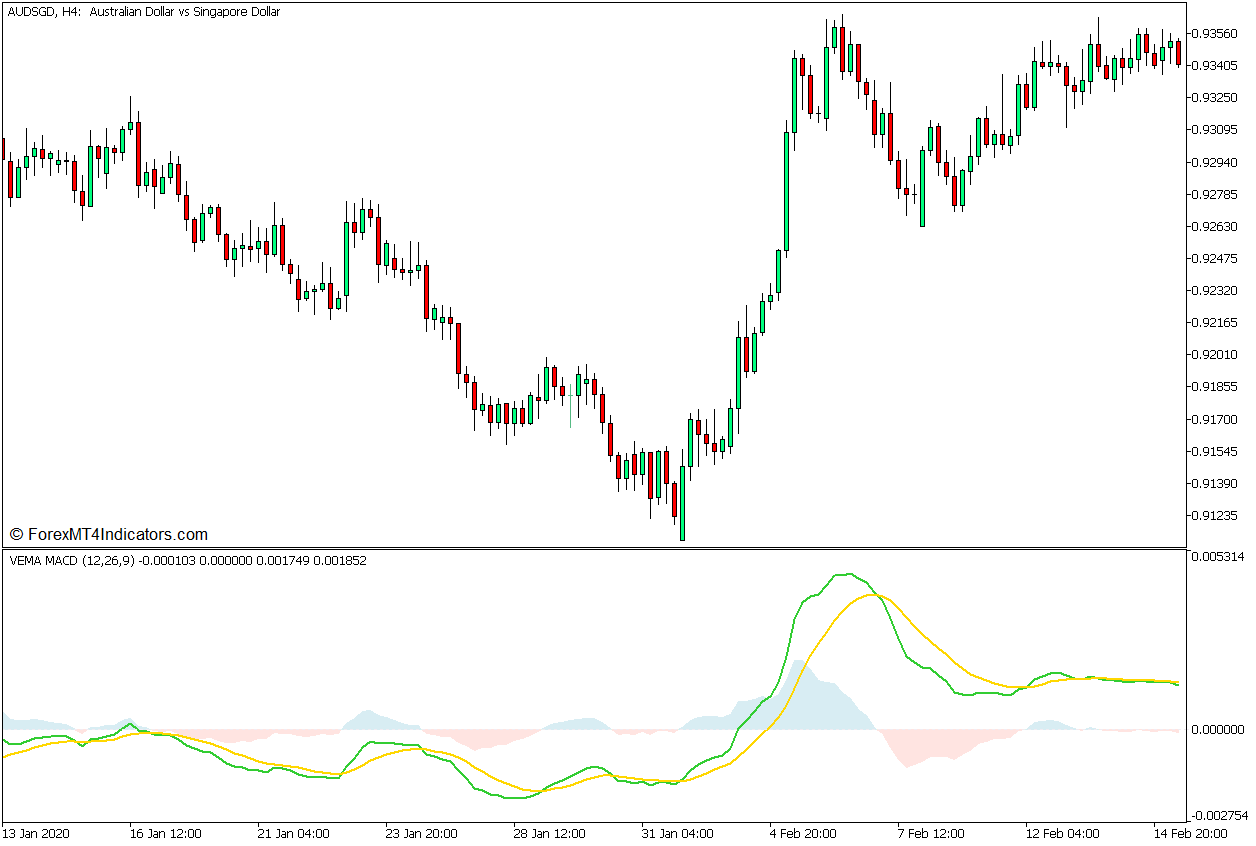
This indicator plots a lime green MACD line and a gold signal line. It also plots another shaded area that oscillates around zero representing the difference between the MACD line and the signal line, allowing traders to easily identify the direction of momentum based on whether the shaded area is positive or negative.
Trading Strategy Concept
This trading strategy is a trend continuation strategy that makes use of a trend-following indicator, which is the Supertrend indicator, and a momentum indicator, which is the VEMA MACD.
The Supertrend indicator is mainly used as the direction filter. Traders simply have to identify the direction of the trend based on the color of the shaded area. As soon as the trend direction is identified, trading opportunities should be filtered in the direction of the indicated trend.
The VEMA MACD is then used as a trade entry signal. These are crossovers between the MACD line and the signal line which indicate a confluence of trend and momentum that conforms with the trend indication of the Supertrend indicator. The trend based on the VEMA MACD is identified based on whether the lines are positive or negative, while the momentum reversal is based on the crossover of the two lines.
Traders should however avoid trading whenever the MACD line and signal line is overextended far from the midline.
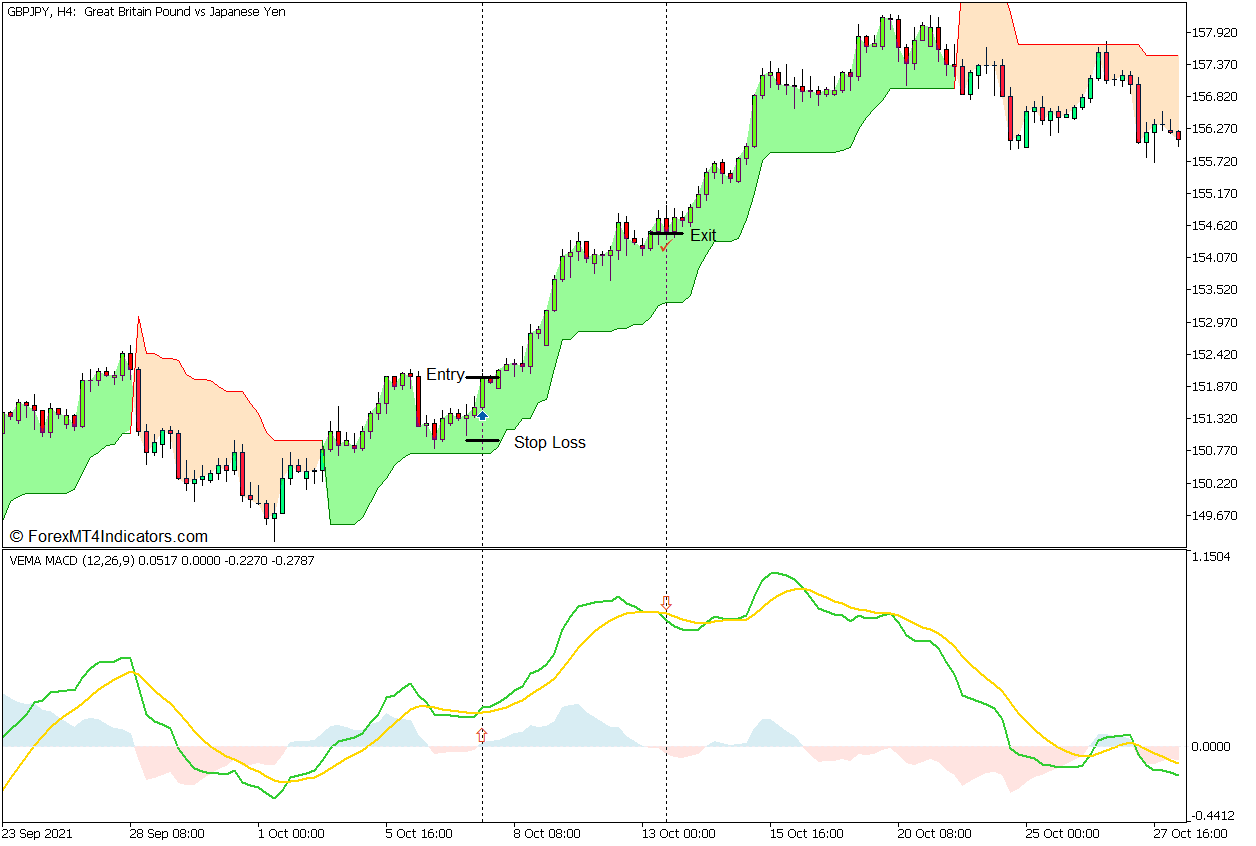
Buy Trade Setup
Entry
- The Supertrend indicator should plot a pale green shade indicating an uptrend.
- The VEMA MACD lines should be positive confirming the uptrend.
- Wait for price action to pull back causing the MACD line to temporarily cross below the signal line.
- Open a buy order as soon as the MACD line crosses back above the signal line.
Stop Loss
- Set the stop loss on the fractal below the entry candle.
Exit
- Close the trade as soon as the MACD line crosses below the signal line.
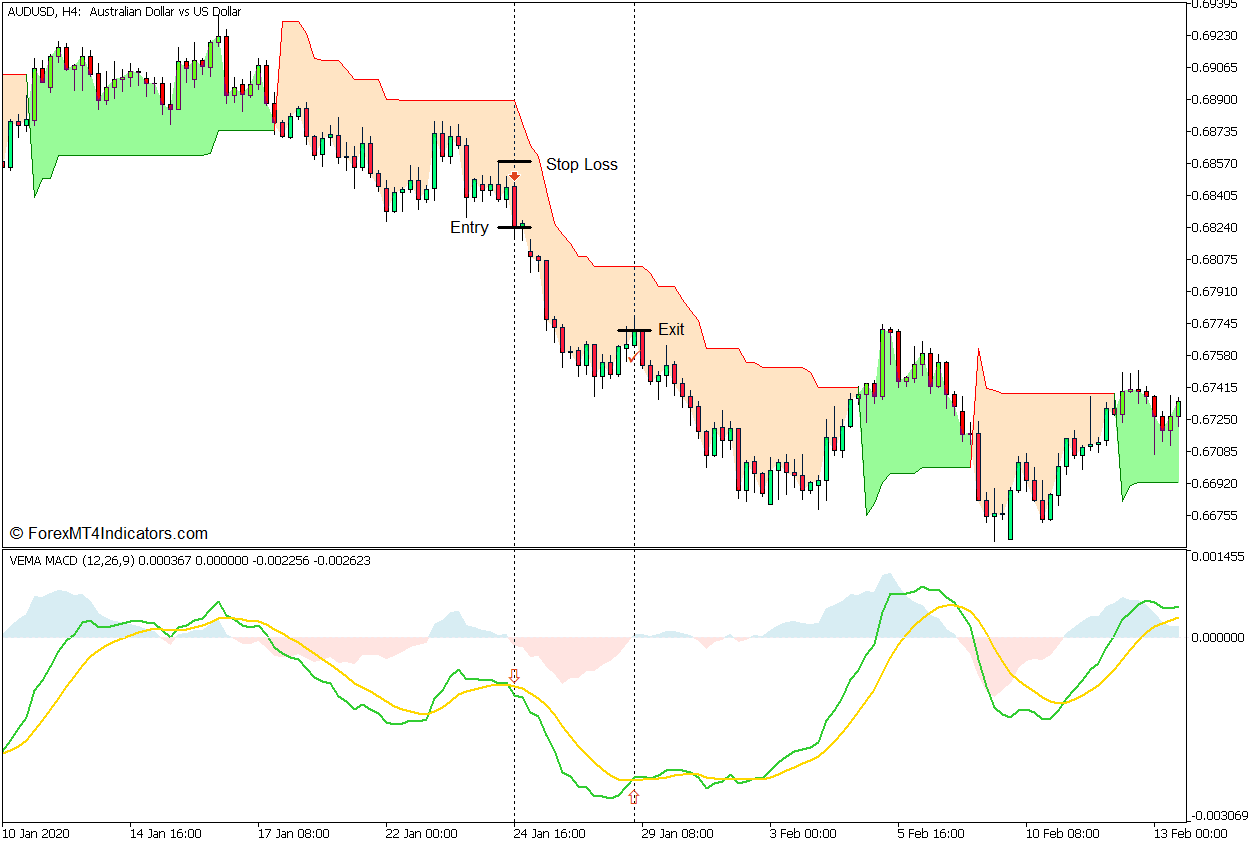
Sell Trade Setup
Entry
- The Supertrend indicator should plot a bisque shade indicating a downtrend.
- The VEMA MACD lines should be negative confirming the downtrend.
- Wait for price action to pull back causing the MACD line to temporarily cross above the signal line.
- Open a sell order as soon as the MACD line crosses back below the signal line.
Stop Loss
- Set the stop loss on the fractal above the entry candle.
Exit
- Close the trade as soon as the MACD line crosses above the signal line.
Conclusion
This trading strategy can be an excellent trend-following strategy given the fact that trade signals develop on the confluence of the mid-term trend and the short-term momentum. This setup can be used as a trade entry signal while being incorporated into a longer-term trading strategy. It is also best to observe the market structure to avoid trading at price extremes where trade signals may be less reliable.
Recommended MT5 Brokers
XM Broker
- Free $50 To Start Trading Instantly! (Withdraw-able Profit)
- Deposit Bonus up to $5,000
- Unlimited Loyalty Program
- Award Winning Forex Broker
- Additional Exclusive Bonuses Throughout The Year

>> Sign Up for XM Broker Account here <<
FBS Broker
- Trade 100 Bonus: Free $100 to kickstart your trading journey!
- 100% Deposit Bonus: Double your deposit up to $10,000 and trade with enhanced capital.
- Leverage up to 1:3000: Maximizing potential profits with one of the highest leverage options available.
- ‘Best Customer Service Broker Asia’ Award: Recognized excellence in customer support and service.
- Seasonal Promotions: Enjoy a variety of exclusive bonuses and promotional offers all year round.

>> Sign Up for FBS Broker Account here <<
Click here below to download: