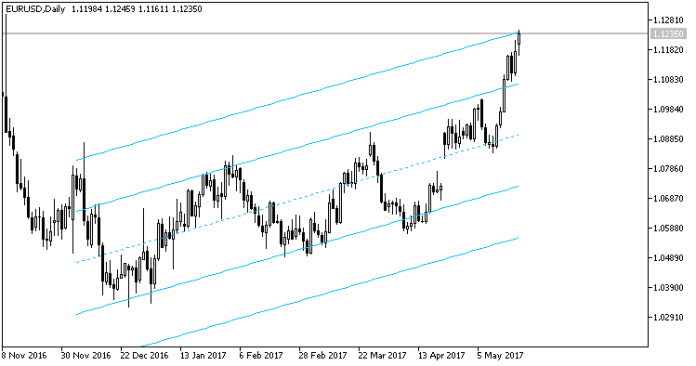
The Standard Deviation MT5 Indicator is a powerful tool for traders seeking to understand market volatility and potential price movements. In this article, we’ll explore what the indicator is, how it works, and how you can use it effectively in your trading strategy.
What is the Standard Deviation MT5 Indicator?
The Standard Deviation MT5 Indicator measures the dispersion of price data around the average price. It quantifies market volatility by calculating the standard deviation of price values over a specified period. Traders commonly use it to identify potential trend reversals, overbought or oversold conditions, and volatility spikes.
How Does the Indicator Work?
The Standard Deviation MT5 Indicator calculates the standard deviation of closing prices over a user-defined lookback period. The higher the standard deviation, the greater the price volatility. Conversely, a lower standard deviation indicates lower volatility.
Interpretation and Application
Volatility Assessment
Traders can use the indicator to assess market volatility. A high standard deviation suggests increased price fluctuations, while a low standard deviation indicates stability.
Bollinger Bands
The Standard Deviation MT5 Indicator is a key component of Bollinger Bands. Bollinger Bands consist of an upper band (average + 2 * standard deviation) and a lower band (average – 2 standard deviation). Price movements outside these bands can signal potential trend reversals.
Overbought and Oversold Conditions
When the indicator reaches extreme levels (e.g., above 2 standard deviations), it may indicate overbought conditions. Conversely, values below -2 standard deviations suggest oversold conditions.
Volatility Breakouts
Traders can use the indicator to identify volatility breakouts. A sudden increase in standard deviation may precede significant price movements.
Confirmation Tool
Combine the Standard Deviation MT5 Indicator with other technical tools (e.g., moving averages or RSI) for confirmation. For example, if the indicator shows high volatility and the RSI is overbought, it may signal a potential reversal.
How to Trade with Standard Deviation Indicator
Buy Entry
- Look for low volatility periods (low standard deviation).
- Wait for a price pullback or consolidation.
- When the indicator starts rising (indicating increasing volatility), consider a long position.
- Confirm with other technical indicators (e.g., moving averages or trendlines).
Sell Entry
- Monitor high volatility periods (high standard deviation).
- Look for price spikes or extended moves.
- When the indicator starts declining (indicating decreasing volatility), consider a short position.
- Confirm with other technical indicators.
Conclusion
The Standard Deviation MT5 Indicator is a versatile tool for traders. By understanding its interpretation and combining it with other indicators, you can enhance your trading decisions. Remember to adapt your strategy based on market conditions and risk tolerance.
Recommended MT5 Brokers
XM Broker
- Free $50 To Start Trading Instantly! (Withdraw-able Profit)
- Deposit Bonus up to $5,000
- Unlimited Loyalty Program
- Award Winning Forex Broker
- Additional Exclusive Bonuses Throughout The Year
>> Sign Up for XM Broker Account here <<
FBS Broker
- Trade 100 Bonus: Free $100 to kickstart your trading journey!
- 100% Deposit Bonus: Double your deposit up to $10,000 and trade with enhanced capital.
- Leverage up to 1:3000: Maximizing potential profits with one of the highest leverage options available.
- ‘Best Customer Service Broker Asia’ Award: Recognized excellence in customer support and service.
- Seasonal Promotions: Enjoy a variety of exclusive bonuses and promotional offers all year round.
>> Sign Up for FBS Broker Account here <<
(Free MT5 Indicators Download)
Click here below to download:


