


Forex Channel Trading Strategy
Price charts often look like a chaotic mess. A code that takes forever to decipher. And this is often true, especially for new traders with untrained eyes. However, for traders who have had enough chart time, forex charts at times reveal an orderly pattern amidst the chaos.
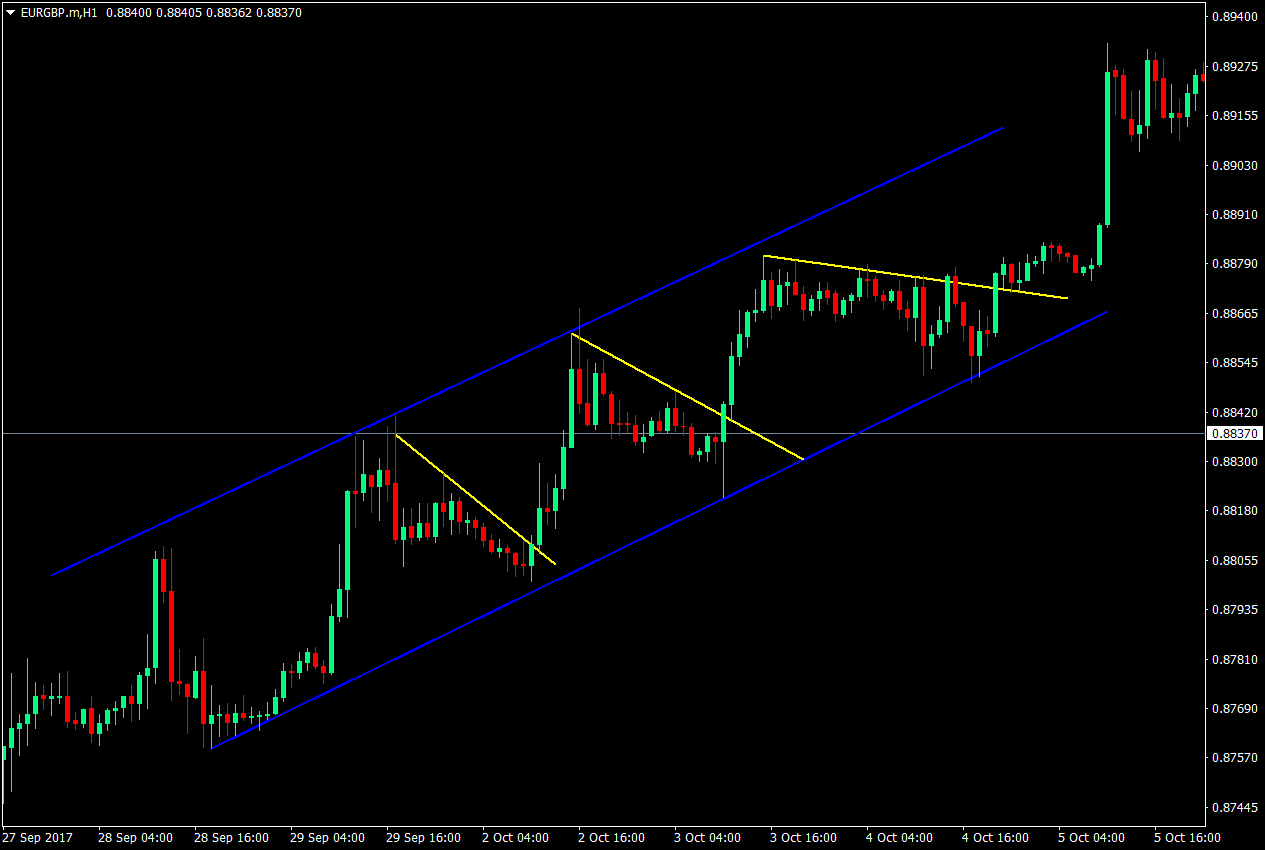
Take this chart for example.
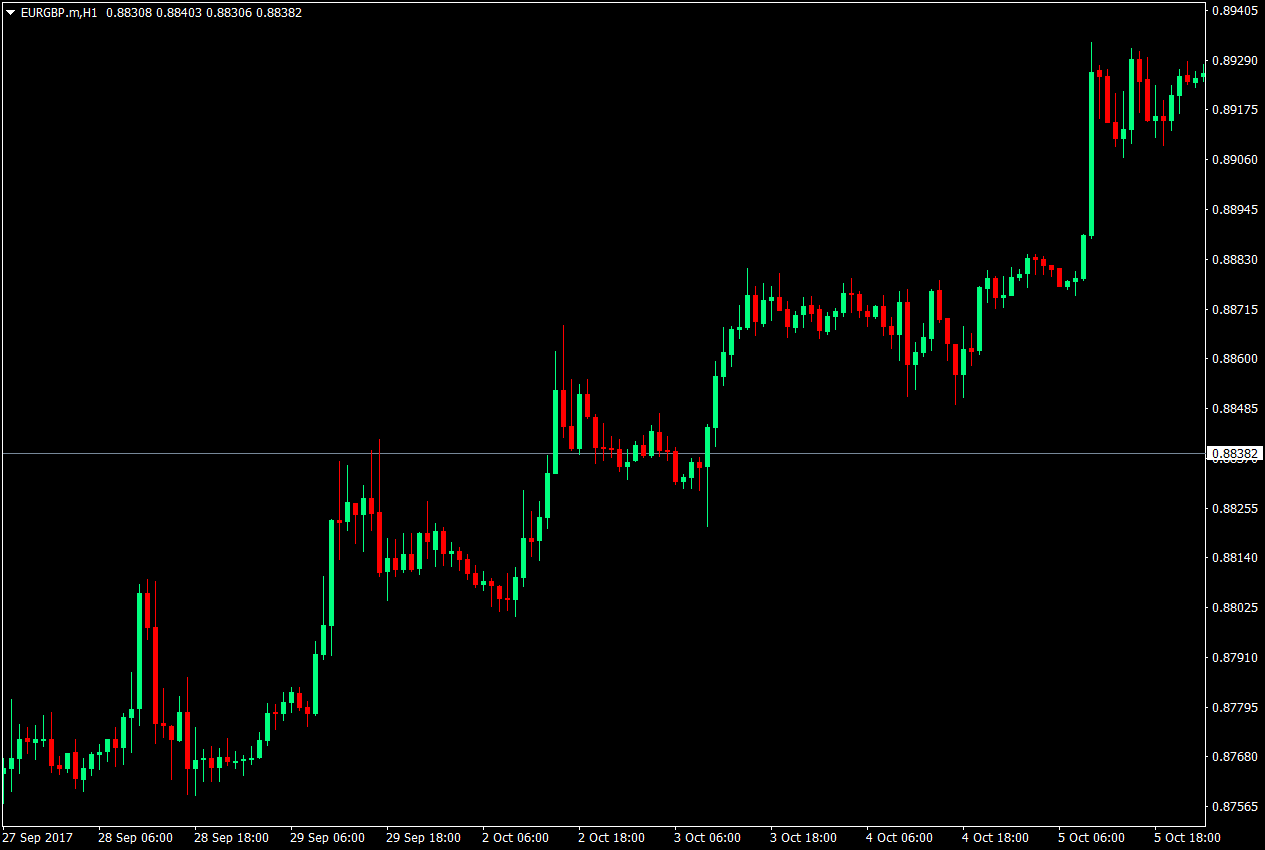
Newbies, often see this chart and wouldn’t have an idea what to do with it. Some would have an idea that this is a bullish trending chart, but still wouldn’t have a clue on how to trade it. But a few who have observed charts for quite some time would see a major support and resistance forming a channel.
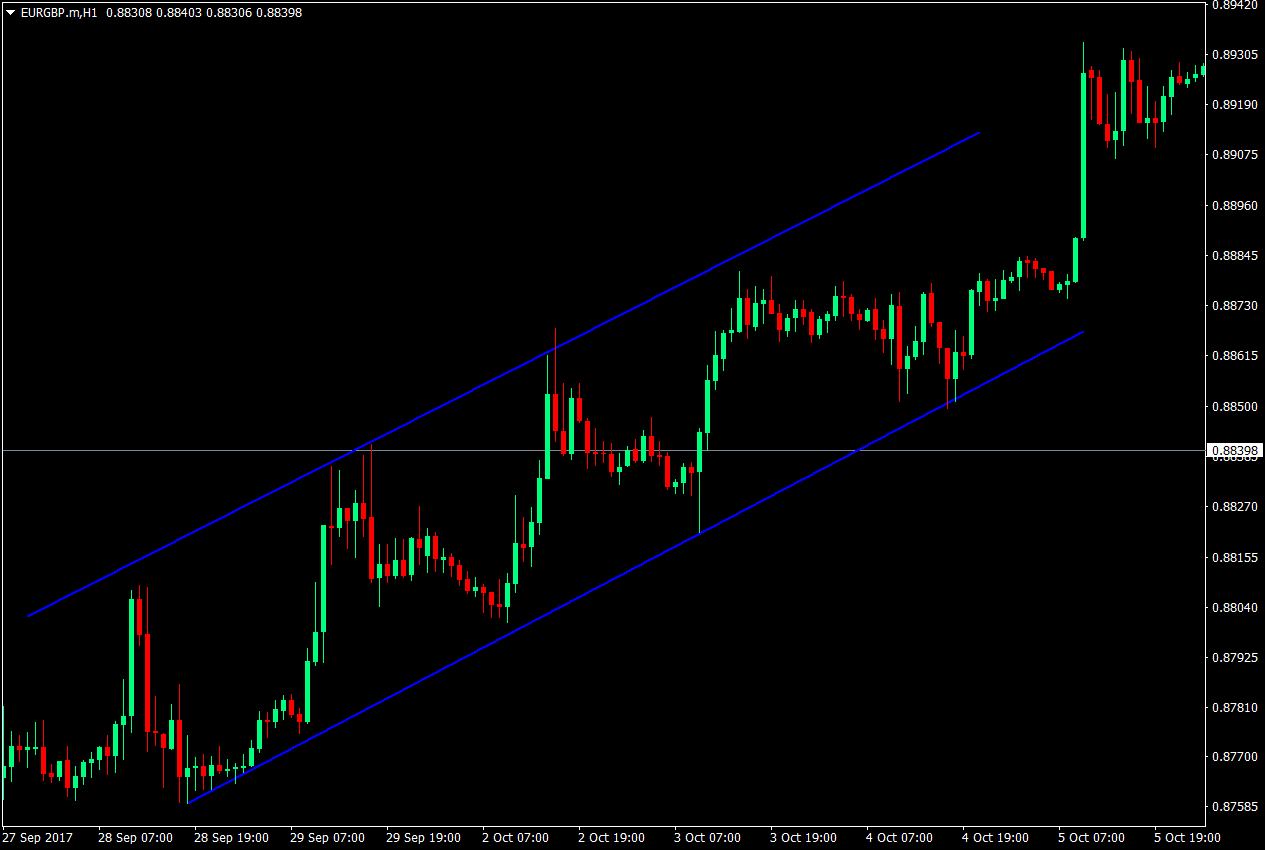
Moreover, they would see resistances where price broke-out to resume the uptrend.
To them, the chart has become an orderly and predictable market, which increases their confidence in trading their setups, and increasing their chances of having a profitable trade.
Trading channels is not as complicated as it sounds. It all starts with identifying major supports and resistances. However, instead of horizontal supports and resistances, what commonly takes place are diagonal supports and resistances. To qualify as a support or resistance, price must respect the identified support or resistance twice, and confirmed by a third swing high or swing low.
The resulting support and resistance should be parallel to each other to be considered as a channel, with the resistance as the upper bounds of the channel and the support as the lower bounds of the channel.
Once the channel is identified, it would be easy to notice how price bounces up and down the price chart traveling from the support to the resistance, then back to the support, repeatedly. This becomes an orderly chart, which is somehow easier to predict.
How to Effectively Trade Channels
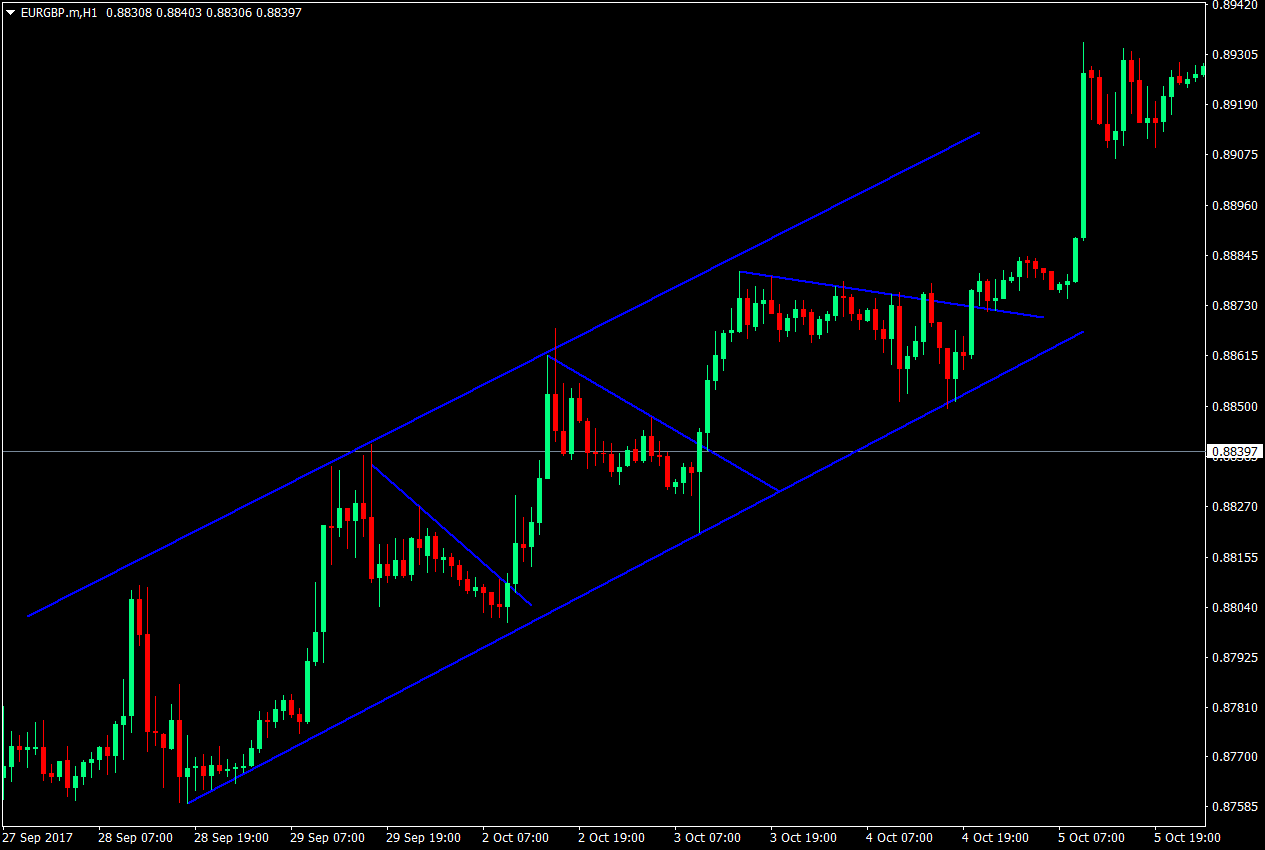
Within the channel, price would have minor diagonal supports and resistances, often forming minor patterns or even minor channels, which become more visible on the lower timeframes.
Patterns are well and good, they could serve as an additional confluence or rationale for taking the trade. However, their use ends there, an additional confidence booster for the trading setup. What is important is the support or resistance where the trade should breakout from.
To identify which direction the trade should take, we should first identify if the channel is bullish or bearish. In this case, the chart is a bullish trending channel. Since, this is a bullish trending channel, what we will be looking for are bounces off the channel’s support, and breakouts from the minor resistances. We could therefore, forego the other markings on the chart and consider only the channel, and the minor resistances for the trade setup.
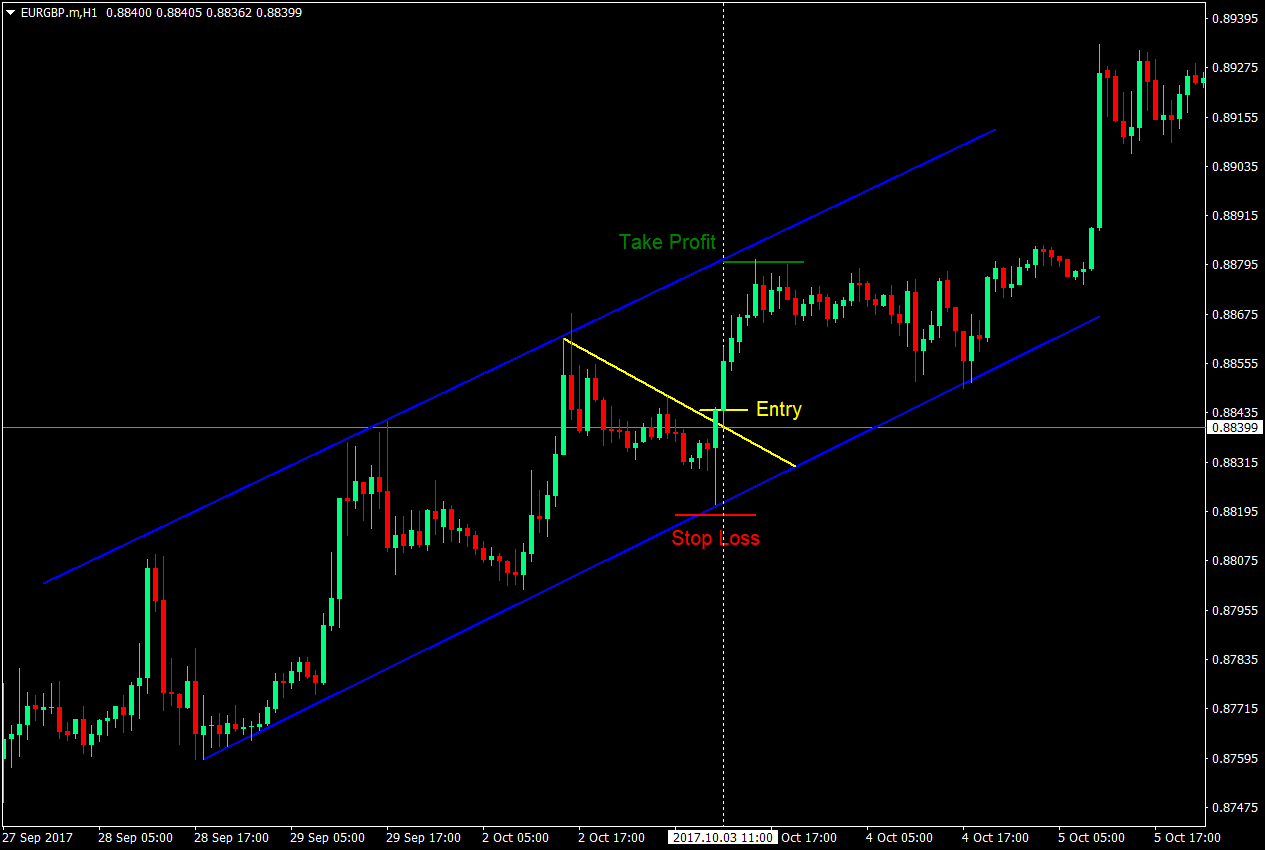
The Trade Setup: Entry, Stop Loss and Take Profit
Since this is an uptrend, what we will be analyzing is a buy setup.
Entry: To enter a trade, a breakout from the minor resistance should occur. A retest would also be a helpful confirmation of the trade as this increases the probability of a real breakout. Entries could either be a buy stop order on top of the high of the breakout candle, or a market buy order on the retest.
Stop Loss: The stop loss should be placed on the minor swing low, which is often below the channel’s support.
Take Profit: The take profit should be set at the corresponding upper end of the channel perpendicular to the entry candle. This is because it would be hard to predict where price will stop since we are using a diagonal resistance as a basis for our target. Also, there are times when price would just be near the channel’s resistance, but wouldn’t touch it.
Conclusion
Trading channels is a basic skill that many professional traders use. This might be due to how the setups become orderly, despite the chaos of the market, which increases confidence in the trading setups.
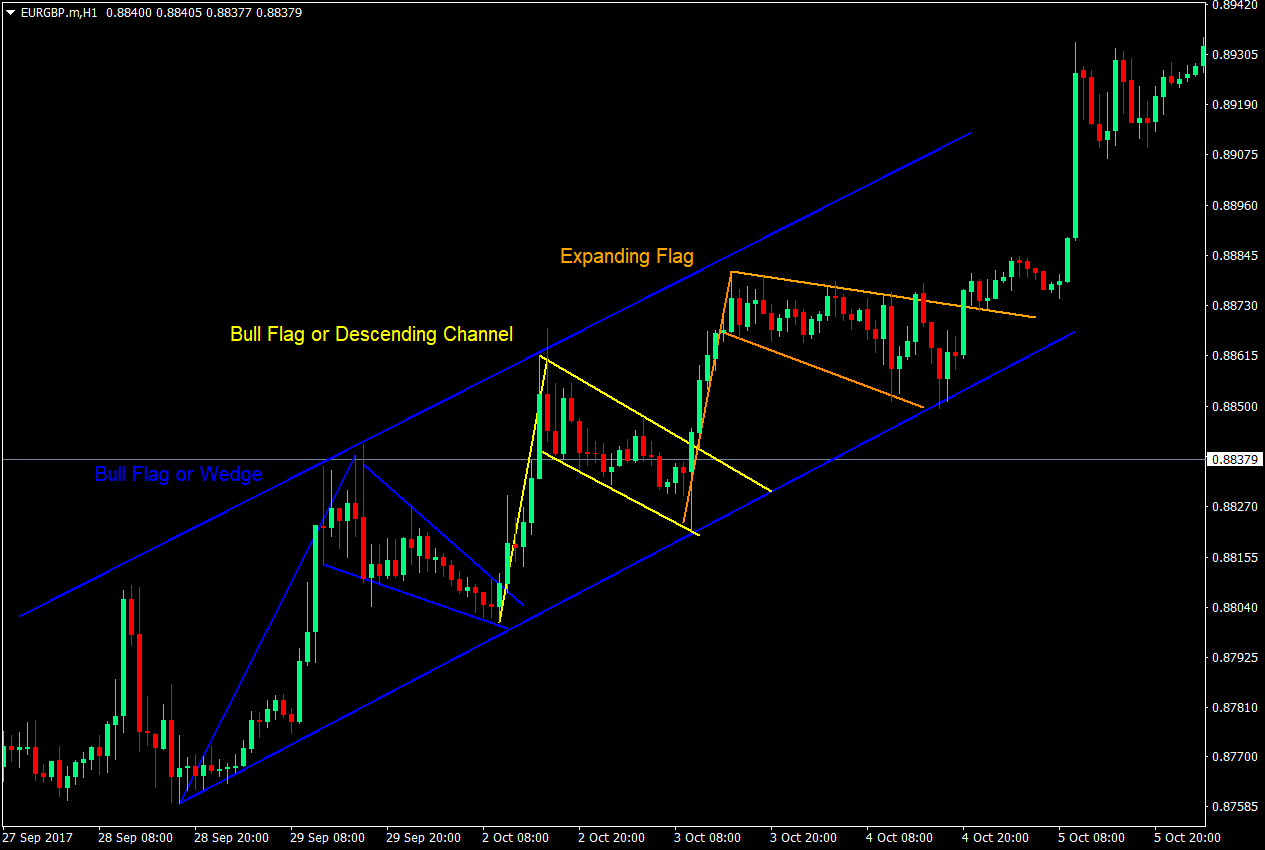
The confluence of a bullish channel, a breakout from a minor support, and often a bullish continuation chart pattern, increases the probability of a successful trade. Other indicators could also support as confluence for a channel trading setup.
However, there are times when a trade setup is formed from a contraction, instead of a retracement. Expanding flags and rectangles are often found during contractions, while bull flags, pennants, and wedges are often found on retracements. I prefer trading retracements as it is easier to predict and since breakouts are clearer.
Channel trading is not perfect. There are still some failed trades when using channel trading. However, when combined with other strategies and confluences, setups become high probability setups.