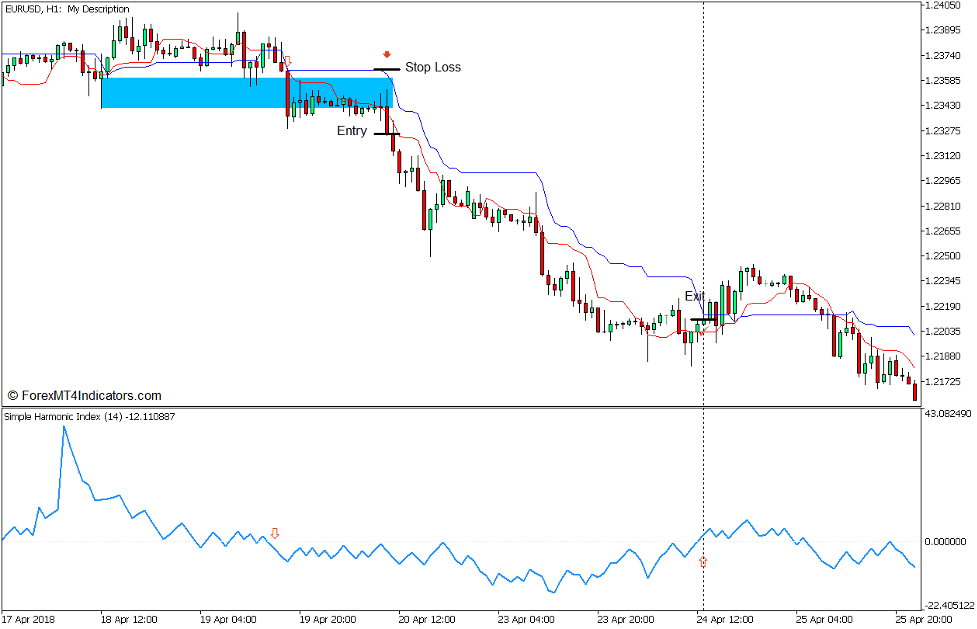
Price action is the most direct information that traders can use to identify market directions. This also includes a market reversal scenario, which is a high yielding trade scenario. However, most new traders may find it difficult to identify trend reversals based on a naked chart. Trend following indicators such as the ones discussed below may be used to help traders identify and confirm trend reversals within the context of price action in order to capitalize on trade opportunities presented by the market.
Simple Harmonic Index Indicator
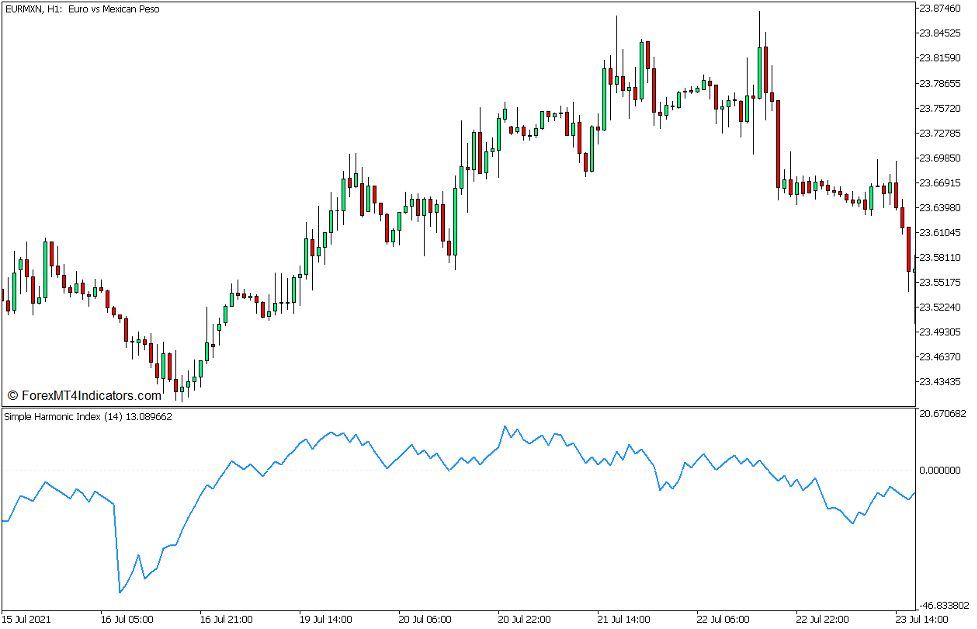
The Simple Harmonic Index (SHI) is a momentum-based technical indicator which detects the possible direction and bias of price based on recent historical price movements. The SHI has an underlying algorithm which derives the direction of momentum based on recent price data. Its algorithm can use either the open, high, low, and close of price, as well as the Median Price, which is the average of the high and low of the bar, Typical Price, which is the average of the high, low, and close, and the Weighted Price, which is the average of the open, high, low, and close of price.
The resulting value coming from the indicator’s calculations is then used to plot an oscillator line. This line oscillates around its midline, which is zero.
The direction of the market’s momentum is identified based on the oscillator line. Positive values indicate a bullish momentum, while negative values indicate a bearish momentum. As such, crossovers between the oscillator line and its marker at zero may indicate a possible trend reversal. Trending markets are confirmed whenever the SHI line is generally staying above zero in an uptrend and below zero in a downtrend.
Tenkan-sen and Kijun-sen Lines
The Ichimoku Kinko Hyo indicator is a trend following technical indicator which provides a complete overview of the market’s direction. It provides short-term and long-term trend indications using five distinctive lines, each representing a trend horizon based on average price movements.
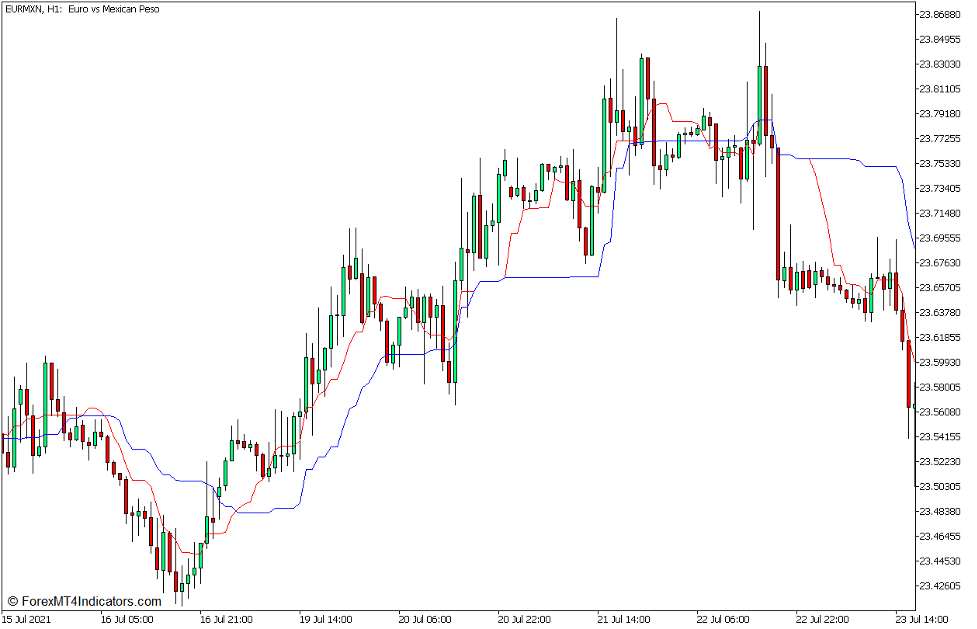
The Tenkan-sen and Kijun-sen lines are two of the fastest and most responsive average lines among the five components of the Ichimoku Kinko Hyo indicator. As such, these two lines are used to identify and detect the short-term trend direction.
The Tenkan-sen, which means Conversion Line, is the median of price over a nine bar window. The indicator’s algorithm would identify the highest high and the lowest low within the nine-bar window. It would then calculate for the median of price by adding the highest high and the lowest low, then dividing the sum by two.
The Kijun-sen, also known as the Base Line, on the other hand is the median of price over a 26-bar period. Similar to the Tenkan-sen, the indicator’s algorithm also detects the highest high and lowest low of price within the last 26-bar window. It then adds the highest high and lowest low of price, then divides the sum by two.
Between the two, the Tenkan-sen (red line) is the faster moving line relative to the Kijun-sen (blue line). The short-term trend direction is identified based on how the two lines interact with each other. Bullish trend directions are indicated by a Tenkan-sen line which is consistently above the Kijun-sen line. Inversely, bearish trends are indicated by a Tenkan-sen line which is generally below the Kijun-sen line. Given this relationship, trend reversals may also be identified based on the crossing over of the two lines.
The area between the Tenkan-sen and Kijun-sen lines may also act as a dynamic area of support or resistance in a trending market condition. Price may bounce from the area between the two lines. As such, some traders also use the Kijun-sen line as a basis for placing and trailing stop losses.
Trading Strategy Concept
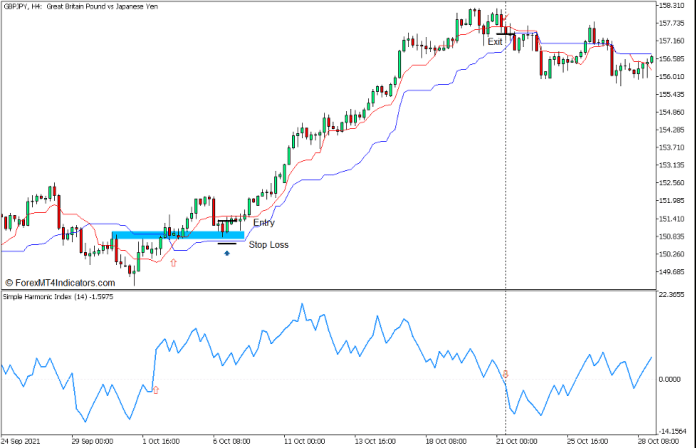
Simple Harmonic Index Reversal Forex Trading Strategy is a trend reversal trading strategy which uses the Tenkan-sen and Kijun-sen lines to identify potential trend reversals and the SHI line to confirm the trend direction.
The initial trend reversal is identified based on the crossing over of the Tenkan-sen and Kijun-sen lines. The new trend is then confirmed by the SHI line crossing over the zero midline in confluence with the direction of the Tenkan-sen and Kijun-sen reversal signal.
Aside from the two signals, price action and market flow structure are also employed to identify potential trend reversals. This is based on price breaking through support and resistance lines and pulling back to these levels and rejecting it once again. The price rejection of the area is then confirmed by an engulfing or momentum candle formation.
Buy Trade Setup
Entry
- The Tenkan-sen line should cross above the Kijun-sen line.
- Price should break above a recent swing high resistance.
- The SHI line should cross above zero.
- Price action should pull back towards the resistance area turned support which should also be in confluence with the area between the Tenkan-sen and Kijun-sen lines.
- Open a buy order as soon as a bullish engulfing pattern is formed.
Stop Loss
- Place the stop loss below the Kijun-sen line.
Exit
- Close the trade as soon as the SHI line crosses below zero.
Sell Trade Setup
Entry
- The Tenkan-sen line should cross below the Kijun-sen line.
- Price should drop below a recent swing low support.
- The SHI line should cross below zero.
- Price action should pull back towards the support area turned resistance which should also be in confluence with the area between the Tenkan-sen and Kijun-sen lines.
- Open a sell order as soon as a bearish engulfing pattern is formed.
Stop Loss
- Place the stop loss above the Kijun-sen line.
Exit
- Close the trade as soon as the SHI line crosses above zero.
Conclusion
This strategy is a simplified trend reversal trading strategy which can be used even by newer traders. It is hinged around the concept of price action breaking an opposing support or resistance line moving against the trend, then pulling back towards the area. The indicators used simply adds clarity to how the market is behaving. The visual indications of the Tenkan-sen, Kijun-sen, and SHI lines allow traders to easily spot potential trend reversals. However, these signals should be used within the context of a market reversal price action.
Recommended MT5 Brokers
XM Broker
- Free $50 To Start Trading Instantly! (Withdraw-able Profit)
- Deposit Bonus up to $5,000
- Unlimited Loyalty Program
- Award Winning Forex Broker
- Additional Exclusive Bonuses Throughout The Year
>> Sign Up for XM Broker Account here <<
FBS Broker
- Trade 100 Bonus: Free $100 to kickstart your trading journey!
- 100% Deposit Bonus: Double your deposit up to $10,000 and trade with enhanced capital.
- Leverage up to 1:3000: Maximizing potential profits with one of the highest leverage options available.
- ‘Best Customer Service Broker Asia’ Award: Recognized excellence in customer support and service.
- Seasonal Promotions: Enjoy a variety of exclusive bonuses and promotional offers all year round.
>> Sign Up for FBS Broker Account here <<
Click here below to download:


