


Trend continuation strategies provide excellent trading opportunities which often have a good balance between high-probability trades and decent risk-reward ratios. However, most new traders often find it difficult to time trade entries when trading trend continuation setups. This trading strategy provides a framework for how to trade with the trend right after a market pullback.
Adaptive Efficiency Ratio EMA
The Adaptive Efficiency Ratio EMA indicator is a trend-following technical indicator which is a modified Exponential Moving Average (EMA) derived from an Efficiency Ratio. This concept has some similarities with the Kauffman Adaptive Moving Average (KAMA) developed by Perry Kauffman.
Efficiency Ratio is a measure of volatility that can be used as a means of making some calculations more adaptive. The concept of using an Efficiency Ratio when calculating moving average lines was first introduced by Perry Kauffman when he developed the KAMA. In his version, the Efficiency Ratio is calculated using three periods which in theory should make the moving average line more adaptive to price action movements and market volatility.
The Adaptive Efficiency Ratio EMA simplifies Perry Kauffman’s approach to the use of the Efficiency Ratio. It simply applies the Efficiency Ratio to an Exponential Moving Average line which in itself is already weighted to make its line smoother and more responsive to price fluctuations. This creates a moving average line that is very responsive to price action and price reversals yet is also very smooth especially when the market is moving predictably with a clear trend direction.
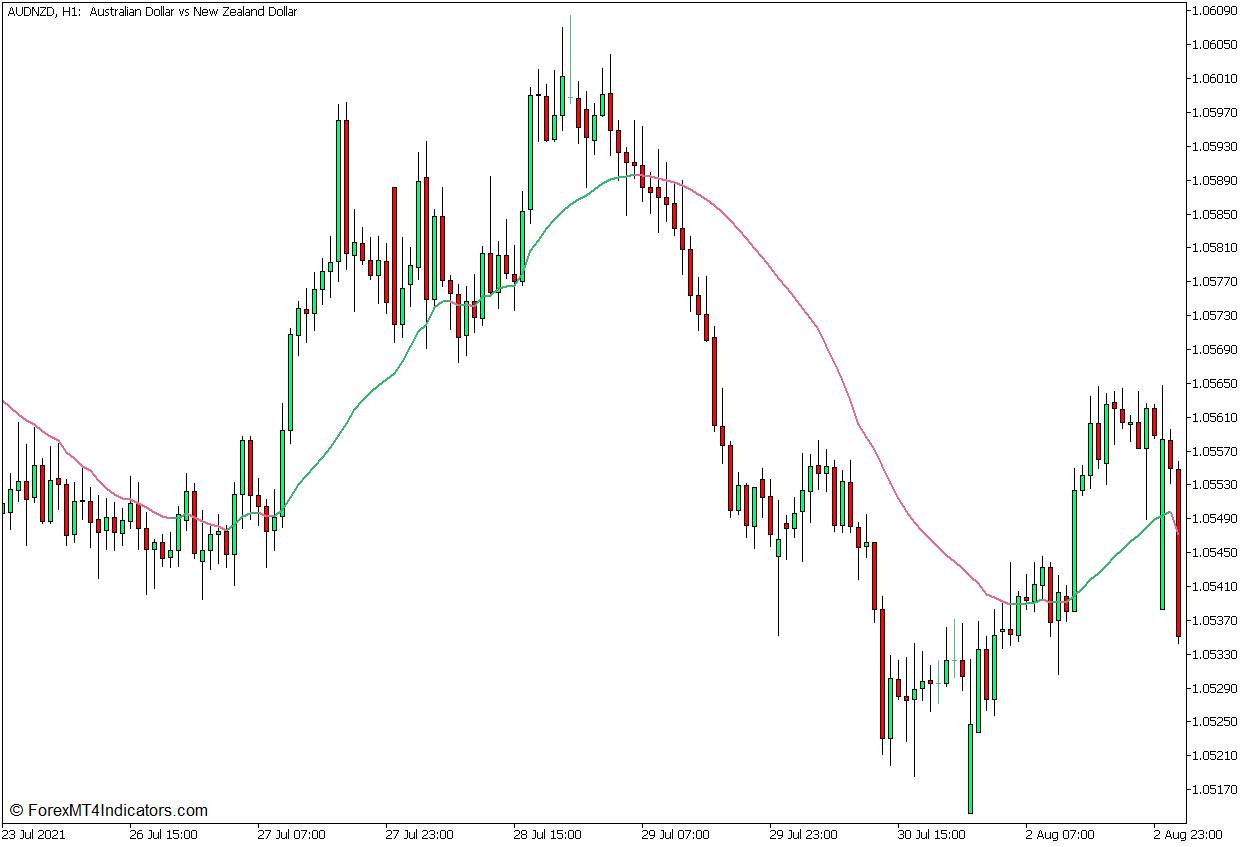
This indicator plots a moving average line that changes color depending on the direction of its slope. It plots a medium sea green line whenever its line is in an upward slope, and a pale violet red line whenever it is in a downward slope. Traders can use the color of the line as an objective means for identifying trend or momentum direction.
Relative Vigor Index
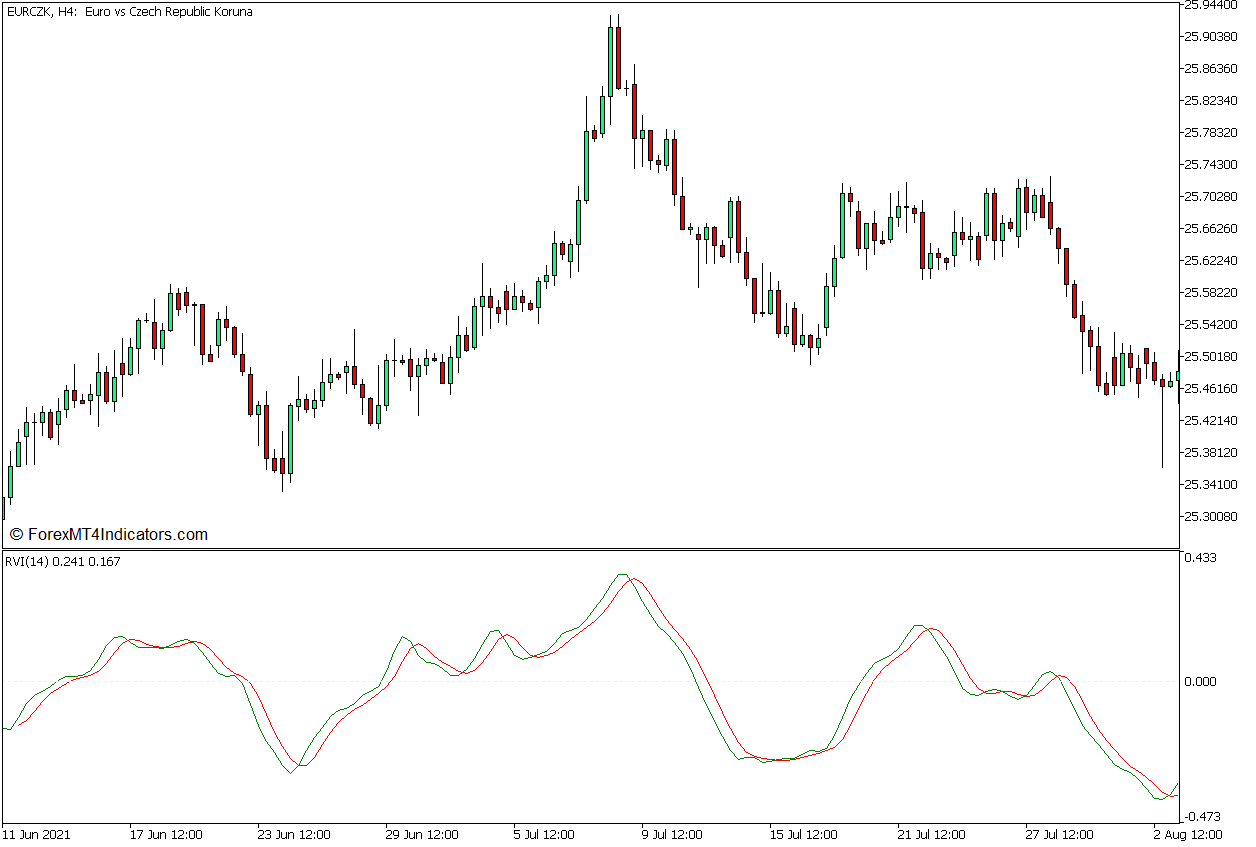
Relative Vigor Index (RVI) is a technical indicator that is primarily used to help traders objectively identify the direction of the market’s momentum. It does this by comparing the current closing price of a tradeable instrument with its corresponding price range. It then presents the resulting data as an oscillator line which traders can easily interpret to arrive at an objective assessment of momentum direction.
The RVI starts by calculating the average of the difference between the closing price and the opening price of several candles within a specific time window. It also calculates the average of the difference between the high and the low of each bar within the same period. It then divides the result of the first average calculations by the result of the second average calculations, which becomes the RVI value. These values are then plotted as data points for the RVI oscillator line. It also calculates for a Signal Line derived from the RVI values. However, instead of using a basic moving average line to calculate the Signal Line, it doubles the values for the middle periods creating a calculation that is weighted on the bars between the current bar and the first bar.
The resulting oscillator plots two lines, the main RVI line and the Signal Line. These two lines oscillate around a middle point which is zero. Traders may interpret the direction or momentum based on whether the RVI line is generally positive or negative. Positive RVI values indicate a bullish momentum, while negative RVI values indicate a bearish momentum. Traders may also interpret the direction of momentum based on how the two lines overlap. Momentum is considered bullish whenever the RVI line is above the Signal Line, and bearish whenever the RVI line is below the Signal Line.
Trading Strategy Concept
This trading strategy is a simple trend continuation strategy that trades on confirmed momentum reversals that develop after a deep market contraction or pullback which are in confluence with the direction of the trend. Traders may objectively identify this market scenario using the two technical indicators discussed above, which are the Adaptive Efficiency Ratio EMA indicator and the Relative Vigor Index oscillator.
The Adaptive Efficiency Ratio EMA indicator is mainly used as a trend direction indicator and as a dynamic support or resistance line. Traders should first confirm the direction of the trend based on the general location of price action to its line, as well as the color of the line. As soon as the trend direction is confirmed, traders may then proceed to observe for deep market pullbacks. These pullbacks should then reject the area near the Adaptive Efficiency Ratio EMA line followed by a momentum reversal.
The momentum reversal should be confirmed based on the confluence between the formation of a momentum candle and the crossing over of the RVI line and its Signal Line. This would constitute a valid trade entry signal.
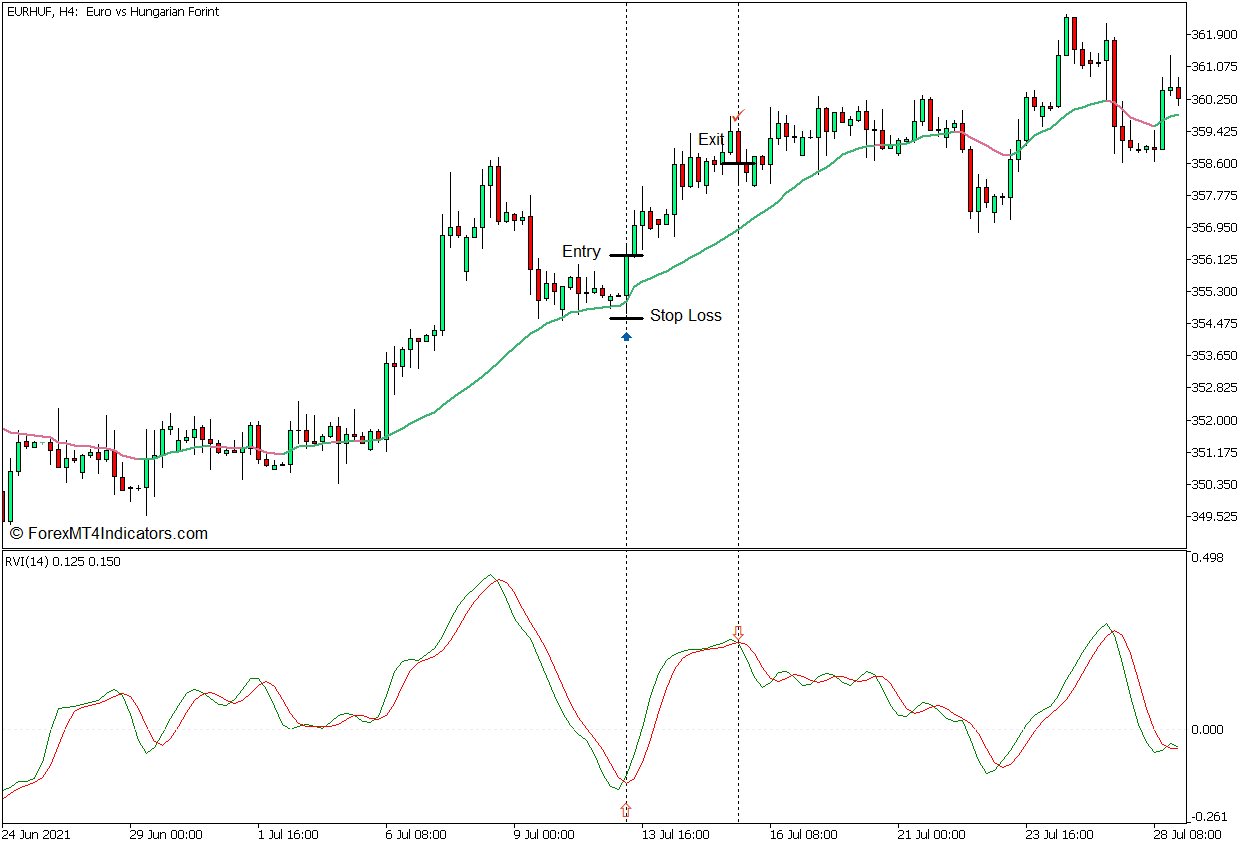
Buy Trade Setup
Entry
- Price action should be above the Adaptive Efficiency Ratio EMA line.
- The Adaptive Efficiency Ratio EMA line should be medium sea green.
- Price action should pull back towards the Adaptive Efficiency Ratio EMA line.
- Price action should show signs of price rejection in the area of the line.
- The RVI line should cross above the signal line.
- A bullish momentum candle should form.
- Open a buy order on the confluence of these signals.
Stop Loss
- Set the stop loss on the fractal below the entry candle.
Exit
- Close the trade as soon as the RVI line crosses below the signal line.
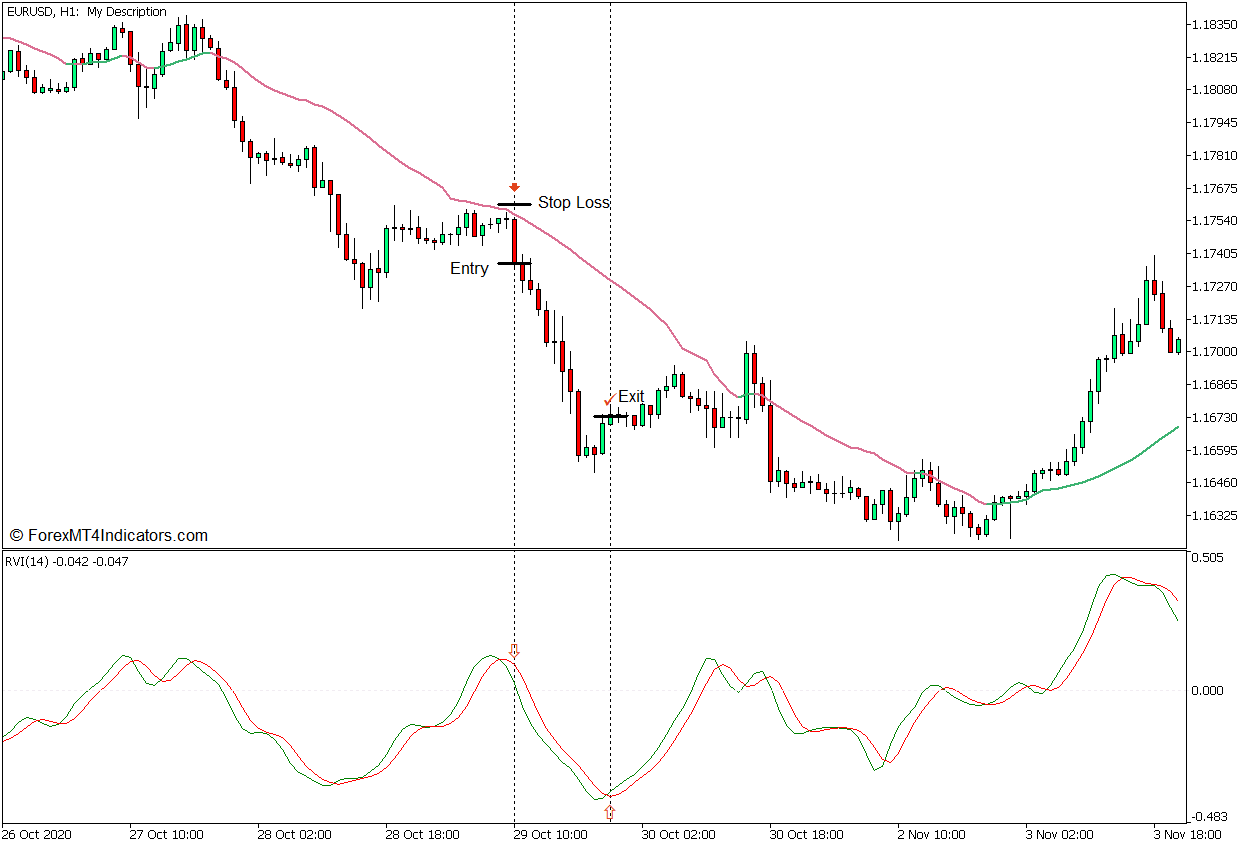
Sell Trade Setup
Entry
- Price action should be below the Adaptive Efficiency Ratio EMA line.
- The Adaptive Efficiency Ratio EMA line should be pale violet red.
- Price action should pull back towards the Adaptive Efficiency Ratio EMA line.
- Price action should show signs of price rejection in the area of the line.
- The RVI line should cross below the signal line.
- A bearish momentum candle should form.
- Open a sell order on the confluence of these signals.
Stop Loss
- Set the stop loss on the fractal above the entry candle.
Exit
- Close the trade as soon as the RVI line crosses above the signal line.
Conclusion
This trading strategy is a textbook trend continuation strategy that trades on momentum signals after a market pullback. Just as with most trend continuation strategies, this strategy must be used in the right market context. It should be traded only when the market is trending and is still not at the tail end of the trend.
Recommended MT5 Brokers
XM Broker
- Free $50 To Start Trading Instantly! (Withdraw-able Profit)
- Deposit Bonus up to $5,000
- Unlimited Loyalty Program
- Award Winning Forex Broker
- Additional Exclusive Bonuses Throughout The Year

>> Sign Up for XM Broker Account here <<
FBS Broker
- Trade 100 Bonus: Free $100 to kickstart your trading journey!
- 100% Deposit Bonus: Double your deposit up to $10,000 and trade with enhanced capital.
- Leverage up to 1:3000: Maximizing potential profits with one of the highest leverage options available.
- ‘Best Customer Service Broker Asia’ Award: Recognized excellence in customer support and service.
- Seasonal Promotions: Enjoy a variety of exclusive bonuses and promotional offers all year round.

>> Sign Up for FBS Broker Account here <<
Click here below to download: