


The key to finding a high-probability trade setup is to find confluences. Particularly confluences between a long-term trend direction and a short-term mean reversal signal tend to produce high-probability trade setups. Let us see how we can spot such trading opportunities using a confluence of three technical indicators.
Recursive Median Oscillator with Floating Levels
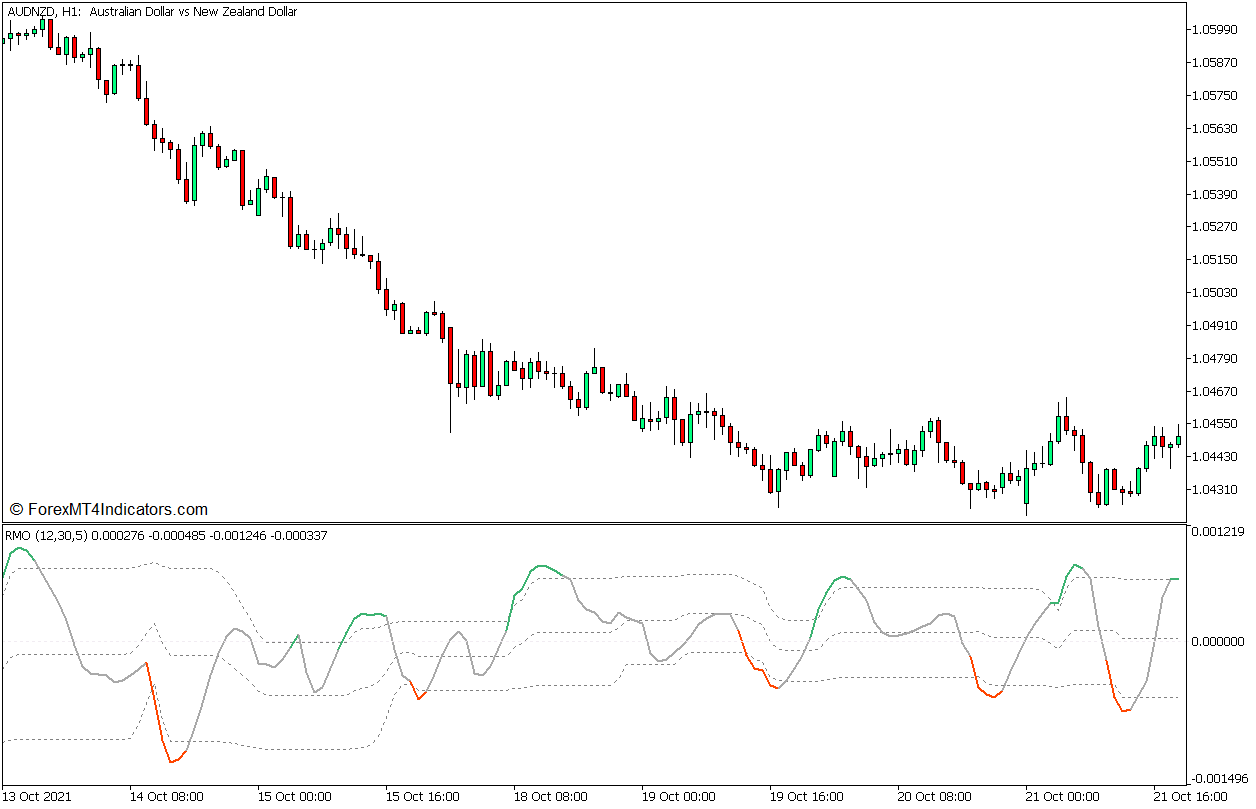
The Recursive Median Oscillator (RMO) is a momentum-based technical indicator that is based on John Ehler’s theory, “Recursive Median Filters”, discussed in the March 2018 issue of TASC. In this theory, he explained that by filtering out extreme price movements and volume data, we can avoid extrapolating data that skews the typical average calculations of a technical indicator. He then continued on to present a unique oscillator that exemplifies this idea and compares it to the RSI. The oscillator characteristically showed a smoothened oscillator line with minimal market noise and lag.
John Ehler’s version of the oscillator is one that presents reversal signals as the indicator value crosses its midline, which is zero. This version however uses the concept of Floating Levels. This allows the indicator to detect possible mean reversal signals based on various settings, making it more responsive to price action. It may be set to detect reversal signals at the change in direction coming from oversold and overbought levels, at the change of the slope of its oscillator line, or at the crossover of its value with its midline (zero).
This version of the Recursive Median Oscillator plots a medium-sea green line whenever it detects an overbought market, and an orange-red line whenever it detects an oversold market. Traders may use the reversion of its color back to gray as an indication of a mean reversal signal.
Bollinger Bands
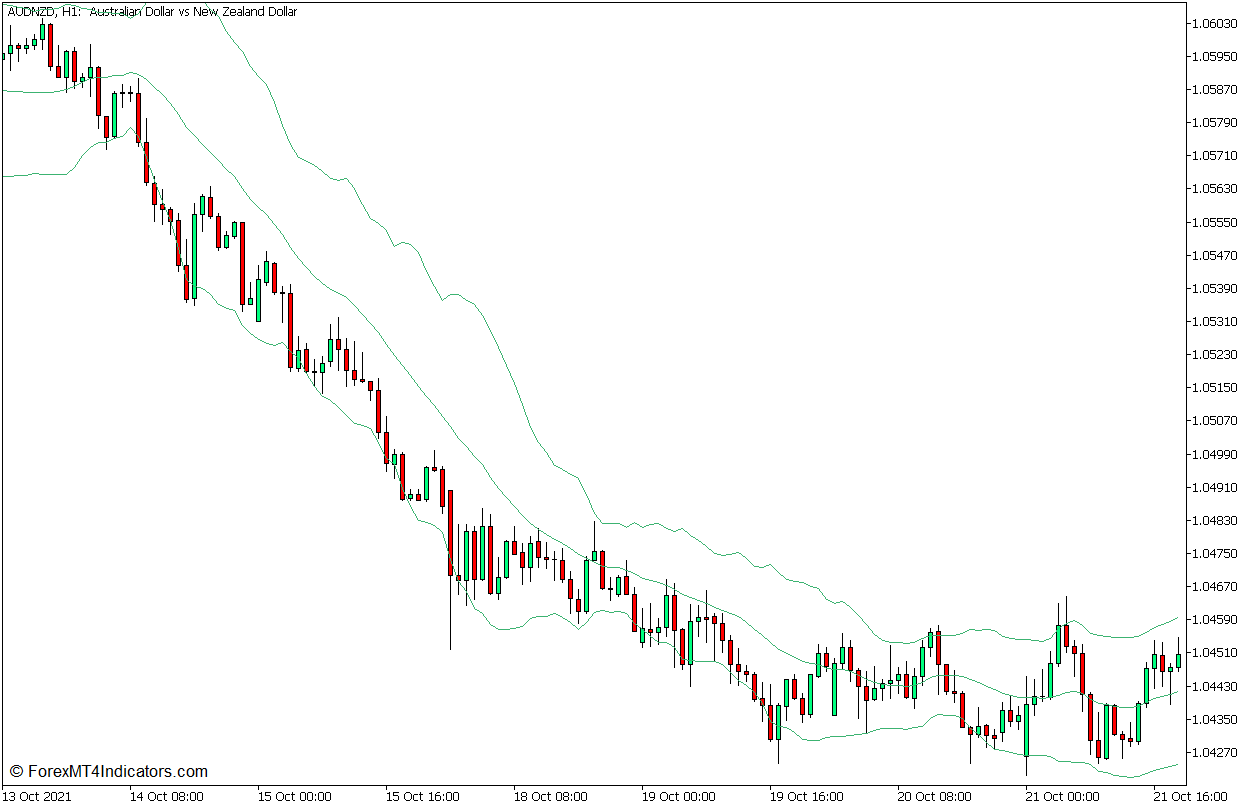
The Bollinger Bands is a momentum indicator developed by John Bollinger, which can be used to detect trend direction, volatility, momentum, as well as oversold and overbought market levels. It does this using a set of three lines forming a channel-like structure.
The three lines of the Bollinger Bands are composed of its middle line and two outer lines which flank the middle line above and below it. The middle line is basically a 20-bar Simple Moving Average (SMA), while the outer lines are standard deviations derived from price action shifted above and below the middle line usually set at 2 standard deviations.
Traders may observe trend direction based on the general location of price action in relation to the middle line, whether price action is usually on the lower or upper half of the channel.
Volatility can also be observed based on the contraction and expansion of the bands. The bands contract during low-volatility markets and expand when volatility is high.
The outer lines can also be used to detect oversold and overbought markets as these lines represent the threshold of the normal price range based on the market’s volatility. Price action showing reversal signals in these areas may indicate a probable mean reversal scenario.
200 Exponential Moving Average
Moving average lines are typically used to indicate trend direction. Oftentimes, traders would use moving average lines to filter trade opportunities based on trend direction or bias.
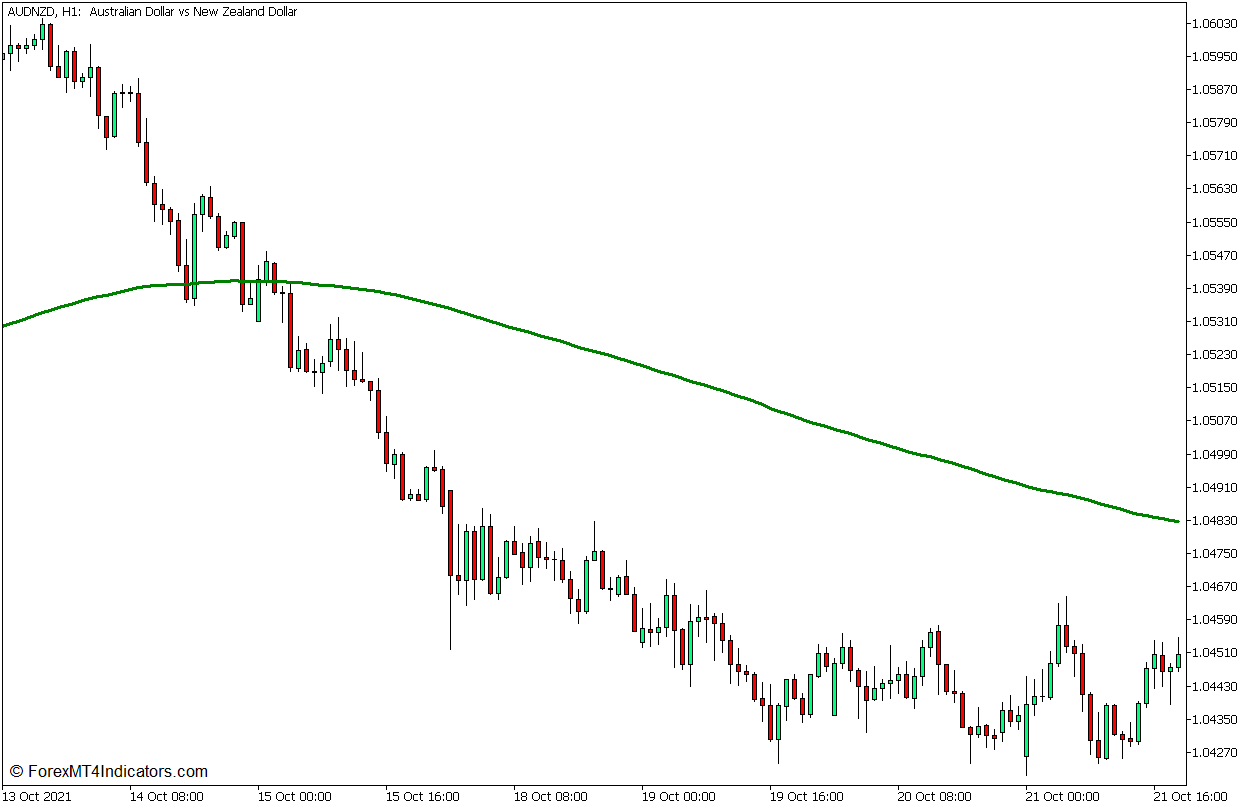
The 200-bar moving average line is widely accepted as the standard when it comes to identifying the long-term trend direction. Traders typically use this period count setting to set up their long-term moving average line.
The Exponential Moving Average (EMA) method on the other hand is a very responsive type of moving average line. It plots a moving average line that emphasizes recent price data, which allows it to plot a moving average line with less lag.
Given the moving average parameters described above, a 200 EMA line would be an excellent long-term moving average line that can provide a reliable and responsive indication of the trend direction.
Trading Strategy Concept
This trading strategy is a trend continuation strategy that provides trade entry signals based on a confluence of mean reversal signals to develop in the short term. To do this, we would be using the 200 EMA line, the Recursive Median Oscillator, and the Bollinger Bands.
The 200 EMA line is used as the long-term trend direction filter. The trend direction is based on the general location of price action in relation to the 200 EMA line, as well as the slope of the 200 EMA line.
As soon as the long-term trend direction is identified, we can then look for trade opportunities based on mean reversal signals coming from overbought or oversold market conditions in the short term. This is identified based on the confluence of oversold or overbought signals coming from the Recursive Median Oscillator and the Bollinger Bands.
The trade entry signal itself is based on the reversion of the Recursive Median Oscillator back within its normal range, which is accompanied by the change of its line color back to gray.
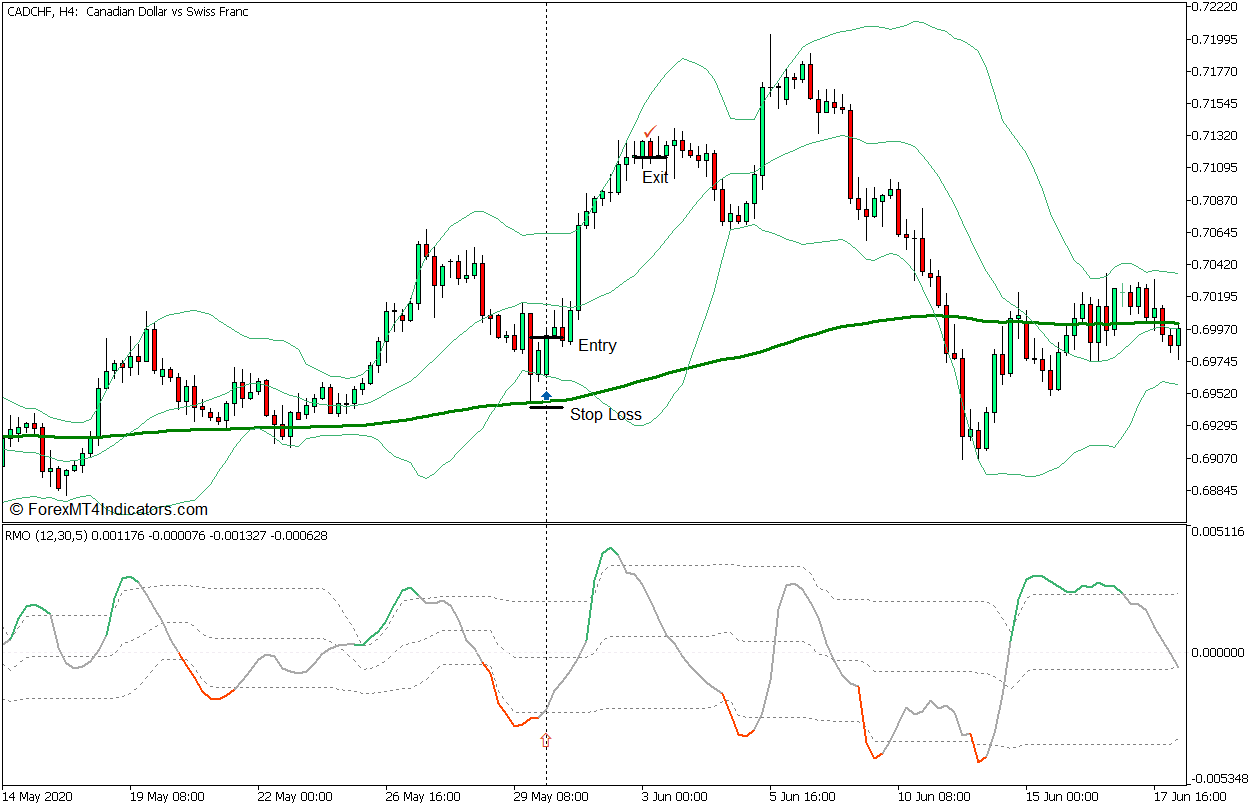
Buy Trade Setup
Entry
- Price action should be above the 200 EMA line, while the 200 EMA line slopes up.
- Price action should pull back below the lower line of the Bollinger Bands, causing the RMO line to temporarily change to orange-red.
- Open a buy order as soon as the RMO line reverts back to gray.
Stop Loss
- Set the stop loss on the fractal below the entry candle.
Exit
- Close the trade as soon as price action shows signs of a bearish reversal.
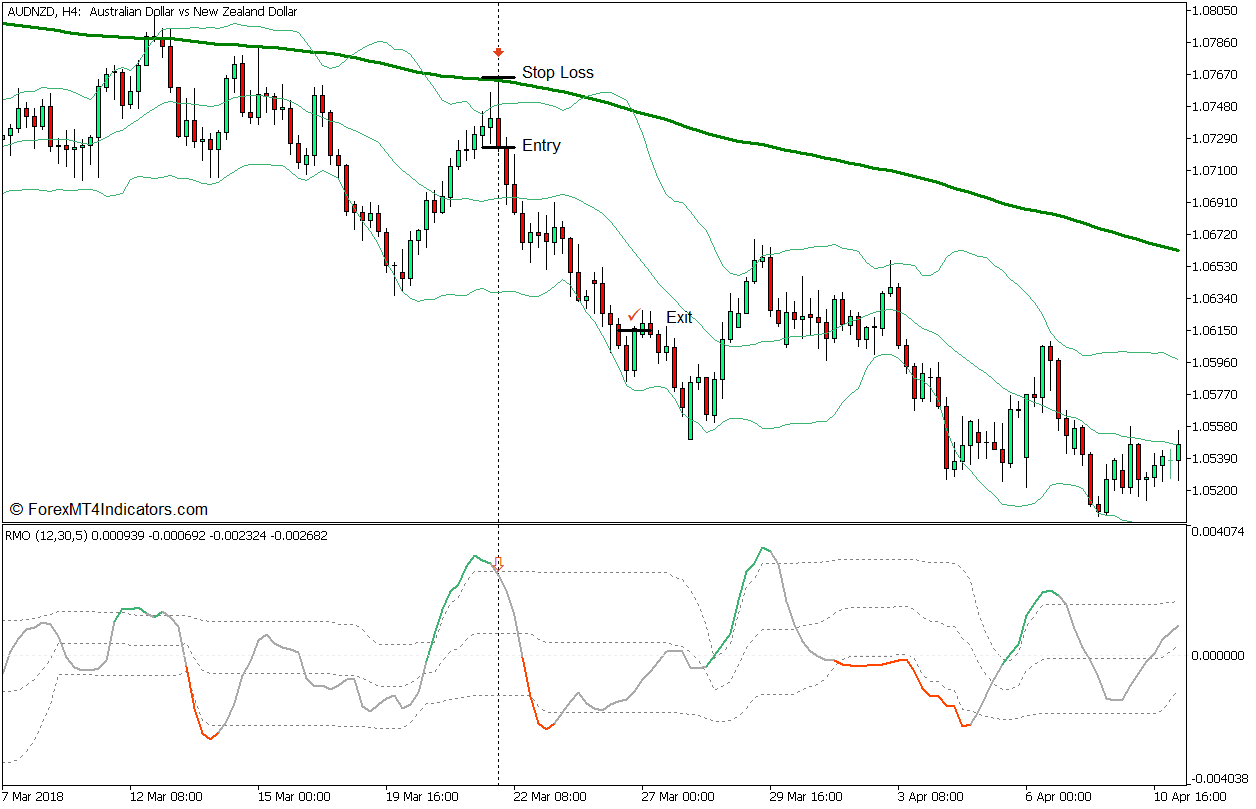
Sell Trade Setup
Entry
- Price action should be below the 200 EMA line, while the 200 EMA line slopes down.
- Price action should pull back above the upper line of the Bollinger Bands, causing the RMO line to temporarily change to medium sea green.
- Open a sell order as soon as the RMO line reverts back to gray.
Stop Loss
- Set the stop loss on the fractal above the entry candle.
Exit
- Close the trade as soon as price action shows signs of a bullish reversal.
Conclusion
This trading strategy may provide traders with high-probability trend continuation setups if used in the right market context. This is because the mean reversal signals provided by the RMO and Bollinger Bands typically form as pullbacks on markets that are trending on the higher timeframes. As such, it is best to observe first the higher timeframe trend before applying this strategy on a lower timeframe.
Recommended MT5 Brokers
XM Broker
- Free $50 To Start Trading Instantly! (Withdraw-able Profit)
- Deposit Bonus up to $5,000
- Unlimited Loyalty Program
- Award Winning Forex Broker
- Additional Exclusive Bonuses Throughout The Year

>> Sign Up for XM Broker Account here <<
FBS Broker
- Trade 100 Bonus: Free $100 to kickstart your trading journey!
- 100% Deposit Bonus: Double your deposit up to $10,000 and trade with enhanced capital.
- Leverage up to 1:3000: Maximizing potential profits with one of the highest leverage options available.
- ‘Best Customer Service Broker Asia’ Award: Recognized excellence in customer support and service.
- Seasonal Promotions: Enjoy a variety of exclusive bonuses and promotional offers all year round.

>> Sign Up for FBS Broker Account here <<
Click here below to download: