Many new traders are often misled by the idea that trading is complex and difficult. This causes them to believe that trading strategies should also be complex. Trading strategies that are simple and straight forward are often scrapped. Traders who come across a simple trading strategy that works would often fiddle with the strategy to make it more complex turning the strategy into a difficult and unimplementable trading plan.
However, contrary to popular belief, there are many simple trading strategies that do work. These strategies need only a few rules to apply and could easily be repeated when the right market condition presents itself. Simple strategies could easily work well for many traders because it is easily implementable, and traders can easily spot opportunities without too much filtering. This allows the law of large numbers and probabilities to work.
One of the ways traders implement a simple trading strategy is by using reliable and effective technical indicators. Technical indicators allow traders to objectively identify high probability trade setups without second guessing themselves. Traders could easily decide whether a trade is viable or not based on a set or rules using technical indicators.
QQE Heiken Ashi Forex Trading Strategy makes use of two highly reliable and effective technical indicators. It identifies trends and specific entry points using technical indicators.
Qualitative Quantitative Estimation
Qualitative Quantitative Estimation (QQE) is a very effective and reliable technical indicator. In fact, it is one of the few indicators that has been proven overtime to work effectively even as a standalone indicator. Many traders even see it as the “Holy Grail” of technical indicators.
QQE is an oscillator type of technical indicator. It plots two lines that oscillate within the range of 0 to 100. The main QQE line is a solid blue line. This line moves characteristically resembling the movement of the Relative Strength Index (RSI). It also follows and mimics price action quite accurately. However, unlike the RSI, which is very jagged and erratic, the QQE line is smoothened giving it a more subtle characteristic. This smoothened characteristic makes the QQE line less susceptible to price spikes and erratic price movements. The second line is dotted line, which is the signal line. This line is derived from the movements of the main QQE line.
Traders often use the midline, which is 50, as the basis for the directional bias of the market. If the lines are above 50, then the market has a bullish bias. If the lines are below 50, then the market has a bearish bias.
Crossovers between the main QQE line and the dotted signal line are the main trend reversal signals. If the solid line crosses above the dotted line, the trend or momentum is reversing up. If the solid line crosses below the dotted line, the trend or momentum is reversing down.
HAMA
HAMA basically stands for Heiken Ashi Moving Average. This is another name coined for the Heiken Ashi Smoothed indicator.
Heiken Ashi is literally translated to average bars in Japanese. The regular Heiken Ashi Candlesticks reflect this literally. This is because Heiken Ashi Candlesticks are basically candlesticks that have been averaged out in order to allow traders to more easily identify the short-term trend or momentum.
HAMA on the other hand is a bit different. It is less of a candlestick and more of a moving average. In fact, it resembles the Exponential Moving Average (EMA) quite closely.
HAMA plots bars that move like moving averages. These bars shadow the movement of price action quite closely. However, the bars only change color when the has changed. Royal blue bars indicate a bullish trend, while red bars indicate a bearish trend. The bars also expand whenever the trend is picking up strength and contracts whenever the trend is weakening.
Trading Strategy
This trading strategy is a simple trend following strategy which makes use of the indicators mentioned above to identify both trend direction and exact entry points.
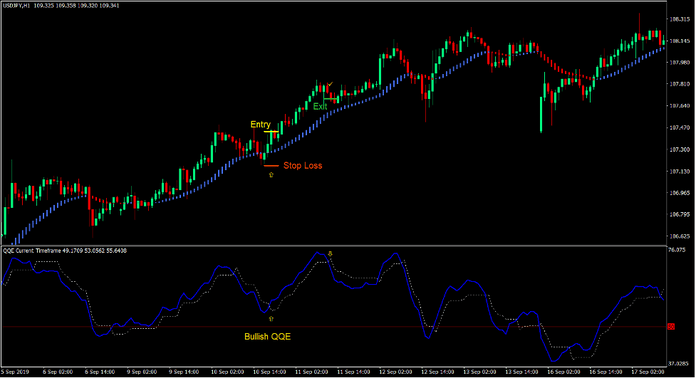
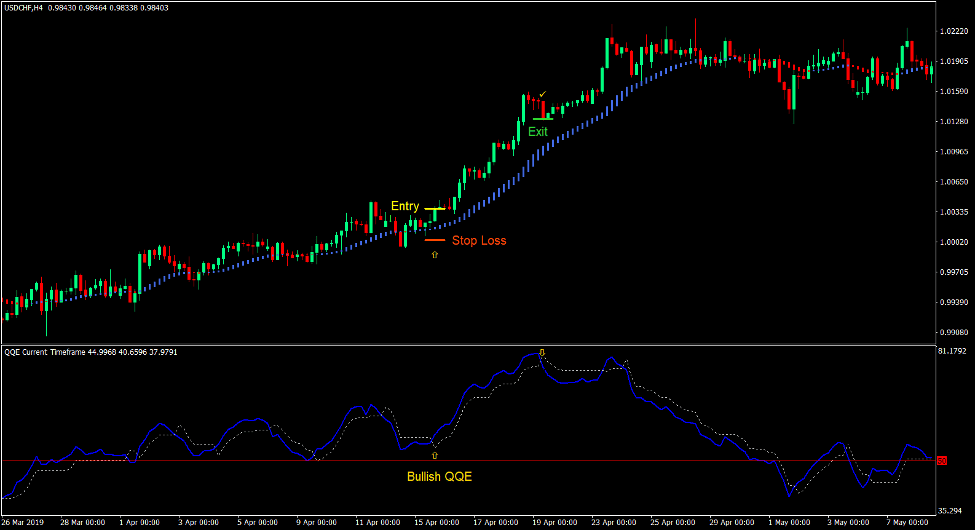
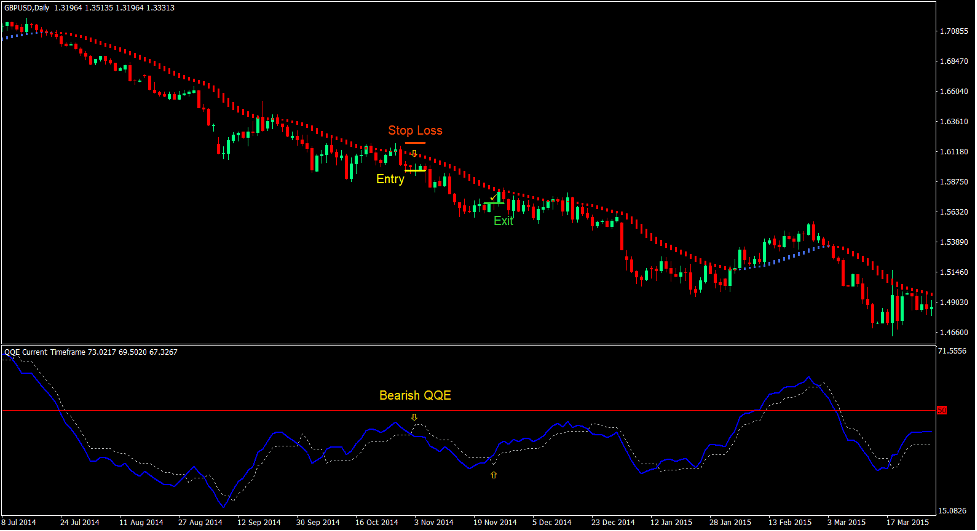
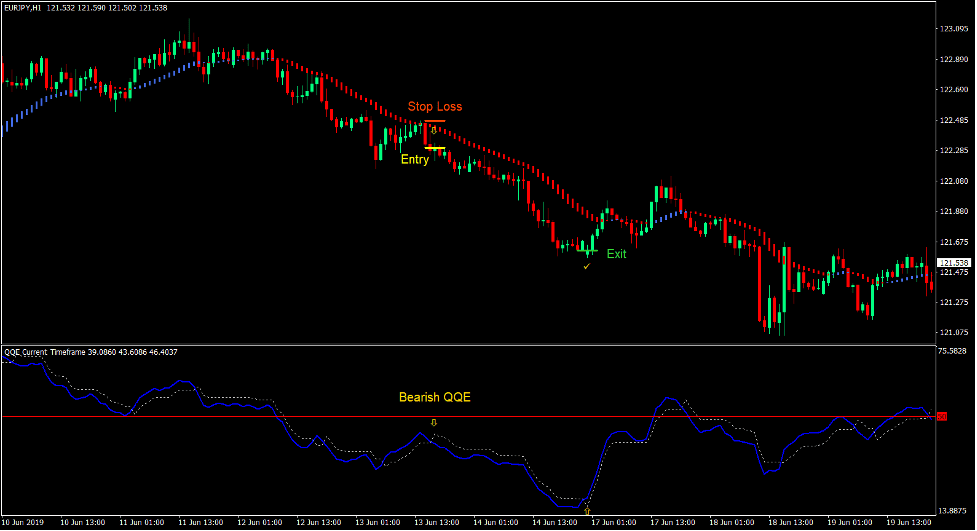
First, we identify the trend based on the HAMA indicator. This will be based on the color of the HAMA bars as well as the behavior of price action as it touches the HAMA bars. Price would tend to bounce off the HAMA bars during a trending market condition.
On the QQE window, the QQE lines should generally stay above 50 during a bullish trend or below 50 during a bearish trend.
As soon as we identify the trend, we wait for the specific entry points. Price should retrace towards the HAMA bars. This should also cause the QQE lines to temporarily reverse. Then, as soon as price touches the HAMA bars, price action should show signs of price rejection of that area. As price action bounces off the HAMA bars, the QQE lines should crossover indicating the resumption of the trend.
Indicators:
- HAMA_
- QQE
Preferred Time Frames: 1-hour, 4-hour and daily charts
Currency Pairs: FX majors, minors and crosses
Trading Sessions: Tokyo, London and New York sessions
Buy Trade Setup
Entry
- The HAMA bars should be royal blue.
- The QQE lines should generally be above 50.
- Price action should retrace towards the HAMA bars.
- The QQE lines should temporarily reverse.
- Price action should bounce off the HAMA bars.
- The solid QQE line should cross above the dotted QQE line.
- Enter a buy order on the confirmation of these conditions.
Stop Loss
- Set the stop loss on the support below the entry candle.
Exit
- Close the trade as soon as the solid QQE line crosses below the dotted QQE line.
Sell Trade Setup
Entry
- The HAMA bars should be red.
- The QQE lines should generally be below 50.
- Price action should retrace towards the HAMA bars.
- The QQE lines should temporarily reverse.
- Price action should bounce off the HAMA bars.
- The solid QQE line should cross below the dotted QQE line.
- Enter a sell order on the confirmation of these conditions.
Stop Loss
- Set the stop loss on the resistance above the entry candle.
Exit
- Close the trade as soon as the solid QQE line crosses above the dotted QQE line.
Conclusion
This trading strategy is a high probability trading strategy which makes use of highly reliable technical indicators.
Price action would usually tend to bounce off the HAMA bars during a trending market. The QQE crossover only serves as an entry trigger to help traders identify the exact entry points.
When used in the right trending market, this strategy could make wonders.
Recommended MT4 Brokers
XM Broker
- Free $50 To Start Trading Instantly! (Withdraw-able Profit)
- Deposit Bonus up to $5,000
- Unlimited Loyalty Program
- Award Winning Forex Broker
- Additional Exclusive Bonuses Throughout The Year
>> Sign Up for XM Broker Account here <<
FBS Broker
- Trade 100 Bonus: Free $100 to kickstart your trading journey!
- 100% Deposit Bonus: Double your deposit up to $10,000 and trade with enhanced capital.
- Leverage up to 1:3000: Maximizing potential profits with one of the highest leverage options available.
- ‘Best Customer Service Broker Asia’ Award: Recognized excellence in customer support and service.
- Seasonal Promotions: Enjoy a variety of exclusive bonuses and promotional offers all year round.
>> Sign Up for FBS Broker Account here <<
Click here below to download:


