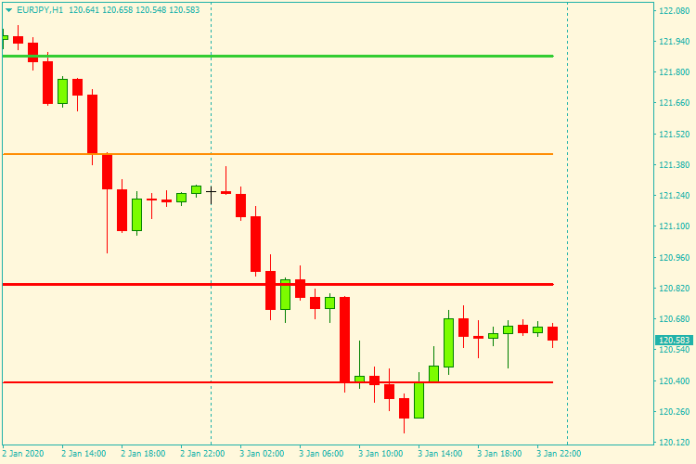
In the realm of technical analysis, pivot points act as a compass, guiding traders toward potential support and resistance zones. These levels are derived from mathematical calculations based on the previous trading period’s high (H), low (L), and closing (C) prices. Imagine a seesaw; pivot points represent the fulcrum, with prices likely to gravitate towards them or bounce off in the opposite direction.
Demystifying Pivot Point Calculations
The world of pivot points isn’t just about lines on a chart; it’s underpinned by specific formulas. Here, we’ll unveil the most common pivot point calculation methods:
The Classical Pivot Point Formula: This is the foundation, using the following formula:
- Pivot Point (PP) = (H + L + C) / 3
Once you have the pivot point, you can calculate support and resistance levels based on the following multipliers of the previous day’s range (R, calculated as H – L):
- Support 1 (S1) = PP – (R * 0.33)
- Support 2 (S2) = PP – (R * 0.66)
- Support 3 (S3) = PP – (R * 1)
- Resistance 1 (R1) = PP + (R * 0.33)
- Resistance 2 (R2) = PP + (R * 0.66)
- Resistance 3 (R3) = PP + (R * 1)
Camarilla Pivots: A More Refined Approach
Camarilla pivots offer a more intricate calculation, incorporating additional reversal points beyond the classical levels. While the specifics are more involved, these additional points can potentially provide more nuanced insights into potential price action.
Woodie Pivots: Simplifying The Calculation
Woodie pivots streamline the calculation process, focusing on the median price (M) of the previous day’s range:
M = (H + L) / 2
Support and resistance levels are then calculated as multiples of this median price.
Unveiling The Fibonacci Pivot Point Method
Fibonacci ratios are woven into the fabric of financial markets, and pivot point calculations are no exception. This method leverages Fibonacci retracements of the previous day’s range to generate support and resistance levels.
Cpr Pivots: A Volatility-Based Technique
CPR (Average True Range) pivots factor in market volatility by incorporating the Average True Range (ATR) indicator into the calculation. This can be particularly useful in volatile market conditions.
Advanced Pivot Point Techniques for Experienced Traders
As you gain experience with pivot points, you can delve deeper and explore some advanced techniques:
Fibonacci Expansions and Pivot Points for Price Targets
Fibonacci expansions can be used in conjunction with pivot points to identify potential price targets. By extending Fibonacci ratios from pivot point breakouts, you can estimate where the price might reach in its directional move.
Leveraging Pivot Points with Renko Charts
Renko charts focus on price movement rather than time. When combined with pivot points, they can offer a unique perspective on potential support and resistance zones, particularly suited for identifying short-term trading opportunities.
Limitations and Considerations of Pivot Points
While pivot points are undoubtedly valuable tools, it’s crucial to acknowledge their limitations:
Pivot Points are Not Predictive
They don’t predict the future; they simply indicate areas of potential support and resistance. Price action can still deviate from these levels, so confirmation from other indicators is essential.
False Breakouts and Market Noise
Markets are inherently noisy, and false breakouts of support and resistance levels can occur. Don’t chase every price movement that touches a pivot point level.
The Importance of Combining Pivot Points With Other Strategies
Never rely solely on pivot points. Integrate them with other technical indicators, fundamental analysis, and sound risk management practices for a well-rounded trading approach.
How to Trade with Pivots Indicator
Buy Entry
- Entry: Price bounces off a support level (S1, S2, or S3) with a bullish candlestick pattern (e.g., hammer, bullish engulfing).
- Stop-Loss: Place below the support level used for entry.
- Take-Profit: Target the nearest resistance level (R1, R2, or R3) or use a trailing stop-loss to capture potential trends.
Sell Entry
- Entry: Price rejects a resistance level (R1, R2, or R3) with a bearish candlestick pattern (e.g., shooting star, bearish engulfing).
- Stop-Loss: Place above the resistance level used for entry.
- Take-Profit: Target the nearest support level (S1, S2, or S3) or use a trailing stop-loss to capture potential trends.
Conclusion
Always combine them with sound risk management practices, confirmation from other technical indicators, and a healthy dose of market awareness. As you embark on your trading journey, leverage the insights gleaned from pivot points, continuously learn and adapt, and unlock the full potential of the MT4 platform!
Recommended MT4/MT5 Brokers
XM Broker
- Free $50 To Start Trading Instantly! (Withdraw-able Profit)
- Deposit Bonus up to $5,000
- Unlimited Loyalty Program
- Award Winning Forex Broker
- Additional Exclusive Bonuses Throughout The Year
>> Sign Up for XM Broker Account here <<
FBS Broker
- Trade 100 Bonus: Free $100 to kickstart your trading journey!
- 100% Deposit Bonus: Double your deposit up to $10,000 and trade with enhanced capital.
- Leverage up to 1:3000: Maximizing potential profits with one of the highest leverage options available.
- ‘Best Customer Service Broker Asia’ Award: Recognized excellence in customer support and service.
- Seasonal Promotions: Enjoy a variety of exclusive bonuses and promotional offers all year round.
>> Sign Up for FBS Broker Account here <<
(Free MT4 Indicators Download)
Click here below to download:


