


Divergences are conditions wherein an oscillator’s peaks and dips would deviate from the intensity of the price swings of price action. These conditions are telltale signs of a possibly strong reversal price swing which can be excellent trading opportunities. However, it is often difficult to identify valid divergences because most traders have no objective method for identifying valid price swings. This strategy shows us how we can objectively spot divergences using a couple of technical indicators.
Moving Average of Oscillator
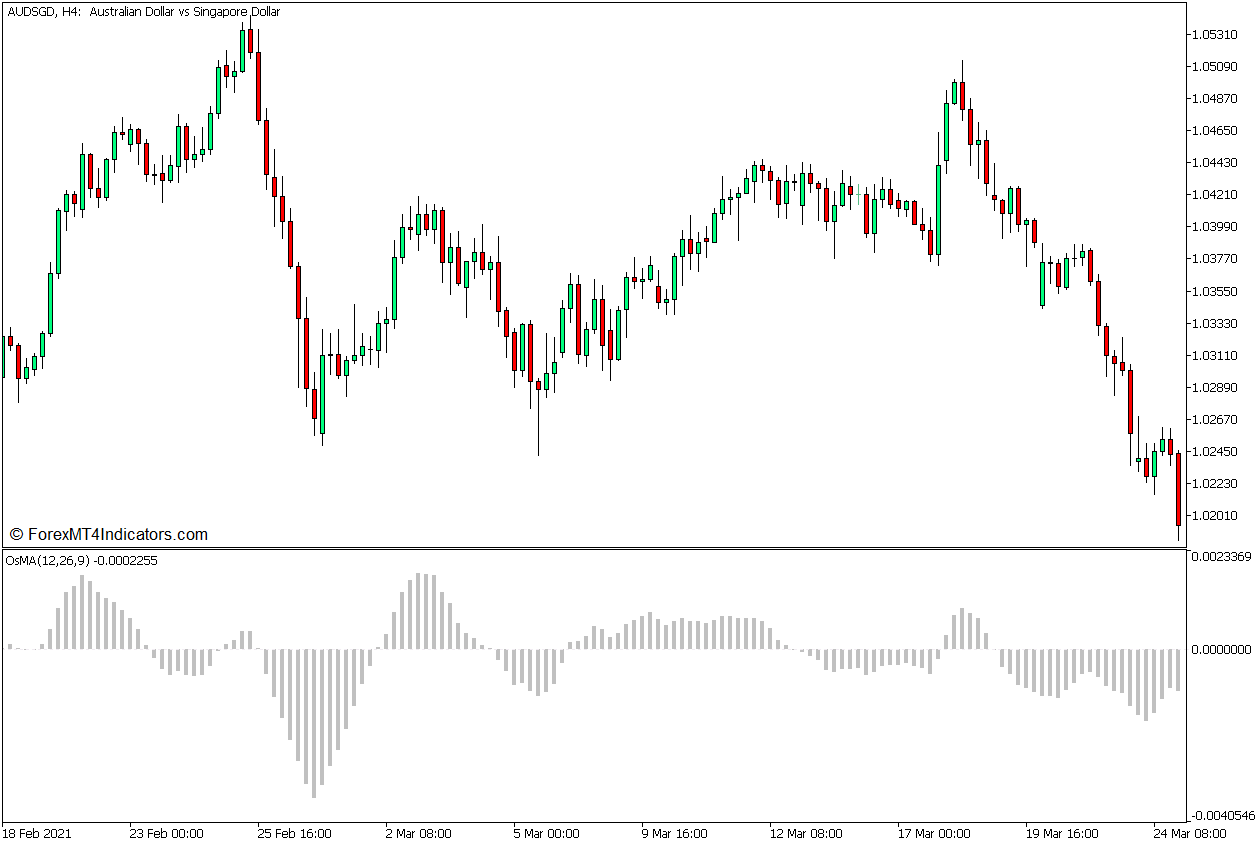
The Moving Average of an Oscillator, also known as the Oscillator of a Moving Average (OsMA), is a technical indicator that indicates the direction of the momentum of price based on the difference between an oscillator value and its corresponding moving average line.
The MACD or Moving Average Convergence and Divergence indicator is the most commonly used oscillator format for calculating the OsMA. Using this indicator as an example, the OsMA indicator would calculate for an underlying MACD value, which is the difference between two Exponential Moving Average (EMA) lines. It would then calculate for a moving average of the MACD values. The OsMA indicator would then calculate for the difference between the MACD values and its corresponding moving average line. These values are then used to plot the OsMA histogram bars.
The OsMA indicator is a very versatile technical indicator. It is often used to identify momentum direction. Traders may objectively identify the direction of the market’s momentum based on whether the OsMA bars are positive or negative. Positive bars indicate a bullish momentum, while negative bars indicate a bearish momentum.
It can also be used as a basis for identifying mean reversals. Traders may observe oversold and overbought markets based on histogram bars that are far extended away from zero. These scenarios are prime conditions for mean reversals. Traders may observe the mean reversal based on the histogram bars starting to revert back to zero and may swing to the opposite extreme.
As an oscillator, the OsMA can also identify possible market reversals based on divergences. Traders may compare the oscillations between price action and the OsMA histogram bars to spot divergences, which indicates a possible market reversal.
Zigzag 2 R Color
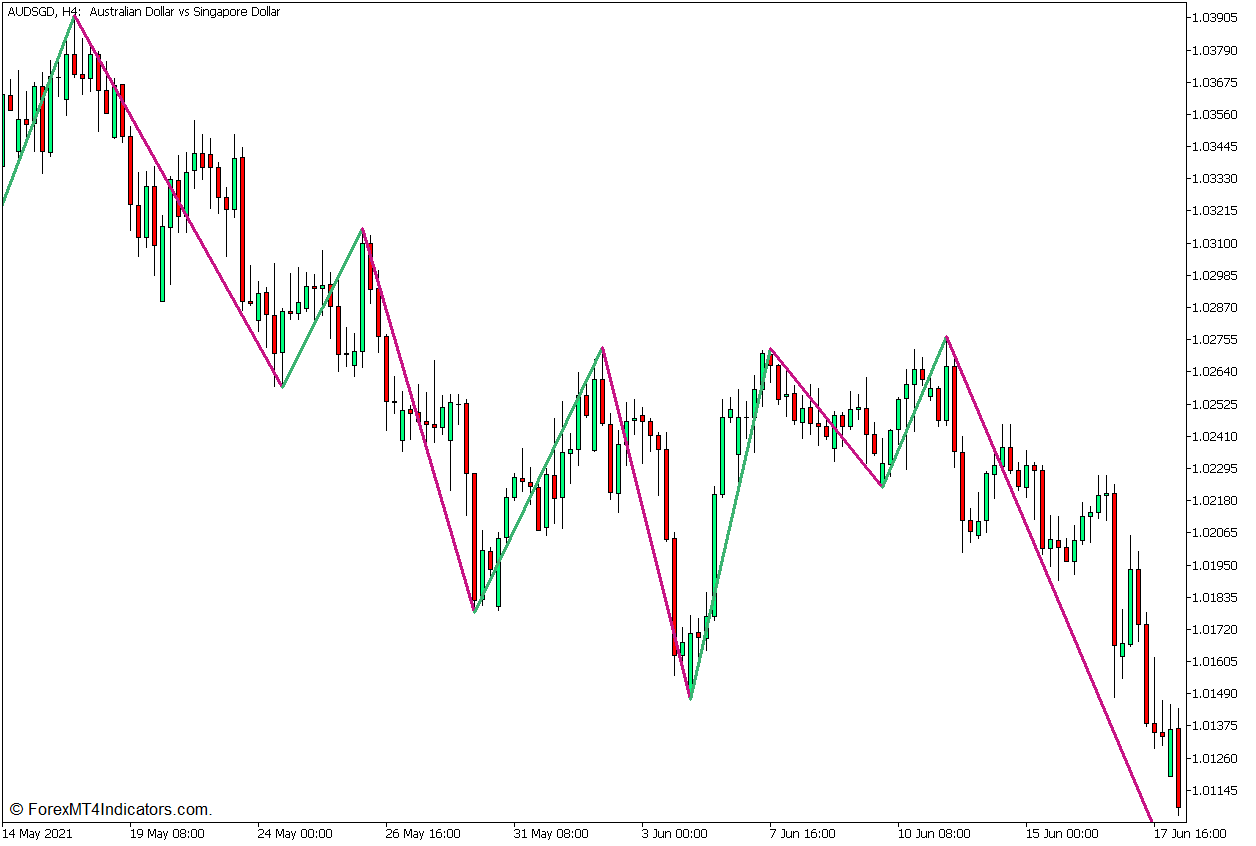
The Zigzag 2 R Color is a custom technical indicator developed to help traders identify price swings. This indicator objectively identifies price swings using an algorithm that compares recent price movements with prior price swings.
This indicator sets a percentage threshold that compares the recent price movements against the prior price swing. If the recent price move against the prior price swing exceeds the percentage threshold, the recent price movement would be considered a new price swing, and its apex or trough will be considered a swing high or swing low.
Zigzag indicators are typically set with a 5% percentage threshold. If the new price momentum moves against the prior price swing and exceeds this threshold, the indicator identifies the price extreme either as a swing high or a swing low. The indicator then connects the swing highs and swing lows with a line, forming a zigzag structure oscillating up and down the price chart, thus the indicator is called a “Zigzag” indicator.
This version of the Zigzag indicator plots colored lines. It plots a medium sea green line to connect a swing low to a swing high, and a medium violet red line to connect a swing high to a swing low.
This indicator has many uses. Traders may use the identified swing highs and swing lows to identify market structure, as well as support and resistance zones based on swing highs and swing lows. It can also be used to objectively identify trend direction based on the trajectory of the price swings. Given that the indicator automatically identifies swing highs and swing lows, traders may also use this indicator as a basis for objectively spotting divergences when comparing price action and oscillators.
Trading Strategy Concept
This trading strategy is a reversal trading strategy that uses divergences as a basis for identifying potential market reversals. It uses two technical indicators specifically intended to help traders objectively identify divergences, particularly the Zigzag 2 R Color indicator and the OsMA indicator.
The Zigzag 2 R Color is used to help traders objectively identify valid significant price swings. These are the swing highs and swing lows which the indicator identifies and becomes the apex and troughs of its zigzag structure.
Traders should then compare the identified swing highs and swing lows with the peaks and dips on the OsMA oscillator. A reversal trade setup could then be considered if there is an observable valid divergence between price action and the OsMA histogram bars. Traders may trade this and set the next logical swing high or swing low as the take-profit target.
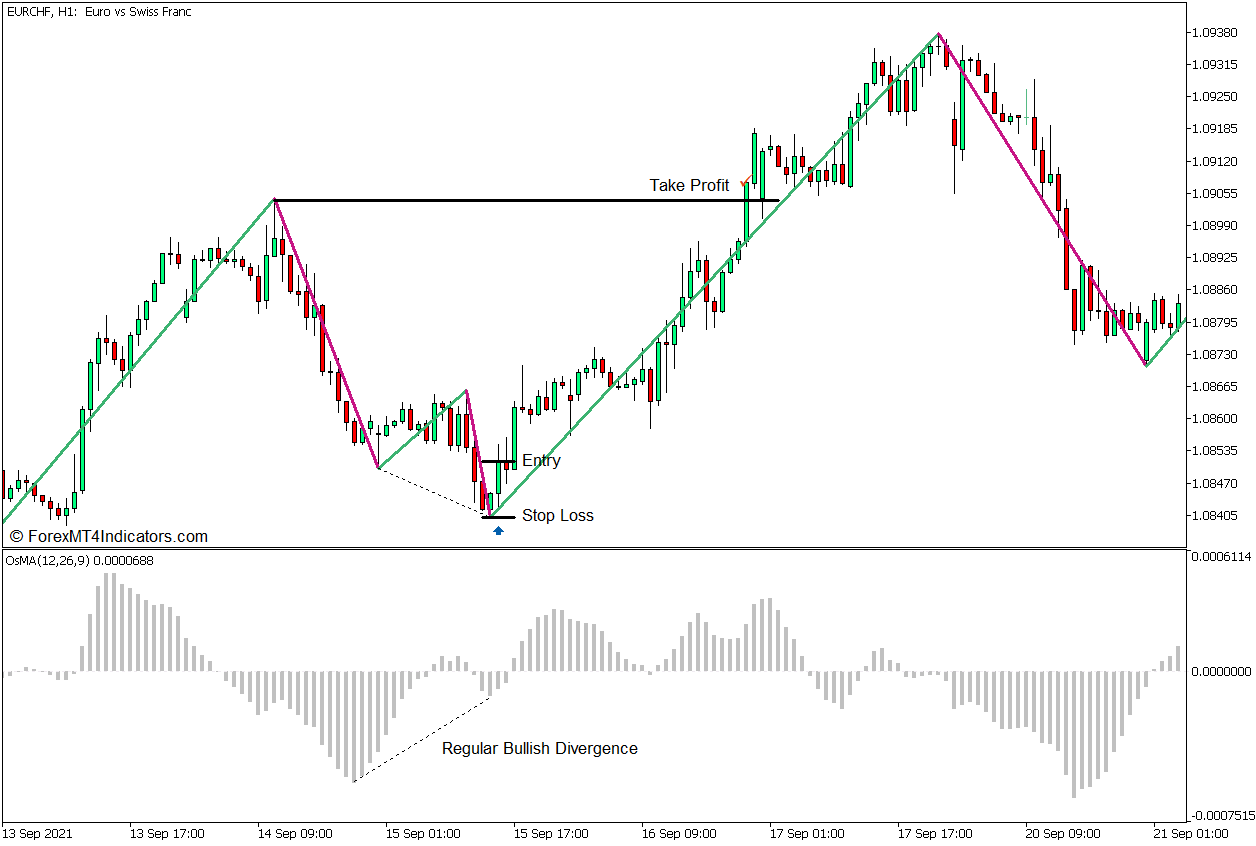
Buy Trade Setup
Entry
- Identify a possible bullish divergence by comparing the swing lows of price action as indicated by the Zigzag 2 R Color indicator and the dips of the OsMA histogram bars.
- Open a buy order if price action shows signs of a possible bullish reversal based on candlestick patterns.
Stop Loss
- Set the stop loss on the fractal below the entry candle.
Exit
- Set the take-profit target on the next logical swing high, allowing for a decent risk-reward ratio.
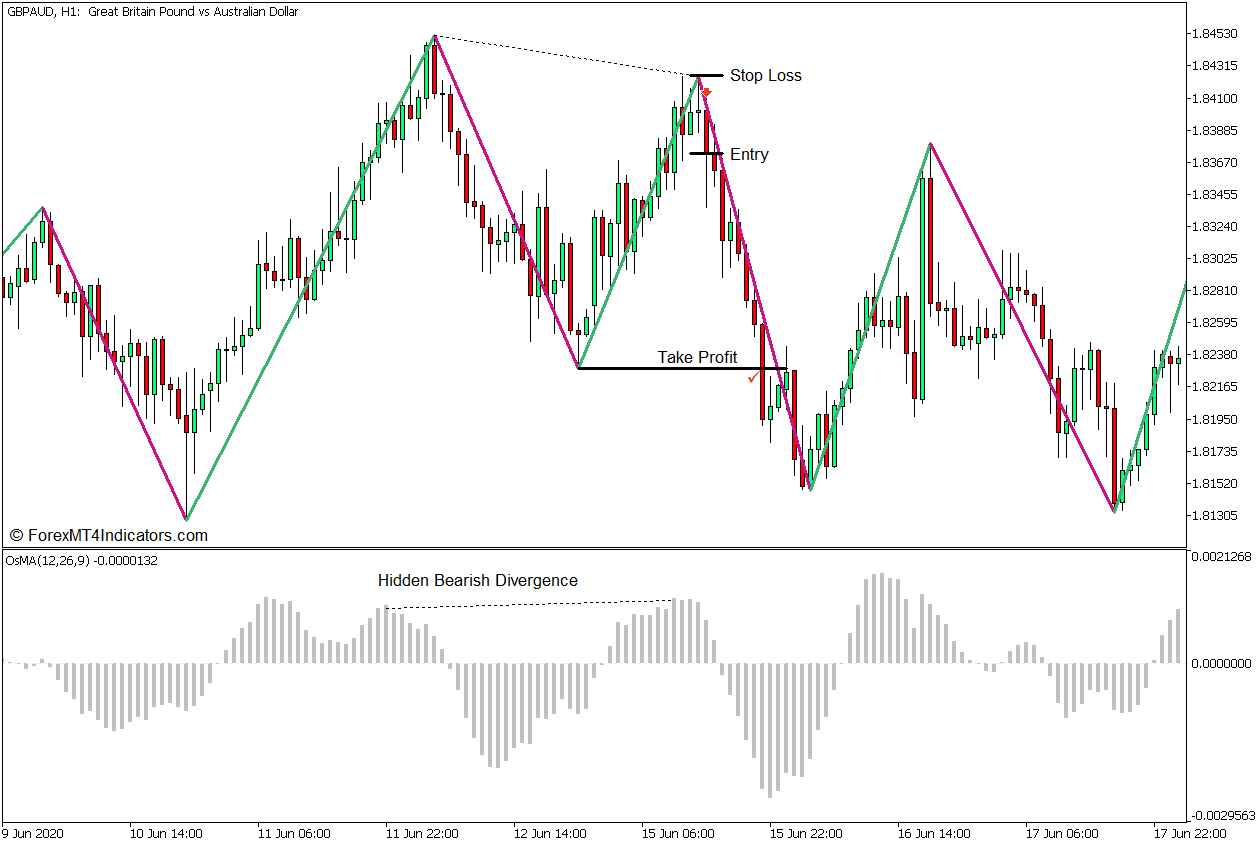
Sell Trade Setup
Entry
- Identify a possible bearish divergence by comparing the swing highs of price action as indicated by the Zigzag 2 R Color indicator and the peaks of the OsMA histogram bars.
- Open a sell order if price action shows signs of a possible bearish reversal based on candlestick patterns.
Stop Loss
- Set the stop loss on the fractal above the entry candle.
Exit
- Set the take-profit target on the next logical swing low, allowing for a decent risk-reward ratio.
Conclusion
This trading strategy can be an excellent method for trading reversals based on divergences. The peaks and dips between price action and the oscillator may not be exactly aligned due to lag. However, traders may still observe valid divergences much more easily when using this strategy. Traders may also modify the settings within the indicators to allow for trade setups that are more aligned. The key to this strategy is in learning how to properly identify divergences and reversal price action indications.
Recommended MT5 Brokers
XM Broker
- Free $50 To Start Trading Instantly! (Withdraw-able Profit)
- Deposit Bonus up to $5,000
- Unlimited Loyalty Program
- Award Winning Forex Broker
- Additional Exclusive Bonuses Throughout The Year

>> Sign Up for XM Broker Account here <<
FBS Broker
- Trade 100 Bonus: Free $100 to kickstart your trading journey!
- 100% Deposit Bonus: Double your deposit up to $10,000 and trade with enhanced capital.
- Leverage up to 1:3000: Maximizing potential profits with one of the highest leverage options available.
- ‘Best Customer Service Broker Asia’ Award: Recognized excellence in customer support and service.
- Seasonal Promotions: Enjoy a variety of exclusive bonuses and promotional offers all year round.

>> Sign Up for FBS Broker Account here <<
Click here below to download: