In the world of trading and investing, having the right tools at your disposal can make a significant difference. One such tool that has gained immense popularity is the MACD 2 Line MT4 Indicator. This article aims to provide you with a comprehensive understanding of what the MACD 2 Line MT4 Indicator is, how it works, and how you can effectively utilize it in your trading strategies.
The MACD 2 Line MT4 Indicator Explained
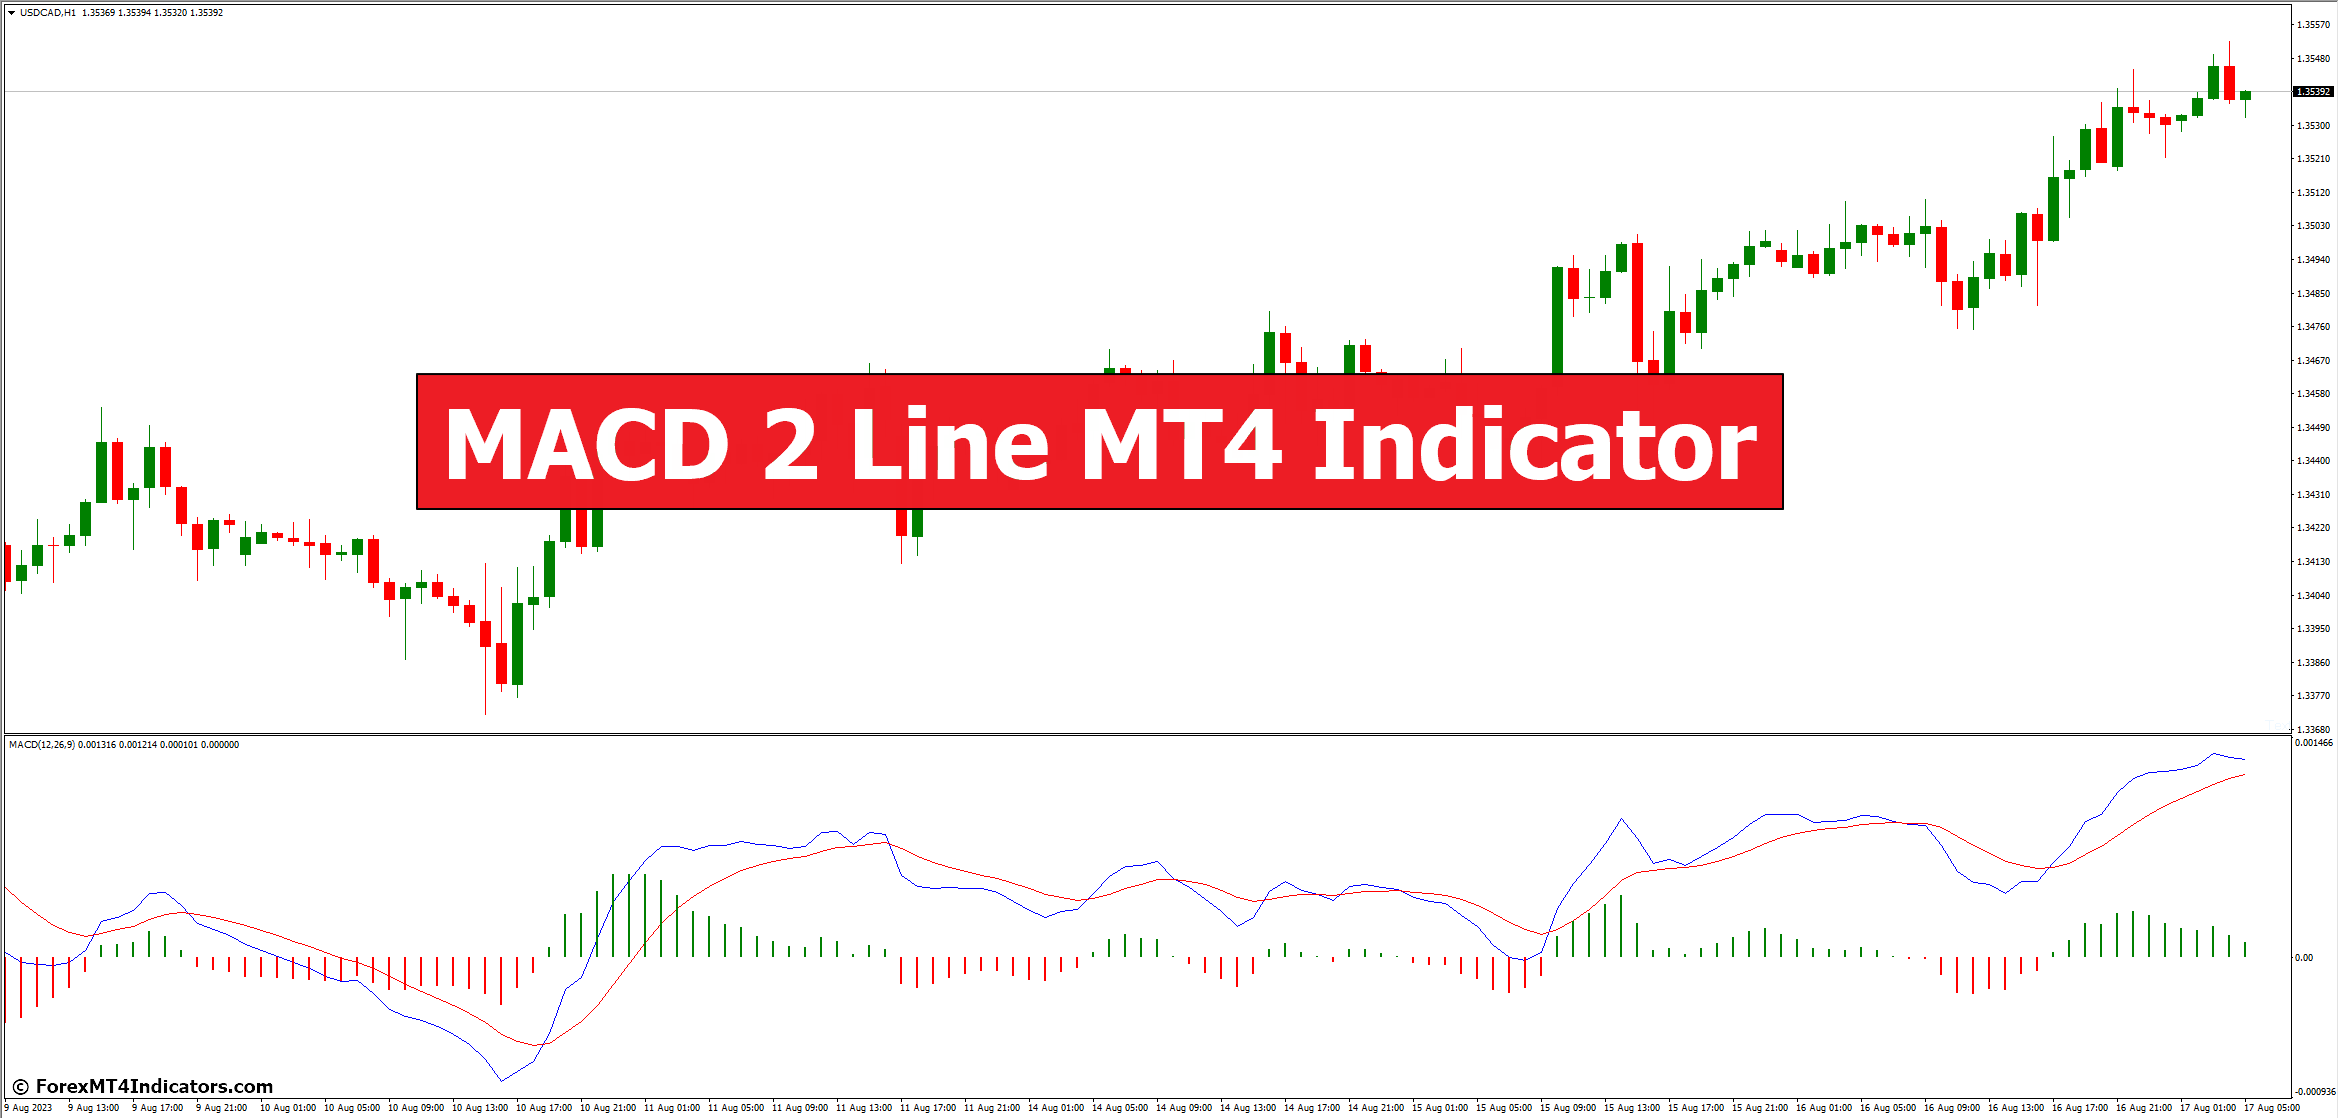
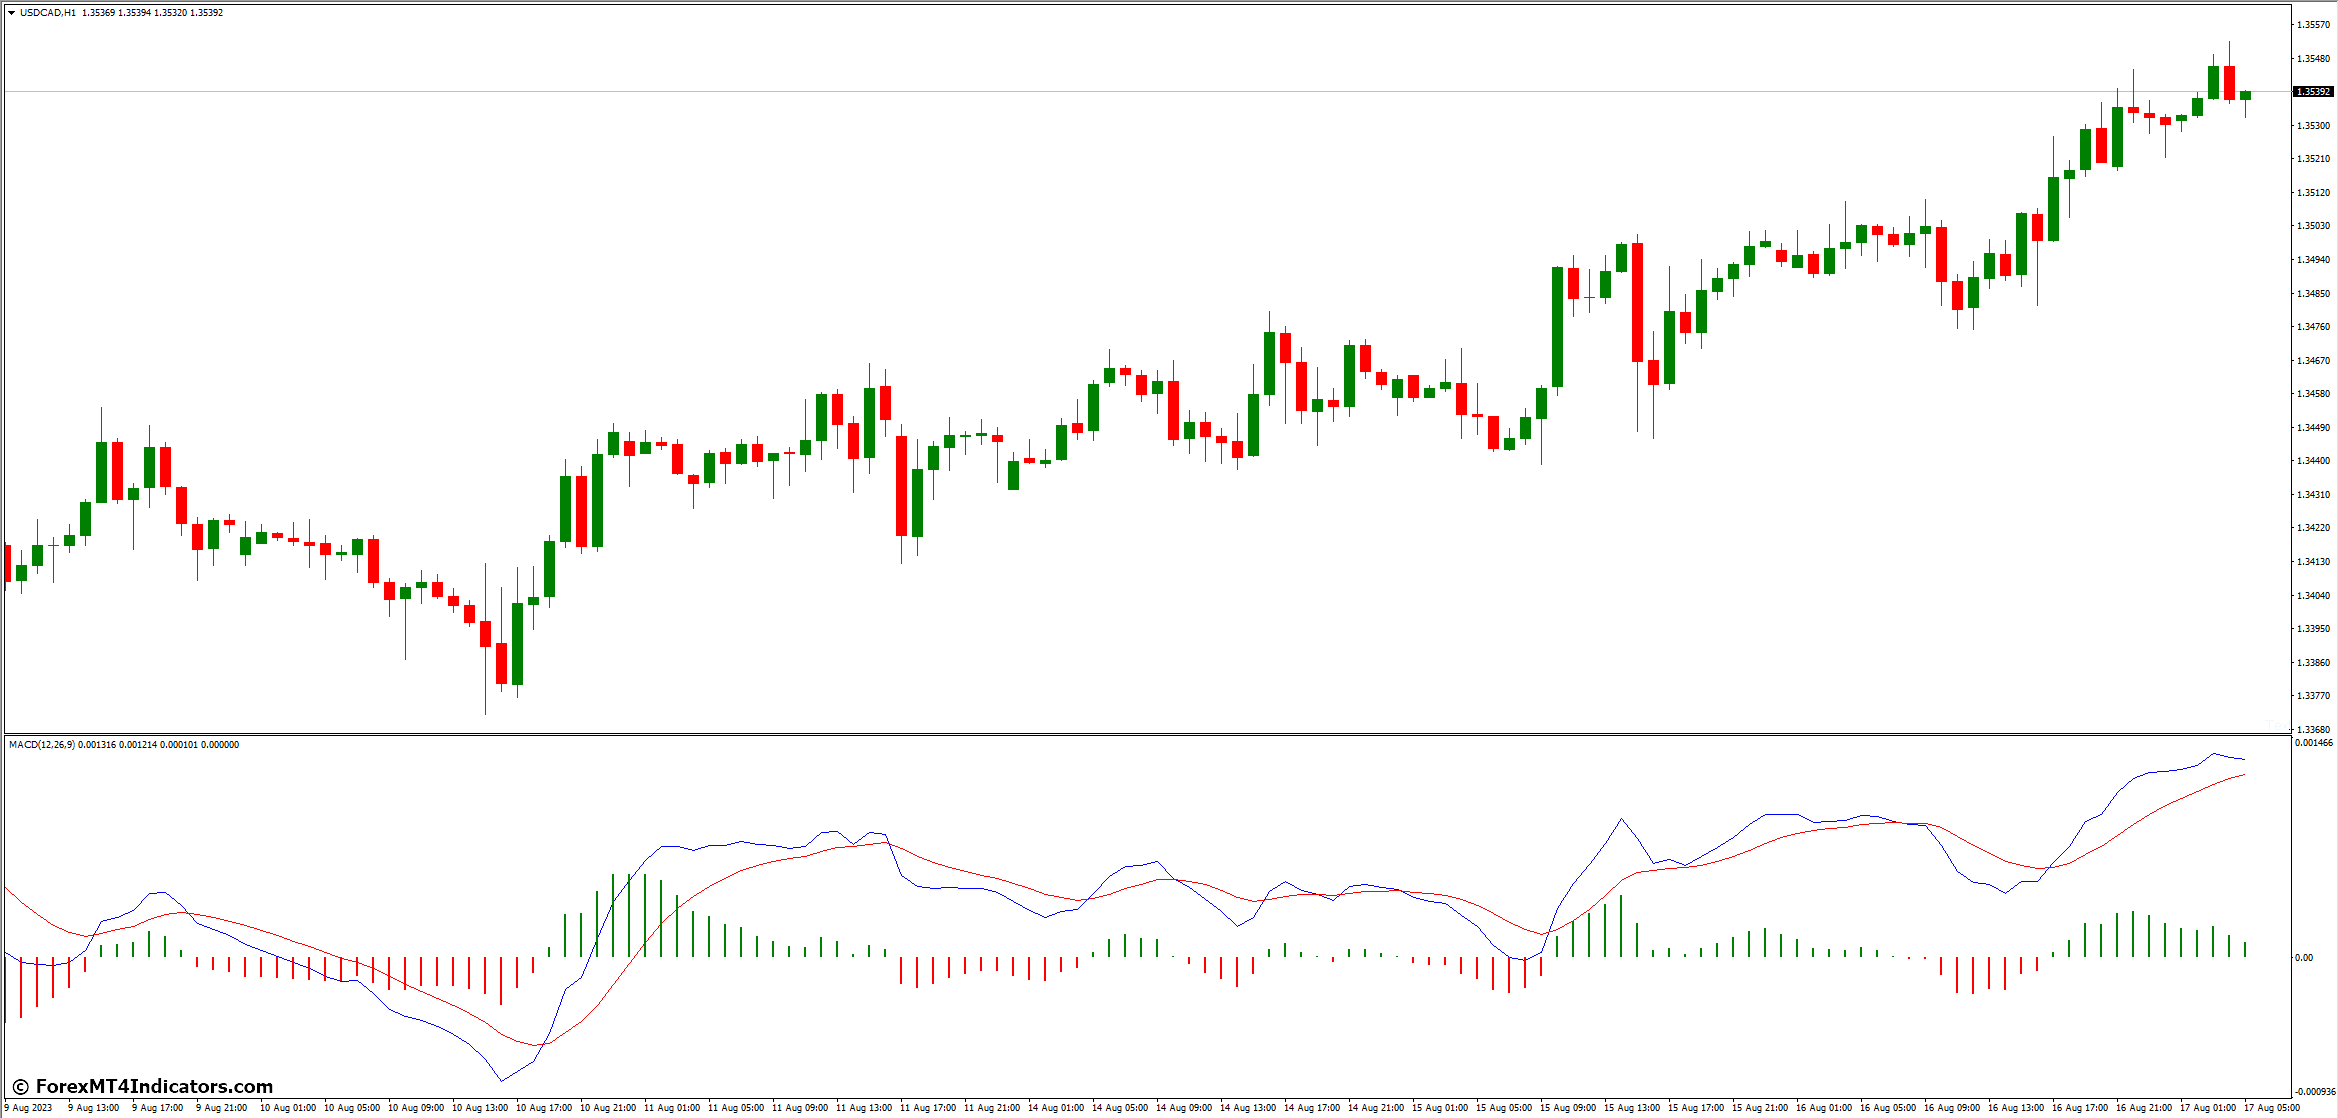
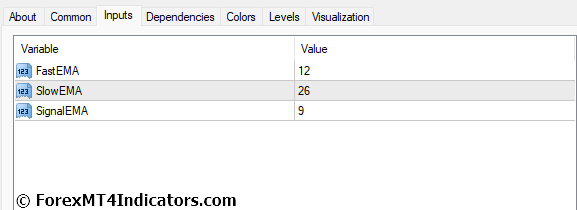
The MACD 2 Line MT4 Indicator, an abbreviation for Moving Average Convergence Divergence, is a versatile technical analysis tool widely used by traders to identify potential trend changes and momentum shifts in a market. It consists of two main components: the MACD line and the signal line. The MACD line represents the difference between two moving averages (usually 12-period and 26-period) plotted on a chart. The signal line, often referred to as the “trigger line,” is a 9-period exponential moving average of the MACD line.
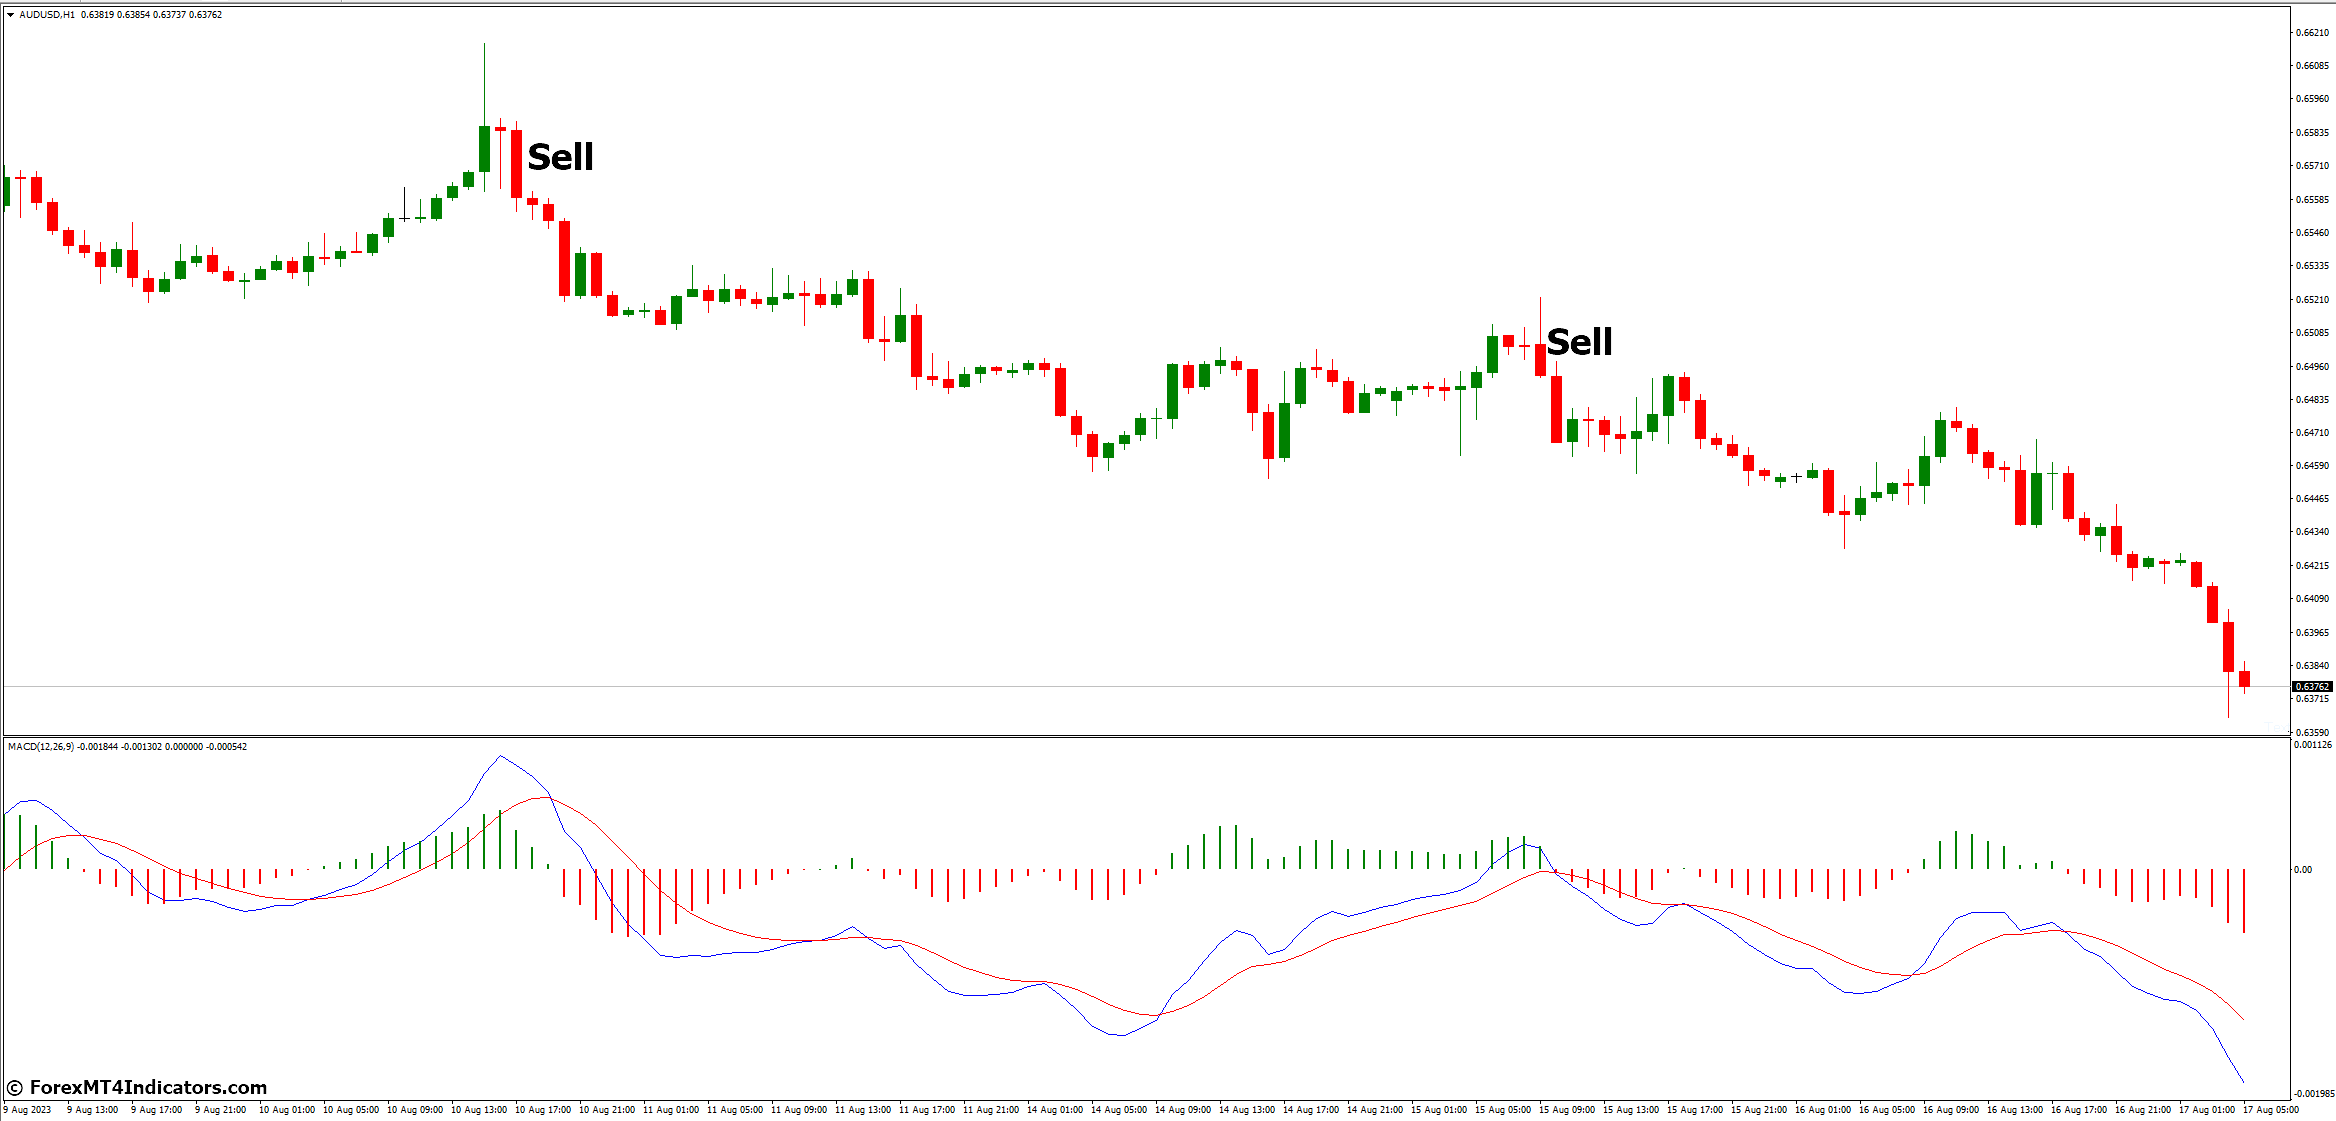
The significance of the MACD indicator lies in its ability to provide insights into the strength and direction of a trend. When the MACD line crosses above the signal line, it generates a bullish signal, indicating potential upward momentum. Conversely, when the MACD line crosses below the signal line, it generates a bearish signal, indicating potential downward momentum.
Using MACD 2 Line for Trend Identification
The MACD 2 Line Indicator is a valuable tool for identifying trends and trend reversals. One common strategy is to observe the crossovers between the MACD line and the signal line. A bullish crossover, where the MACD line crosses above the signal line, suggests a potential trend reversal to the upside. On the other hand, a bearish crossover, where the MACD line crosses below the signal line, suggests a potential trend reversal to the downside.
Divergence is another powerful concept used with the MACD indicator. It occurs when the direction of the price and the direction of the MACD indicator diverge. Bullish divergence happens when the price makes a lower low while the MACD indicator forms a higher low. This suggests a potential trend reversal to the upside. Bearish divergence, on the other hand, happens when the price makes a higher high while the MACD indicator forms a lower high, indicating a potential trend reversal to the downside.
Incorporating MACD 2 Line with Other Indicators
The effectiveness of the MACD 2 Line Indicator can be amplified when combined with other technical indicators. For instance, traders often combine the MACD indicator with moving averages to confirm trend directions. When the MACD line crosses above the longer-term moving average, it adds weight to the bullish signal, and vice versa.
Additionally, pairing the MACD with the Relative Strength Index (RSI) can provide a more holistic view of the market’s momentum and potential overbought or oversold conditions. The convergence of bullish signals from both indicators can reinforce the likelihood of a successful trade.
MACD 2 Line Strategies for Entry and Exit Points
Traders use various strategies based on the MACD 2 Line Indicator for entry and exit points. One common strategy is the MACD crossover strategy. When the MACD line crosses above the signal line, it generates a buy signal. Conversely, when the MACD line crosses below the signal line, it generates a sell signal.
Divergence confirmation is another popular approach. Traders wait for bullish or bearish divergence to occur and then enter a trade in the direction indicated by the MACD divergence.
Risk Management and MACD 2 Line
Effective risk management is crucial in trading, and the MACD 2 Line Indicator can play a role in this aspect as well. Traders often use the MACD indicator to set stop-loss orders. For instance, if a trader enters a long position based on a bullish MACD crossover, they might set a stop-loss just below the recent swing low to minimize potential losses.
Adjusting position sizes based on the volatility indicated by the MACD can also help traders maintain consistency in their risk exposure across different trades.
Backtesting and Optimizing MACD Strategies
Before implementing any trading strategy, it’s important to backtest it to assess its historical performance. Backtesting involves applying the strategy to historical market data to see how it would have performed in the past. This helps traders understand the strategy’s strengths and weaknesses.
Optimizing MACD parameters, such as the moving average periods, can also improve strategy performance. However, it’s important to strike a balance between optimizing for past data and maintaining a strategy’s robustness in the face of changing market conditions.
Common Mistakes to Avoid
While the MACD 2 Line Indicator is a powerful tool, there are common mistakes that traders should avoid. Overtrading based solely on MACD signals without considering other factors can lead to losses. Neglecting fundamental analysis and ignoring broader market conditions can also be detrimental.
Advantages and Limitations of MACD 2 Line MT4 Indicator
The MACD 2 Line Indicator comes with its set of advantages. It’s versatile and can be used in different market conditions. However, like any tool, it has limitations. It can generate false signals, especially in choppy or sideways markets. Traders need to be aware of these limitations and use the indicator in conjunction with other tools for a well-rounded approach.
Case Studies: Real-Life Examples
Let’s take a look at a couple of case studies to understand how the MACD 2 Line Indicator can be applied in real trading scenarios.
Case Study 1: Successful Trade Using MACD Crossover
In this scenario, the MACD line crosses above the signal line, generating a buy signal. The trader enters a long position and rides the uptrend, ultimately realizing profits when the MACD line crosses below the signal line.
Case Study 2: Identifying False Signals with Divergence
Here, the trader spots bearish divergence between the price and the MACD indicator. Despite the initial bullish crossover, the divergence warns of potential downside. The trader avoids entering a long trade and sidesteps a losing position.
Technical Analysis and MACD
The MACD 2 Line Indicator is a fundamental tool within technical analysis. It confirms trends, identifies potential reversals, and aids in decision-making. When used alongside candlestick patterns, it enhances the trader’s ability to predict price movements accurately.
Keeping Up with MACD Trends
The MACD indicator has evolved over time, with variations and enhancements developed by traders and analysts. Staying updated with these trends ensures that traders are making the most of this versatile tool.
How to Trade with MACD 2 Line MT4 Indicator
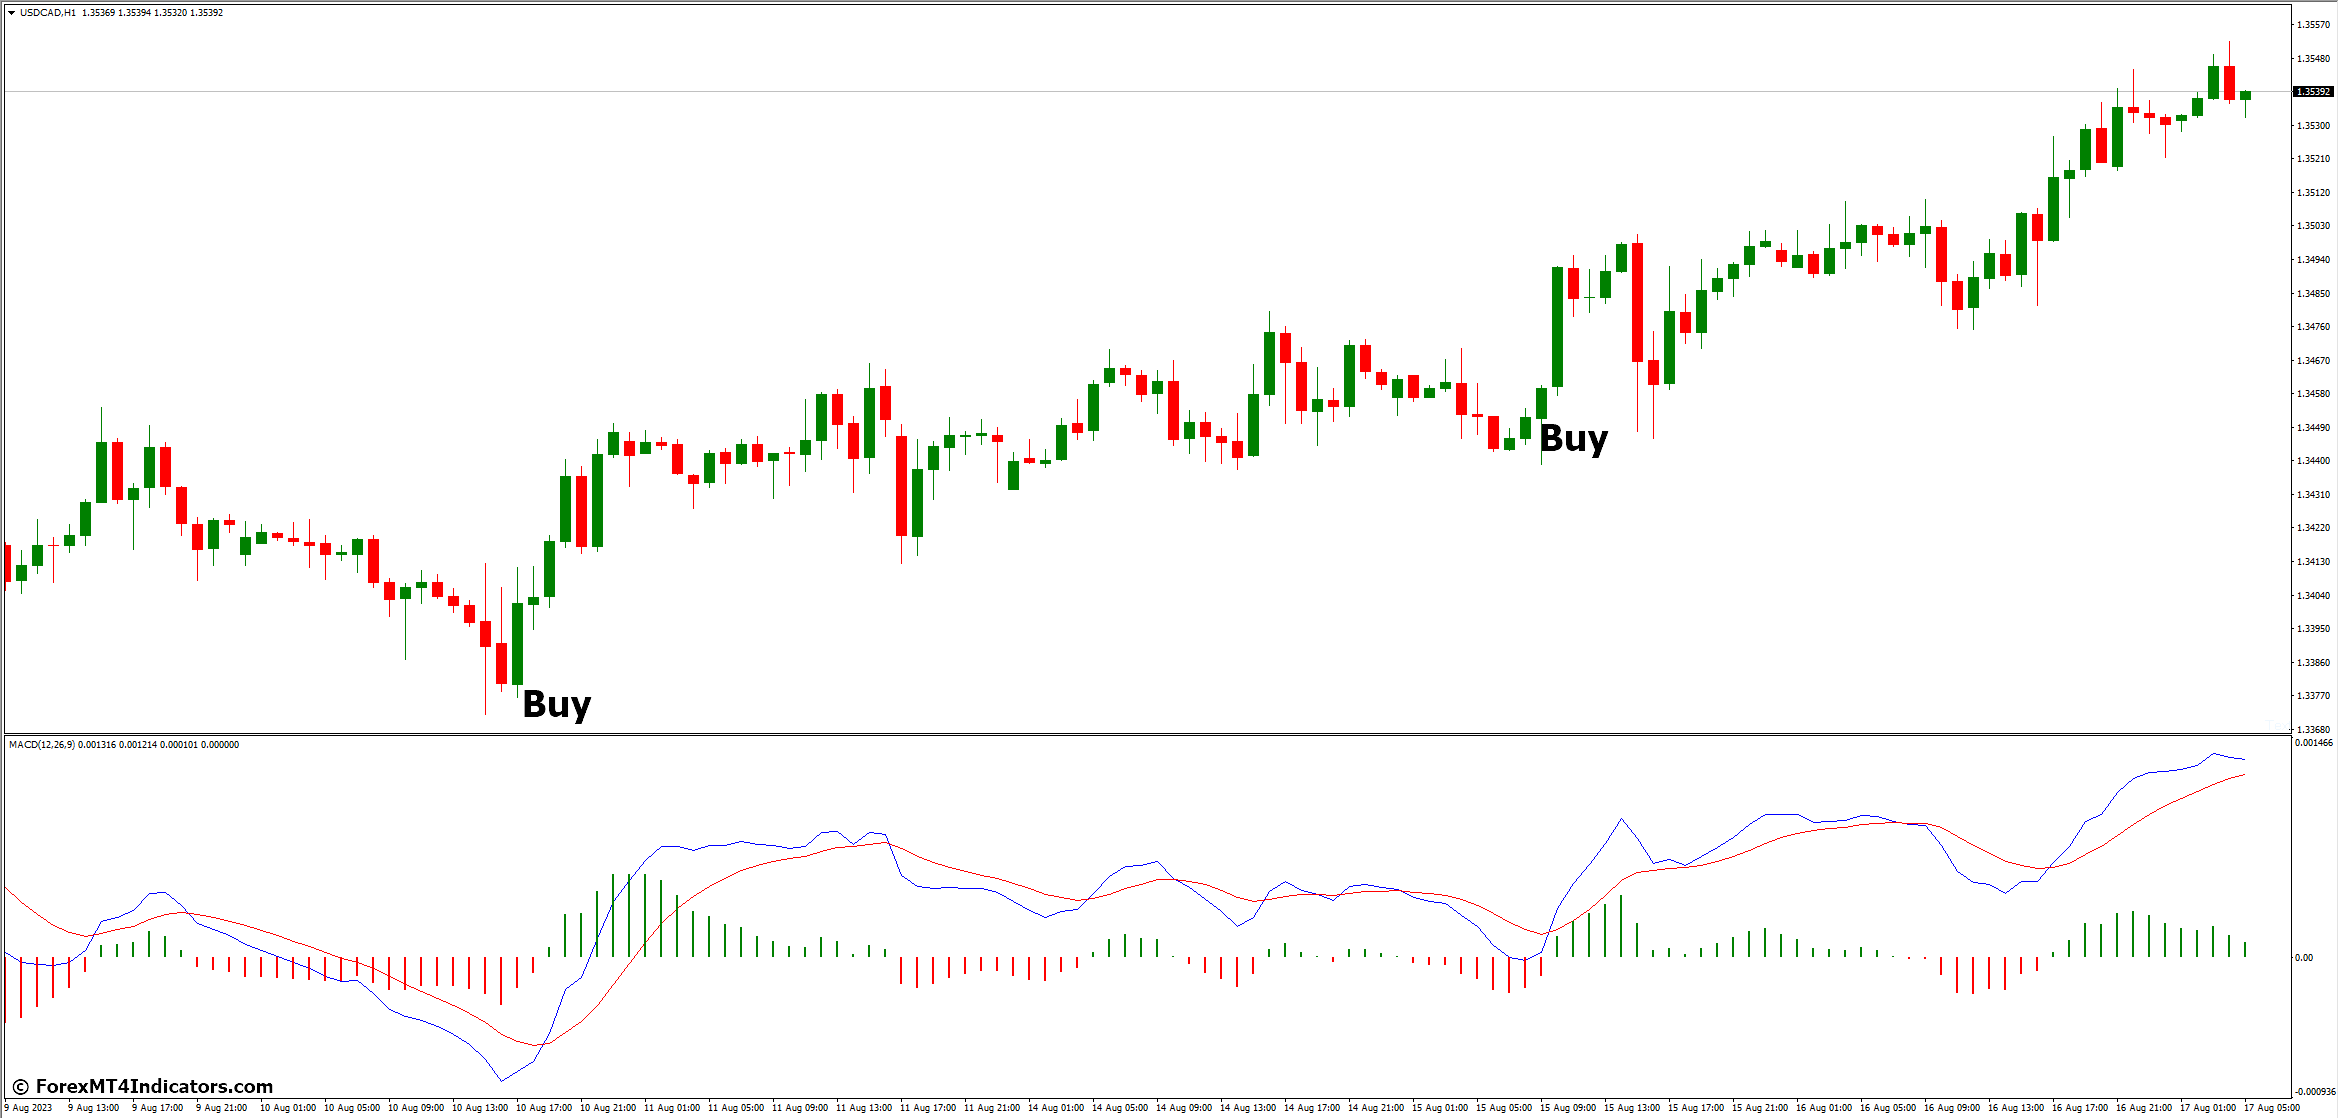
Buy Entry
- Wait for MACD line to cross above Signal line (bullish crossover).
- Confirm with a positive MACD histogram.
- Consider entry when bullish momentum is indicated.
Sell Entry
- Wait for MACD line to cross below Signal line (bearish crossover).
- Confirm with a negative MACD histogram.
- Consider entry when bearish momentum is indicated.
MACD 2 Line MT4 Indicator Settings
Conclusion
The MACD 2 Line MT4 Indicator is a potent ally for traders seeking to make informed decisions in the dynamic world of financial markets. With its ability to identify trends, confirm signals, and offer insights into momentum, it remains a staple in the toolkit of both novice and experienced traders. By understanding its mechanics and nuances, traders can unlock its full potential and elevate their trading strategies.
FAQs
Q1: Can the MACD indicator be used for short-term trading?
A1: Yes, the MACD indicator can be adapted for short-term trading strategies, such as scalping or day trading. However, traders should adjust the parameters and timeframes to suit their preferred trading style.
Q2: Is the MACD indicator suitable for all types of financial instruments?
A2: While the MACD indicator is commonly used in various markets, including stocks, forex, and cryptocurrencies, its effectiveness may vary depending on the instrument and market conditions.
Q3: Can the MACD indicator be used as a standalone strategy?
A3: While the MACD indicator is powerful, relying solely on it for trading decisions might not be ideal. Combining it with other technical and fundamental analysis tools can provide a more comprehensive approach.
Q4: What is the best time frame for using the MACD indicator?
A4: The choice of time frame depends on your trading goals. Short-term traders might use lower time frames (e.g., 5-minute or 15-minute), while long-term investors might prefer higher time frames (e.g., daily or weekly).
Recommended MT4/MT5 Brokers
XM Broker
- Free $50 To Start Trading Instantly! (Withdraw-able Profit)
- Deposit Bonus up to $5,000
- Unlimited Loyalty Program
- Award Winning Forex Broker
- Additional Exclusive Bonuses Throughout The Year
>> Sign Up for XM Broker Account here <<
FBS Broker
- Trade 100 Bonus: Free $100 to kickstart your trading journey!
- 100% Deposit Bonus: Double your deposit up to $10,000 and trade with enhanced capital.
- Leverage up to 1:3000: Maximizing potential profits with one of the highest leverage options available.
- ‘Best Customer Service Broker Asia’ Award: Recognized excellence in customer support and service.
- Seasonal Promotions: Enjoy a variety of exclusive bonuses and promotional offers all year round.
>> Sign Up for FBS Broker Account here <<
(Free MT4 Indicators Download)
Click here below to download:


