Trading on established trends is very logical. If you would look at historical charts and use any indicator that could help traders identify the trend, you would notice how predictable price movements often are once the trend is established.
Yet despite its seemingly very predictable movement patterns, trading on established trends is often very tricky. This is because most trend following strategies require traders to trade when price is at the peak of its current expansion phase.
Instead of buying when the market is at the peak of a bullish trend or at the trough of a bearish trend, traders should be trading on the retracements. Traders who have learned the skill of timing entries on retracements could easily make money from a trending market.
Guppy Multiple Moving Average
Moving averages are probably the simplest types of indicators. Yet this simple indicator is probably one of the most effective tools traders could use in a trending market condition.
Price moves in a series of expansions and retracements during a trending market. Price would rapidly move in the direction of the trend then retrace back to its mean. Logic would tell us that it is best to enter trades in the direction of the trend during a retracement and exit the trade at the expansion phase. However, this is easier said than done. It is quite difficult to time retracements.
Moving averages are often used as a gauge measuring the depth of a retracement. This allows traders to better assess whether price has retraced deep enough to warrant an entry based on a retracement or not. Price would often bounce off moving averages thus it is often used as a dynamic area of support and resistance.
The Guppy Multiple Moving Average (GMMA) is a trend following indicator that makes use of multiple moving averages. This creates a band of moving averages which expands during a trending market and contracts as the trend starts to fade.
It is also an effective tool to use as a dynamic area of support and resistance. Price would often retrace to the moving averages and bounce off during a trending market condition.
MUV Indicator
The MUV indicator is a modified moving average indicator based on Tom Demark’s TD Moving Average.
This custom moving average indicator was intended to identify stop loss placements and exit points. However, in a trending market where there are multiple retracements, it could also be used to identify the end of a retracement. This is when price closes above it after a retracement on a bullish trend, or below it after a retracement on a bearish trend.
Trading Strategy
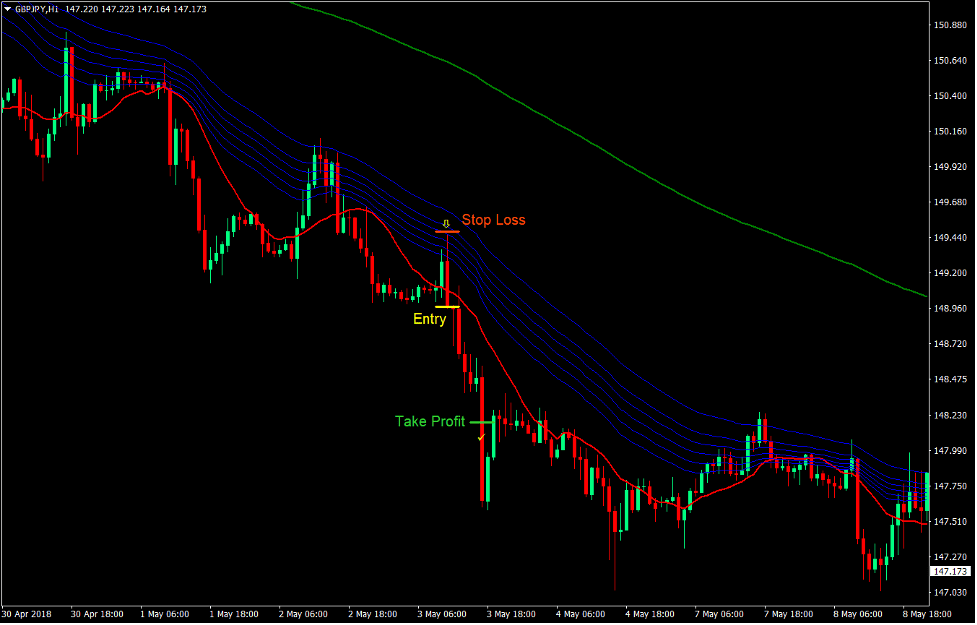
This trading strategy is a simple trend following strategy which provides entries right after a retracement.
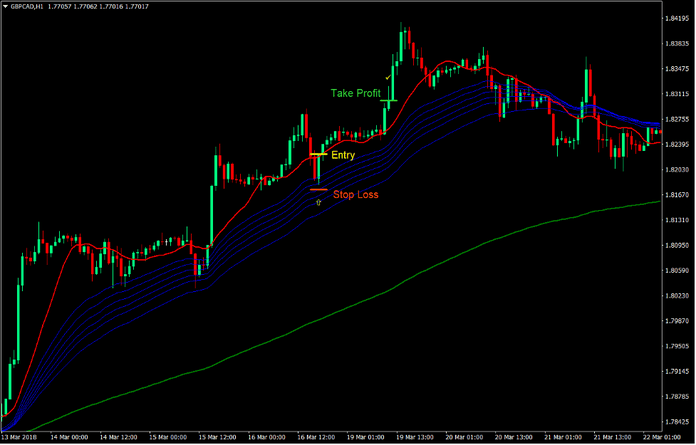
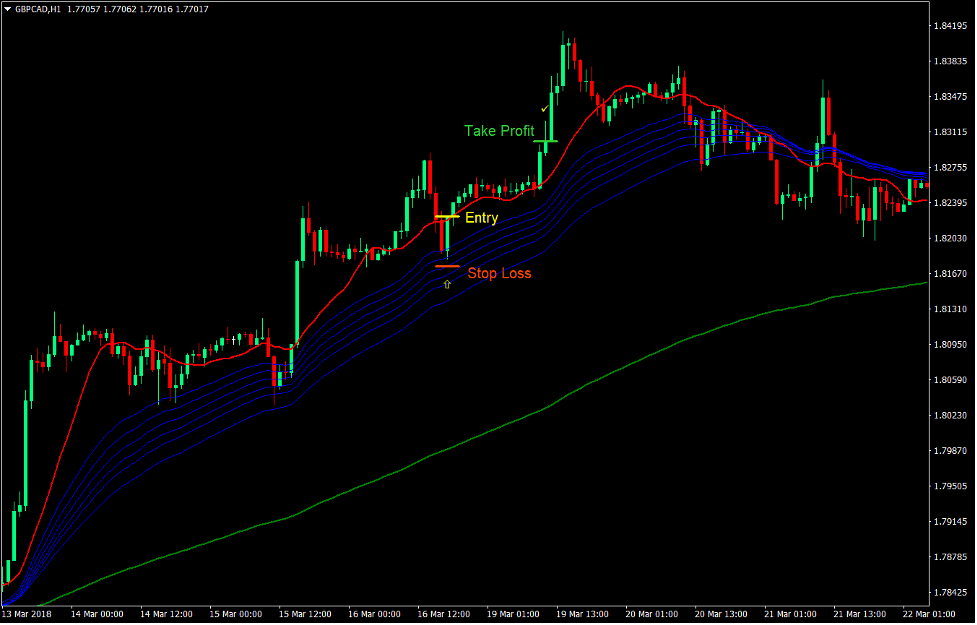
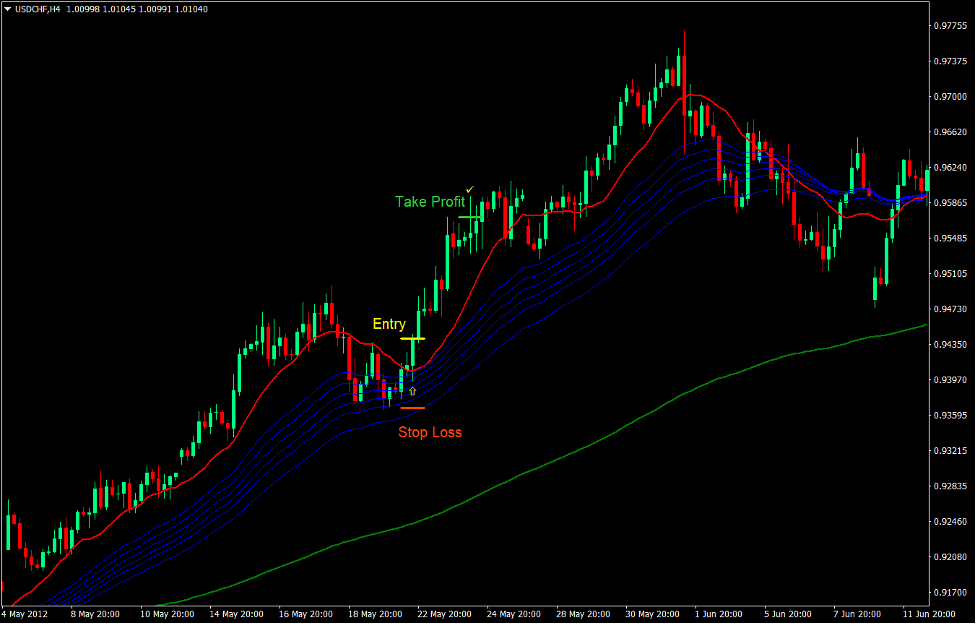
It uses the Guppy Multiple Moving Average indicator as a basis for the depth of the retracement and the dynamic area of support and resistance. Price should retrace towards the GMMA then bounce off it. As price bounces off the GMMA lines, it should then close beyond the MUV line indicating that the retracement has ended and price is ready to start a new expansion phase in the direction of the trend.
In order to align the trades with the long-term trend, the 200 Exponential Moving Average (EMA) will be used as a trend filter. Price, as well as the MUV and GMMA lines, should be on the correct side of the 200 EMA according to the direction of the trend.
Indicators:
- 200 EMA
- MUV
- GMMA_Long
Timeframes: 15-minute, 30-minute, 1-hour, 4-hour and daily charts
Currency Pairs: major and minor pairs
Trading Session: Tokyo, London and New York sessions
Buy Trade Setup
Entry
- Price, the MUV line and the GMMA lines should be above the 200 EMA indicating a bullish trend.
- The 200 EMA should be sloping up indicating a bullish long-term trend.
- Price should retrace towards the GMMA lines and bounce off it.
- Price should then close above the MUV line indicating the end of the retrace and the probable start of a bullish expansion phase.
- Enter a buy order on the confirmation of the conditions above.
Stop Loss
- Set the stop loss at the fractal below the entry candle.
Take Profit
- Set the take profit target at 1.5x the risk on the stop loss.
Sell Trade Setup
Entry
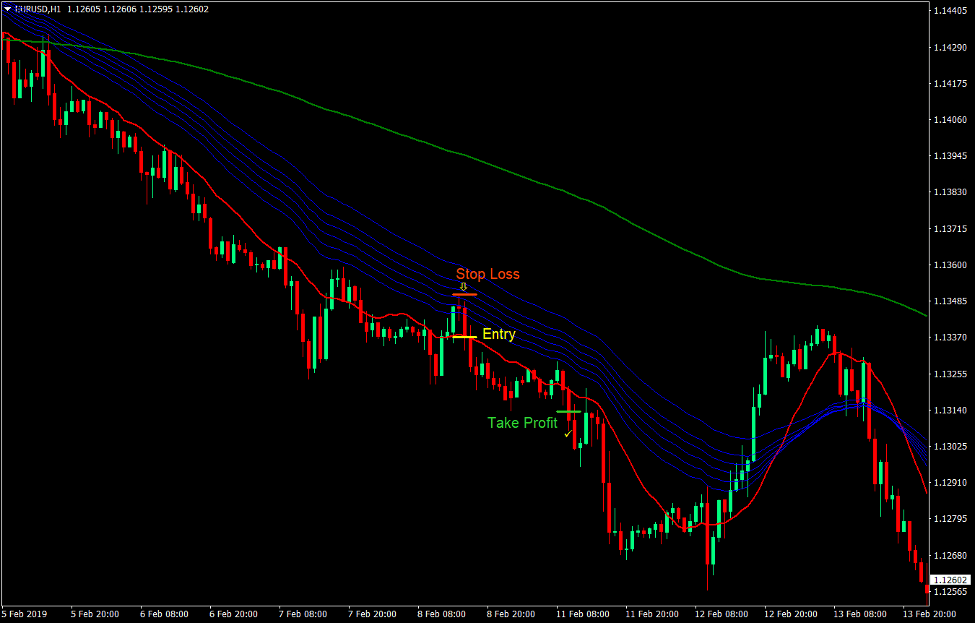
- Price, the MUV line and the GMMA lines should be below the 200 EMA indicating a bearish trend.
- The 200 EMA should be sloping down indicating a bearish long-term trend.
- Price should retrace towards the GMMA lines and bounce off it.
- Price should then close below the MUV line indicating the end of the retrace and the probable start of a bearish expansion phase.
- Enter a sell order on the confirmation of the conditions above.
Stop Loss
- Set the stop loss at the fractal above the entry candle.
Take Profit
- Set the take profit target at 1.5x the risk on the stop loss.
Conclusion
This type of trading strategy is one of the most basic types of trend following strategies. It provides re-entries based on retracements towards a dynamic area of support or resistance allowing traders to enter trades at a better price rather than chasing price on the expansion phase.
This strategy makes use of a fixed 1.5x reward-risk ratio. However, traders who have a different risk appetite could tweak this. Having a higher take profit target multiplier provides a better reward-risk ratio but could probably lower the win ratio, while lower multipliers could improve the win ratio yet lower the reward-risk ratio.
Other traders opt to exit trades manually instead of using a fixed take profit target ratio. Theoretically, this should produce the best results, however fear, greed and other emotional factors would often cause traders to either exit trades too early or close a profitable trade too late. This often results in a lower growth expectancy for the trading account.
Recommended MT4 Brokers
XM Broker
- Free $50 To Start Trading Instantly! (Withdraw-able Profit)
- Deposit Bonus up to $5,000
- Unlimited Loyalty Program
- Award Winning Forex Broker
- Additional Exclusive Bonuses Throughout The Year
>> Sign Up for XM Broker Account here <<
FBS Broker
- Trade 100 Bonus: Free $100 to kickstart your trading journey!
- 100% Deposit Bonus: Double your deposit up to $10,000 and trade with enhanced capital.
- Leverage up to 1:3000: Maximizing potential profits with one of the highest leverage options available.
- ‘Best Customer Service Broker Asia’ Award: Recognized excellence in customer support and service.
- Seasonal Promotions: Enjoy a variety of exclusive bonuses and promotional offers all year round.
>> Sign Up for FBS Broker Account here <<
Click here below to download:


