


One way to trade long-term trends is to use indicators that could help us identify long-term trends. Traders can use a couple of long-term trend indicators which can be complementary and trade whenever there is a confluence of signals and trend direction between the two. Having such confluence between complementary long-term trend-following indicators can significantly increase the accuracy of the trade.
This strategy is a long-term trend-following strategy that makes use of two popular technical indicators – the Kumo of the Ichimoku Kinko Hyo and the Heiken Ashi Smoothed indicator.
Kumo – Ichimoku Kinko Hyo
The Ichimoku Kinko Hyo indicator is one of the most complete trend-following indicators. This is because the Ichimoku Kinko Hyo indicator is composed of several lines that are mostly based on the median of price over a certain period, each of which can help determine trend direction or bias on varying horizons. The Tenkan-sen and Kijun-sen are mostly used to determine the short-term trend, while the Senkou Span A and Senkou Span B are paired to determine the long-term trend.
Senkou Span A, also called the Leading Span A, is calculated as the average of the Tenkan-sen and Kijun-sen, then plotted 26 periods ahead. This line is used as one edge of the Kumo.
Senkou Span B, also called the Leading Span B, is computed by adding the highest high and lowest low of price over the past 52 periods, then dividing by two. The result is also plotted 26 periods ahead. This line forms the second edge of the Kumo.
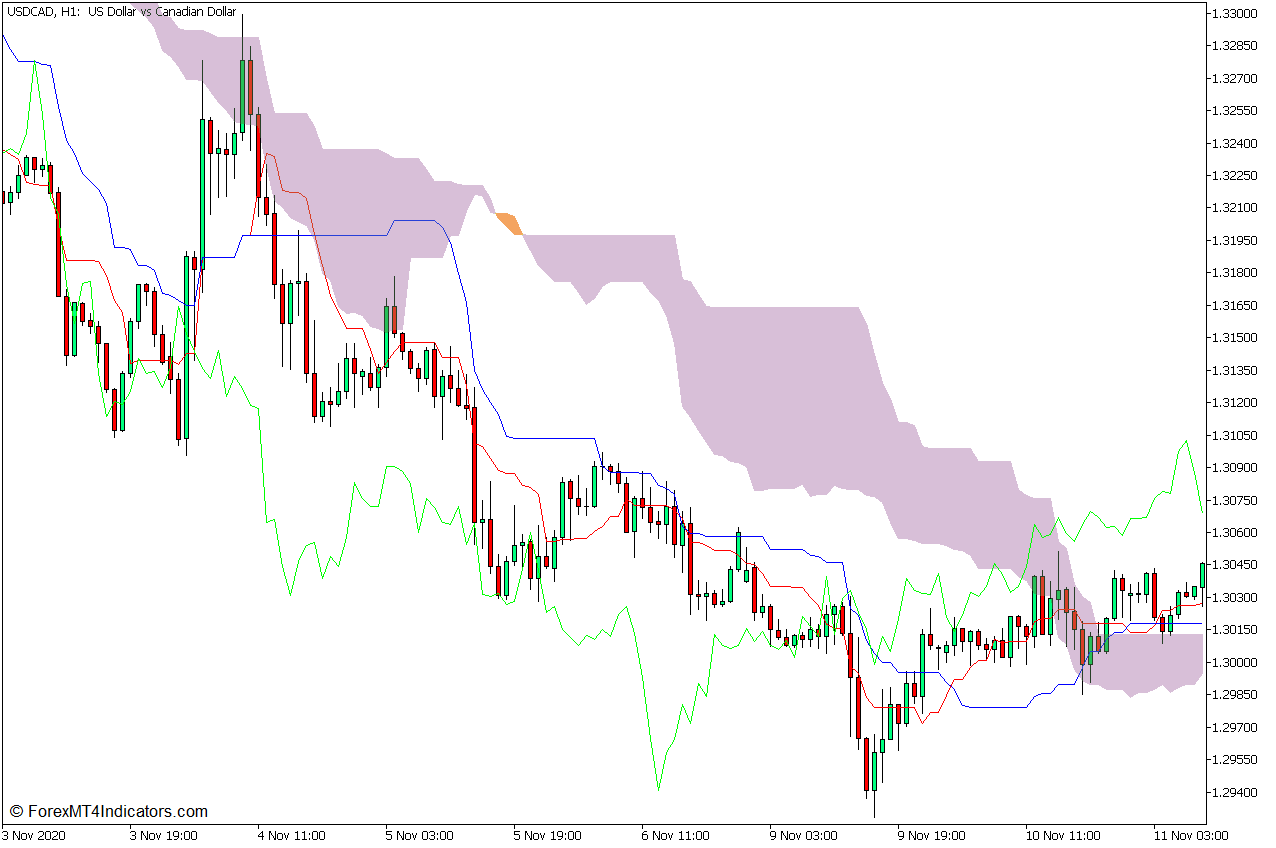
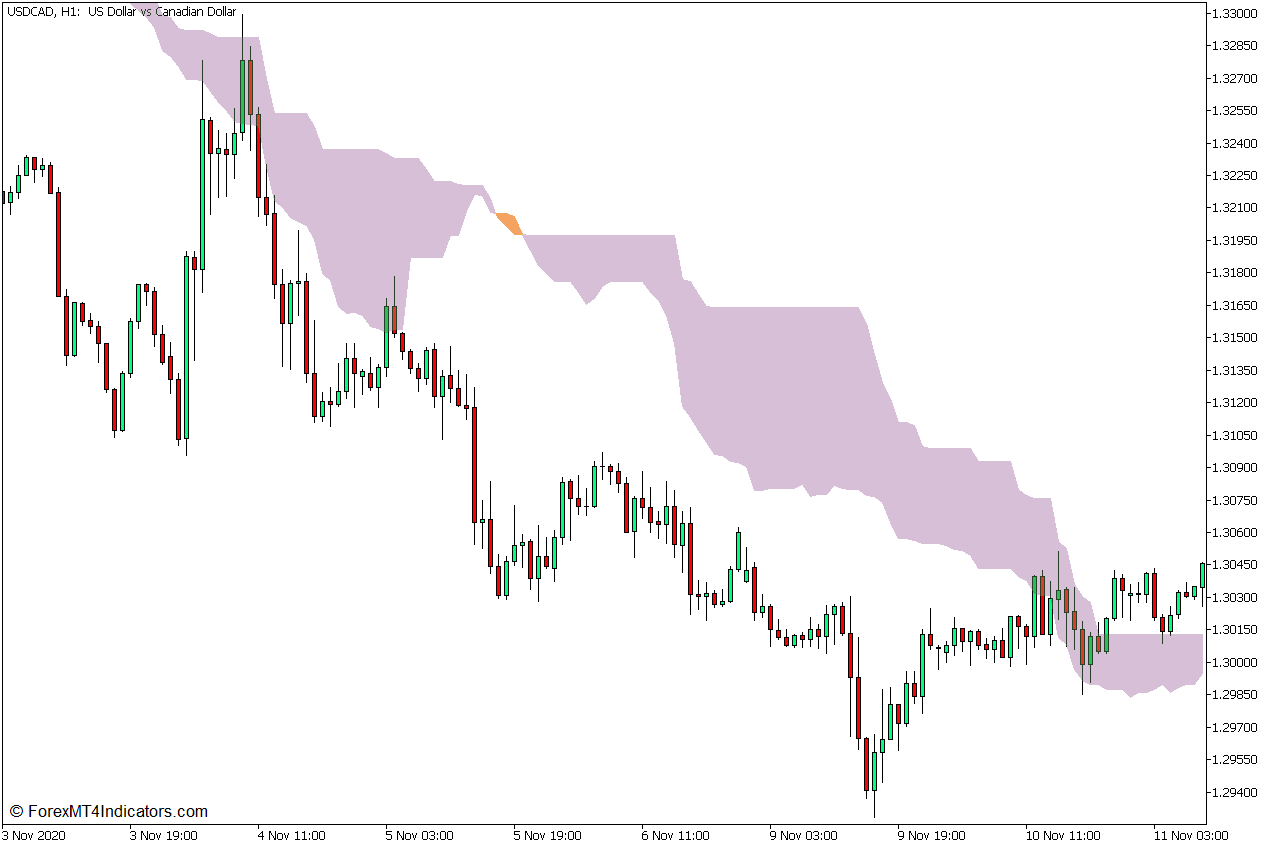
As mentioned above, the Kumo or cloud is composed of the Senkou Span A and Senkou Span B. The area between the Senkou Span A and Senkou Span B is what is called the Kumo or cloud.
The long-term trend can be determined based on how the Senkou Span A and Senkou Span B lines interact. The long-term trend has a bullish bias whenever the Senkou Span A is above the Senkou Span B, and has a bearish bias whenever the Senkou Span A is below the Senkou Span B.
However, this can more easily be determined because the Kumo is shaded depending on the direction of the long-term trend. It is colored sandy brown whenever the long-term trend is bullish and thistle whenever the long-term trend is bearish.
The Kumo can be a very effective long-term trend bias filter, so, we will be using the Kumo as such.
Heiken Ashi Smoothed
The word Heiken Ashi means “average bars” when translated from Japanese. The Heiken Ashi Smoothed indicator is rightly called such since it makes use of bars that are derived from the average price to help traders determine trend direction.
The Heiken Ashi Smoothed indicator is somewhat related to the Heiken Ashi Candlesticks because both indicators use “average bars” to help traders determine trends or momentum. However, their similarities end there. This is because the Heiken Ashi Candlesticks represent the highs and lows of each candlestick bar making it resemble candlesticks more closely.
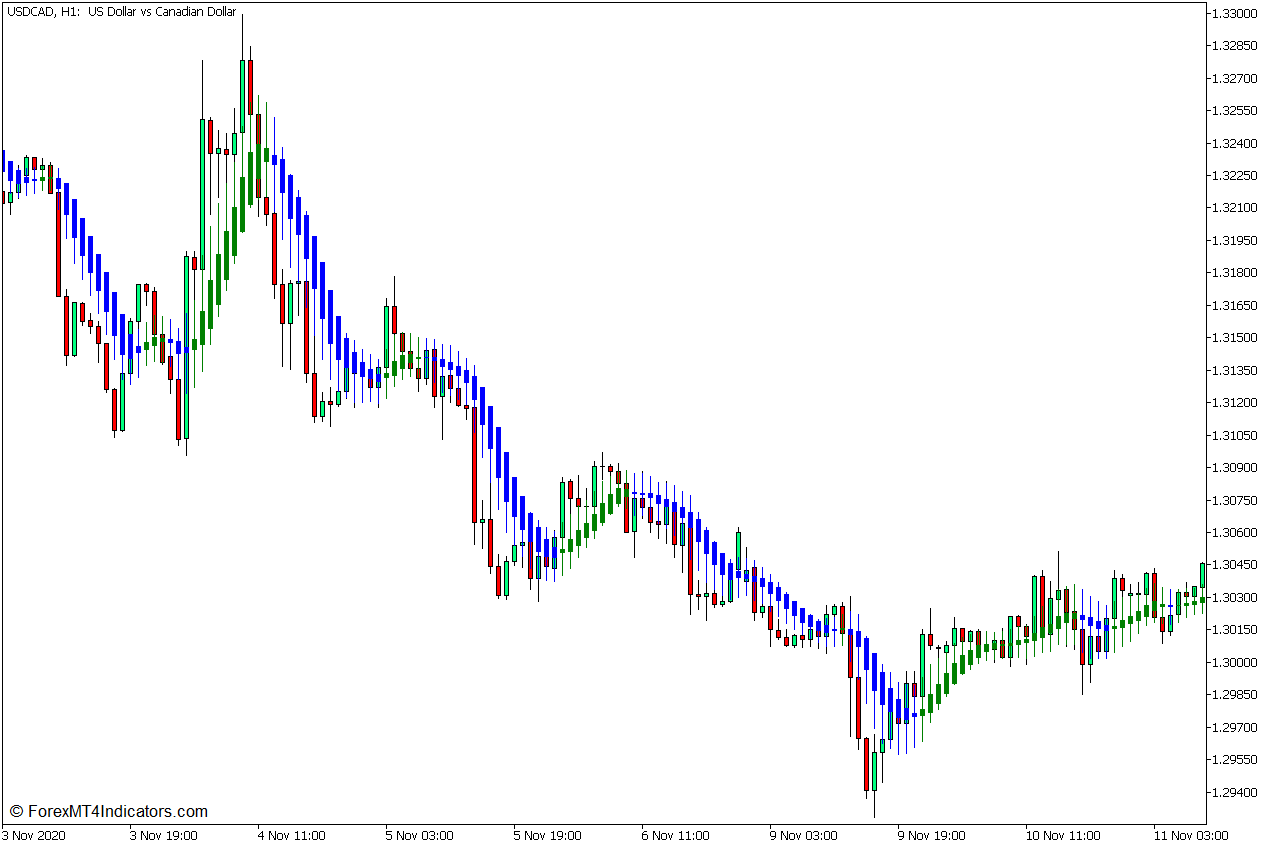
The Heiken Ashi Smoothed indicator on the other hand computes the average of price and plots bars that do not represent the highs and lows of each candle. The Heiken Ashi Smoothed indicator is more closely related to a moving average line, only that it uses bars to represent the average price.
The Heiken Ashi Smoothed indicator plots bars that change color to indicate trend direction. This template of the Heiken Ashi Smoothed indicator plots green bars to indicate a bullish trend and blue bars to represent a bearish trend. Changes in the color of the bars indicate a potential trend reversal which could sometimes last for quite a long time. This makes the Heiken Ashi Smoothed indicator more suitable as a mid-to-long-term trend-following indicator.
Trading Strategy Concept
This trading strategy is a trend continuation trading strategy that uses the confluence of the Heiken Ashi Smoothed Indicator and the Kumo to identify potential trend continuation entries.
The Kumo element of the Ichimoku Kinko Hyo Indicator is used as the long-term trend direction filter, which is based on where price action is about the Kumo, as well as the color of the Kumo.
Price action would generally pull back with a deep swing towards the Kumo, which would usually result in the color of the Heiken Ashi Smoothed bars temporarily changing indicating a trend opposite the direction of the long-term trend. The entry signal would be when the Heiken Ashi Smoothed bars would change color once again in confluence with the Kumo long-term trend direction.
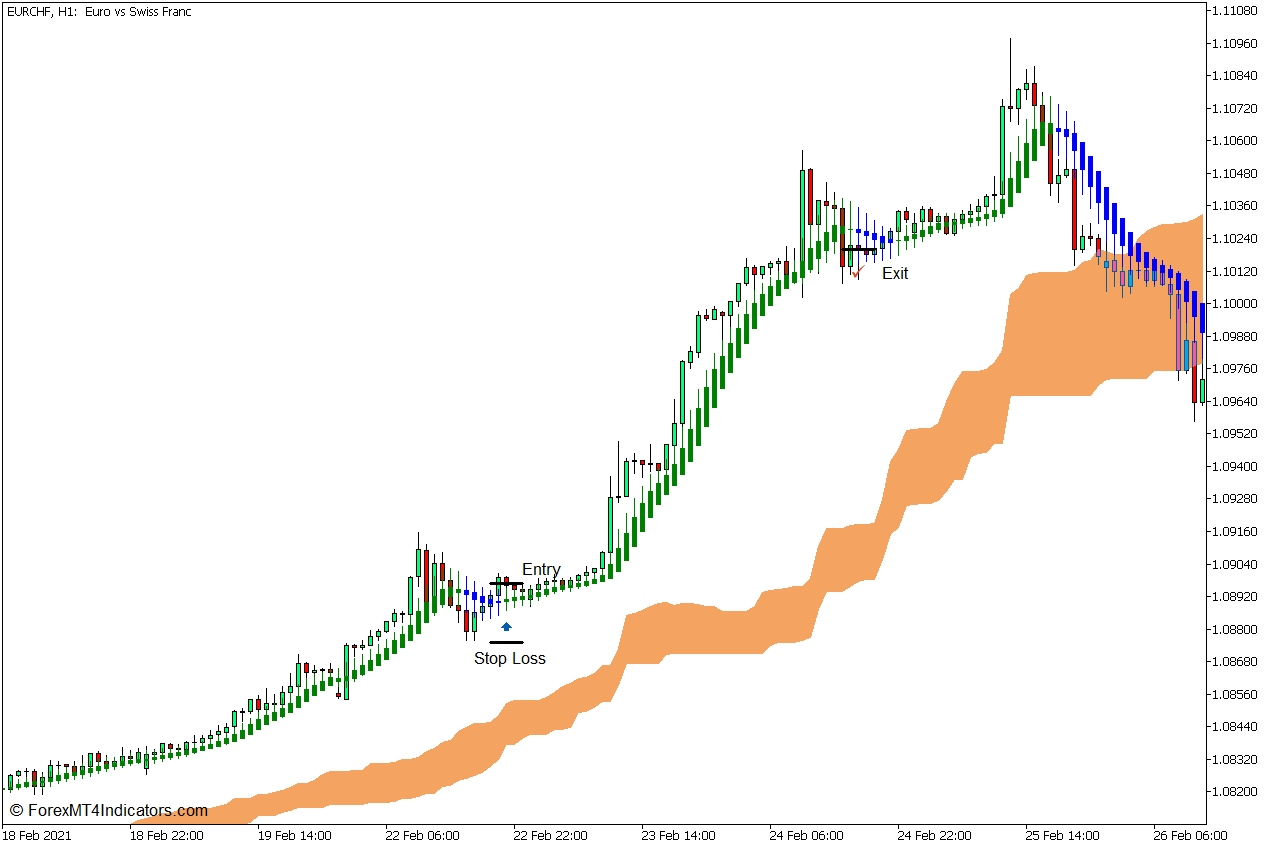
Buy Trade Setup
Entry
- The Kumo should be sandy brown indicating a bullish long-term trend.
- Price action and the Heiken Ashi Smoothed bars should be above the Kumo.
- Price action should retrace near the Kumo and cause the Heiken Ashi Smoothed bars to temporarily change to blue.
- Price action should bounce off the area near the Kumo.
- Enter a buy order as soon as the Heiken Ashi Smoothed bars change to green.
Stop Loss
- Set the stop loss on the support level below the entry candle.
Exit
- Close the trade as soon as the Heiken Ashi Smoothed bars change back to blue.
Sell Trade Setup
Entry
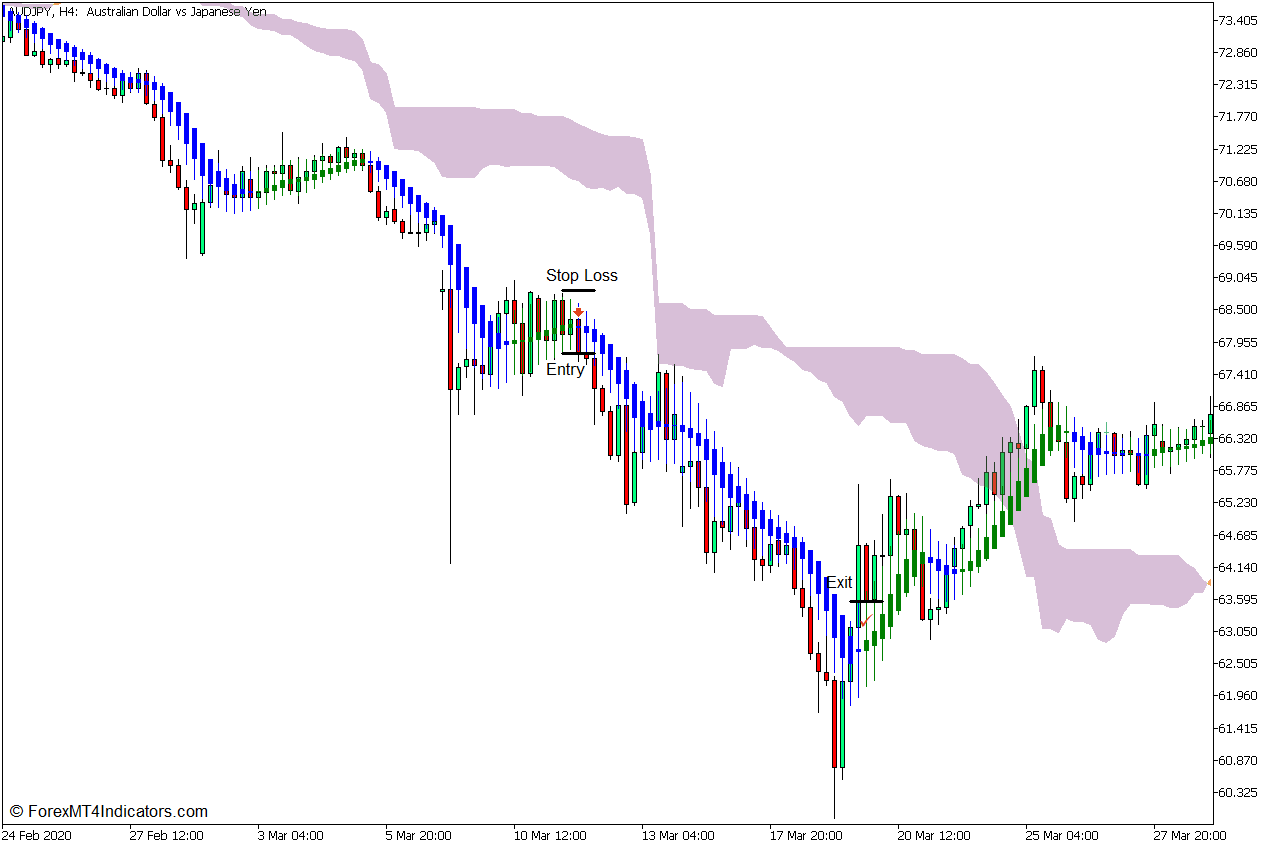
- The Kumo should be thistle indicating a bearish long-term trend.
- Price action and the Heiken Ashi Smoothed bars should be below the Kumo.
- Price action should retrace near the Kumo and cause the Heiken Ashi Smoothed bars to temporarily change to green.
- Price action should bounce off the area near the Kumo.
- Enter a sell order as soon as the Heiken Ashi Smoothed bars change to blue.
Stop Loss
- Set the stop loss on the resistance level above the entry candle.
Exit
- Close the trade as soon as the Heiken Ashi Smoothed bars change back to green.
Conclusion
The Heiken Ashi Smoothed indicator has the potential to produce signals that could lead to very long trends and big moves. However, its reversals should be on a relevant support or resistance level. The Kumo can be a very good support or resistance area for the long-term trend. This is why these two indicators can complement each other to produce high-probability long-term trend signals. However, these signals should also not be too late on a trend as price action tends to reverse when the trend is already overextended. It is best to use this strategy near the start of a long-term trend based on the Kumo reversing.
Recommended MT5 Brokers
XM Broker
- Free $50 To Start Trading Instantly! (Withdraw-able Profit)
- Deposit Bonus up to $5,000
- Unlimited Loyalty Program
- Award Winning Forex Broker
- Additional Exclusive Bonuses Throughout The Year

>> Sign Up for XM Broker Account here <<
FBS Broker
- Trade 100 Bonus: Free $100 to kickstart your trading journey!
- 100% Deposit Bonus: Double your deposit up to $10,000 and trade with enhanced capital.
- Leverage up to 1:3000: Maximizing potential profits with one of the highest leverage options available.
- ‘Best Customer Service Broker Asia’ Award: Recognized excellence in customer support and service.
- Seasonal Promotions: Enjoy a variety of exclusive bonuses and promotional offers all year round.

>> Sign Up for FBS Broker Account here <<
Click here below to download: