


Crossovers and trend reversals are probably some of the simplest types of trading strategies to which new traders are introduced. However, many new traders do not find success with it simply because they are not timing their trade entries correctly. The strategy discussed here shows us how we can use the Kijun-sen and Tenkan-sen to help us time our trend reversal trade entries correctly.
Ichimoku Kinko Hyo – Kijun-sen and Tenkan-sen
The Ichimoku Kinko Hyo indicator is a trend-following technical indicator system that provides traders an indication regarding the direction of the trend, from the short-term trend up to the long-term trend. This is made possible because the Ichimoku Kinko Hyo indicator is comprised of several lines that indicate trend directions, representing various trend horizons. These lines are the Tenkan-sen, Kijun-sen, Senkou Span A, Senkou Span B, and Chikou Span lines.
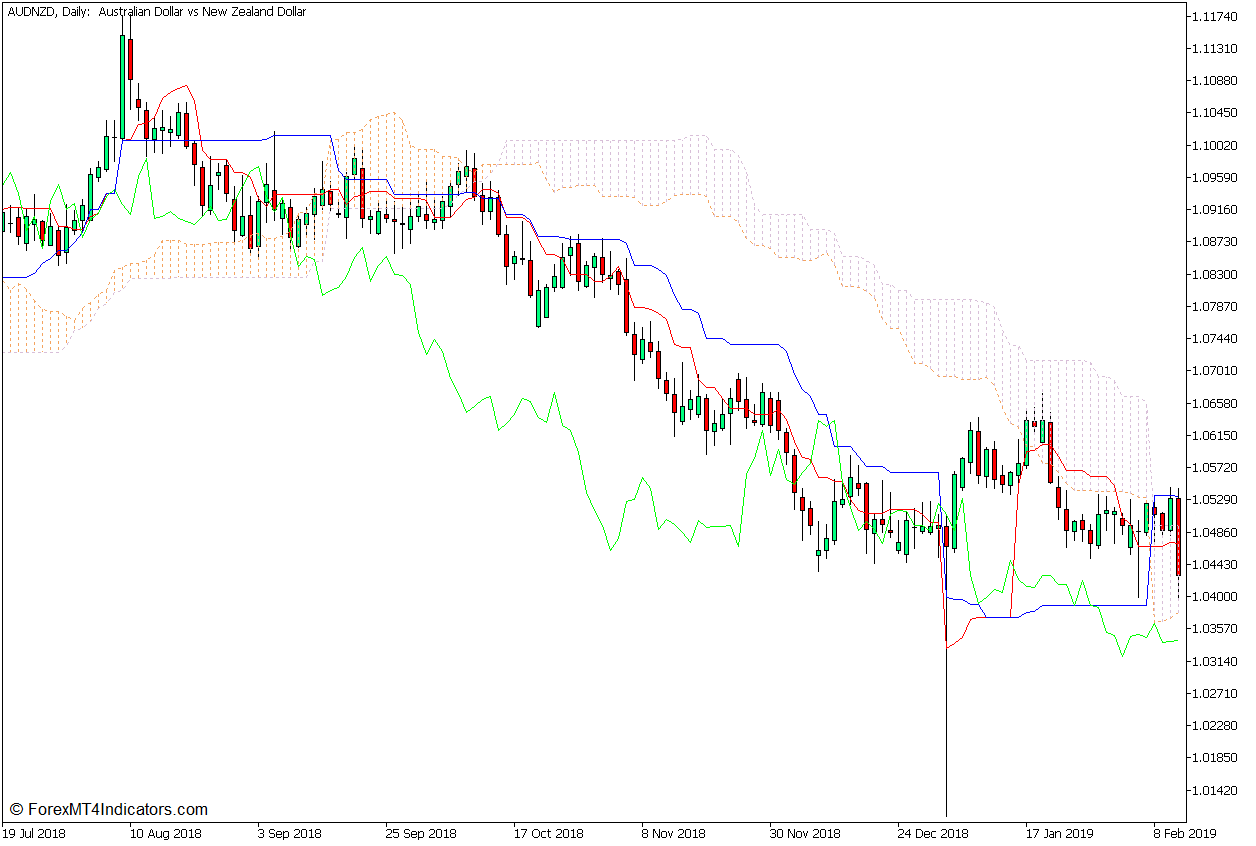
The Tenkan-sen, or Conversion Line, which is the red line on the chart, is the median of price over the past nine bars. It is calculated by adding the highest and lowest low of price action within a 9-bar window, then dividing the sum by two.
The Kijun-sen, also called the Base Line, which is represented by a blue line on the chart, is basically the median of price over a 26-bar period. It is computed by adding the highest high and lowest low of price over a 26-bar window and dividing the sum by two.
Both the Tenkan-sen and Kijun-sen represent the short-term trend direction, with the Tenkan-sen representing the shortest time horizon and the Kijun-sen representing a somewhat longer time horizon.
More often than not, traders use these two lines in conjunction with one another in order to properly identify the direction of the short-term trend. The short-term trend direction may be based on how the two lines overlap. The short-term trend direction is considered to be an uptrend whenever the Tenkan-sen is above the Kijun-sen, and in a downtrend whenever the Tenkan-sen is below the Kijun-sen line. As such, crossovers between the lines can also indicate a probable trend reversal.
Traders also use the area between the two lines as a dynamic area of support or resistance where price may pull back towards and bounce from whenever the market is trending. For this reason, some traders also use the Kijun-sen line as a basis for placing and trailing their stop loss.
T3 MA Alert Indicator
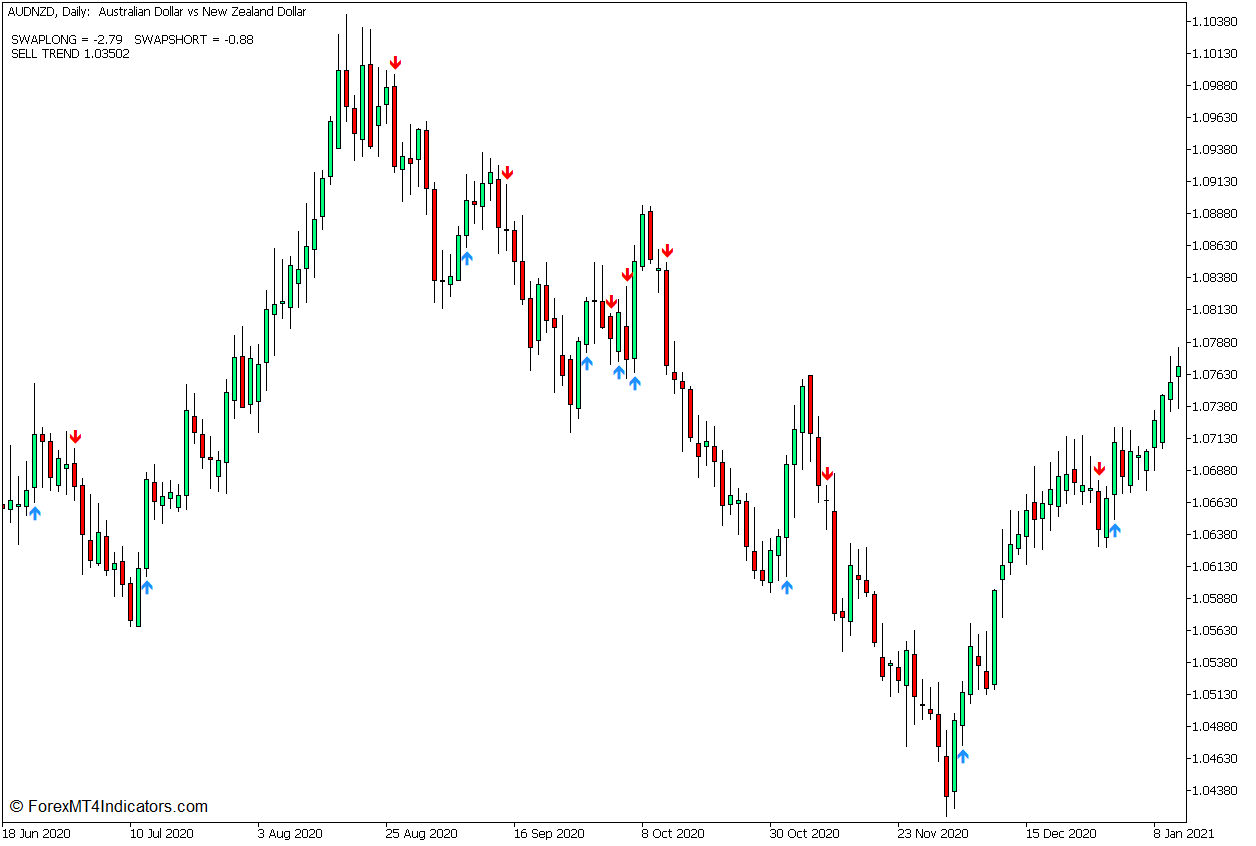
The T3 MA Alert indicator is a custom technical indicator, which is a trend or momentum-following signal indicator developed by Tim Tillson.
Most moving average lines have a tendency to be lagging, while some also tend to produce signals that are susceptible to false signals due to market noise. As such, many variations of the moving average line were developed in order to address these two issues. This indicator was also developed for this reason. It was intended to produce trend or momentum reversal signal indications based on a moving average line which is theoretically more responsive and smoother.
This indicator calculates its underlying moving average line derived from an Exponential Moving Average (EMA). It is in fact a weighted average of an Exponential Moving Average, a Double Exponential Moving Average (DEMA), and a Triple Exponential Moving Average (EMA). In theory, this should produce a line that responds faster and is smoother compared to other moving average lines.
This indicator identifies trend reversals based on crossovers between price action and its underlying moving average line. It then plots an arrow pointing in the direction of the new trend whenever it detects a trend or momentum reversal. It plots a dodger blue arrow pointing up whenever it detects a bullish momentum reversal, and a red arrow pointing down whenever it detects a bearish momentum reversal.
Trading Strategy Concept
This trading strategy is a simple trend reversal trading strategy that uses a basic crossover strategy to detect possible trend reversals. However, unlike most crossover trading strategies wherein the actual crossover of the lines is the basis for the trade entry, this strategy trades on the pullback right after the crossover.
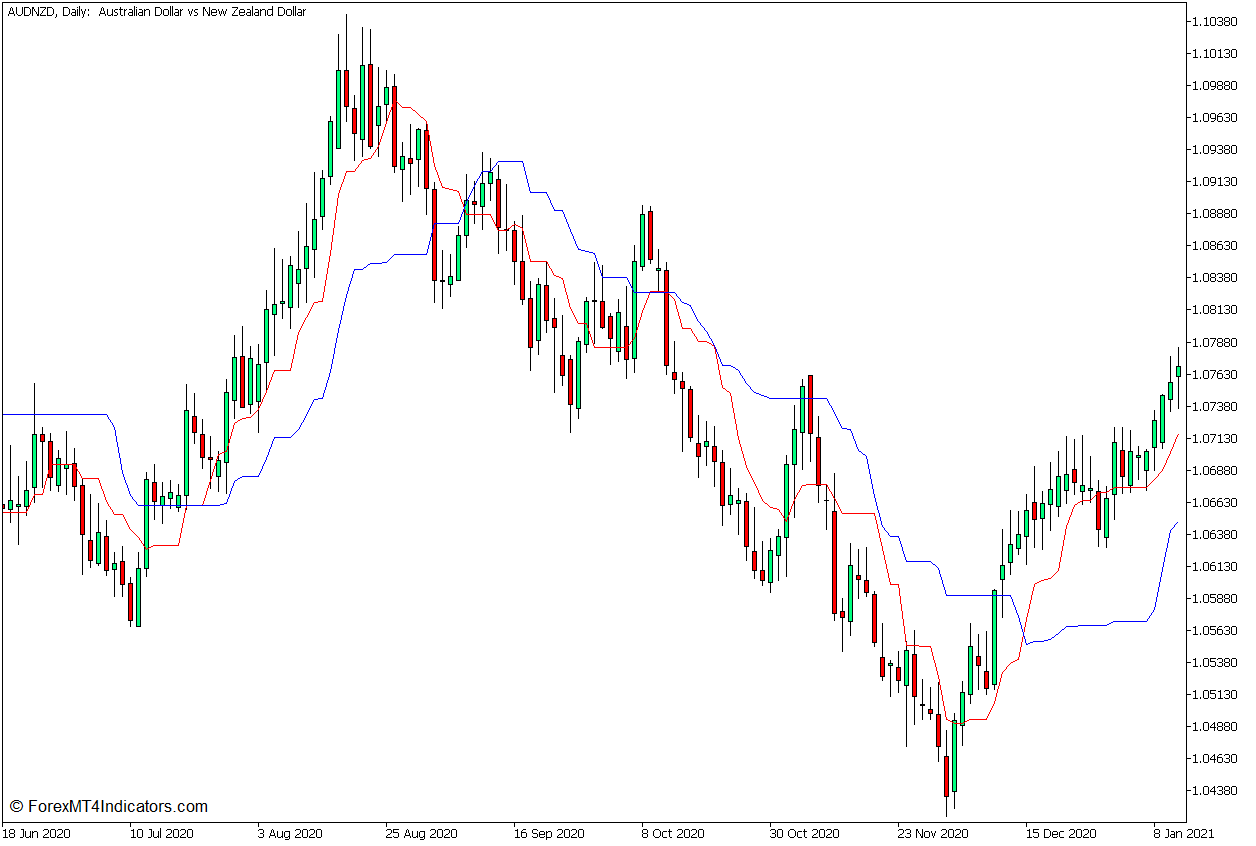
To implement this strategy, we will be using the Kijun-sen and Tenkan-sen lines, as well as the T3 MA Alert indicator.
The Kijun-sen and Tenkan-sen lines are used as the basis for the initial trend reversal signal. The direction of the trend reversal is identified based on the direction in which the Tenkan-sen line crosses over the Kijun-sen line. This occurs right after a price swing moving against the prior trend with a strong momentum.
The Tenkan-sen and Kijun-sen lines are then used for dynamic support and resistance. After the crossover, we are to wait for the pullback of price towards the area between the two lines.
The T3 MA Alert indicator is then used as the entry signal. This would be indicated by the first arrow that appears right after the price has pulled back within the area of the two lines in confluence with the direction of the trend reversal.
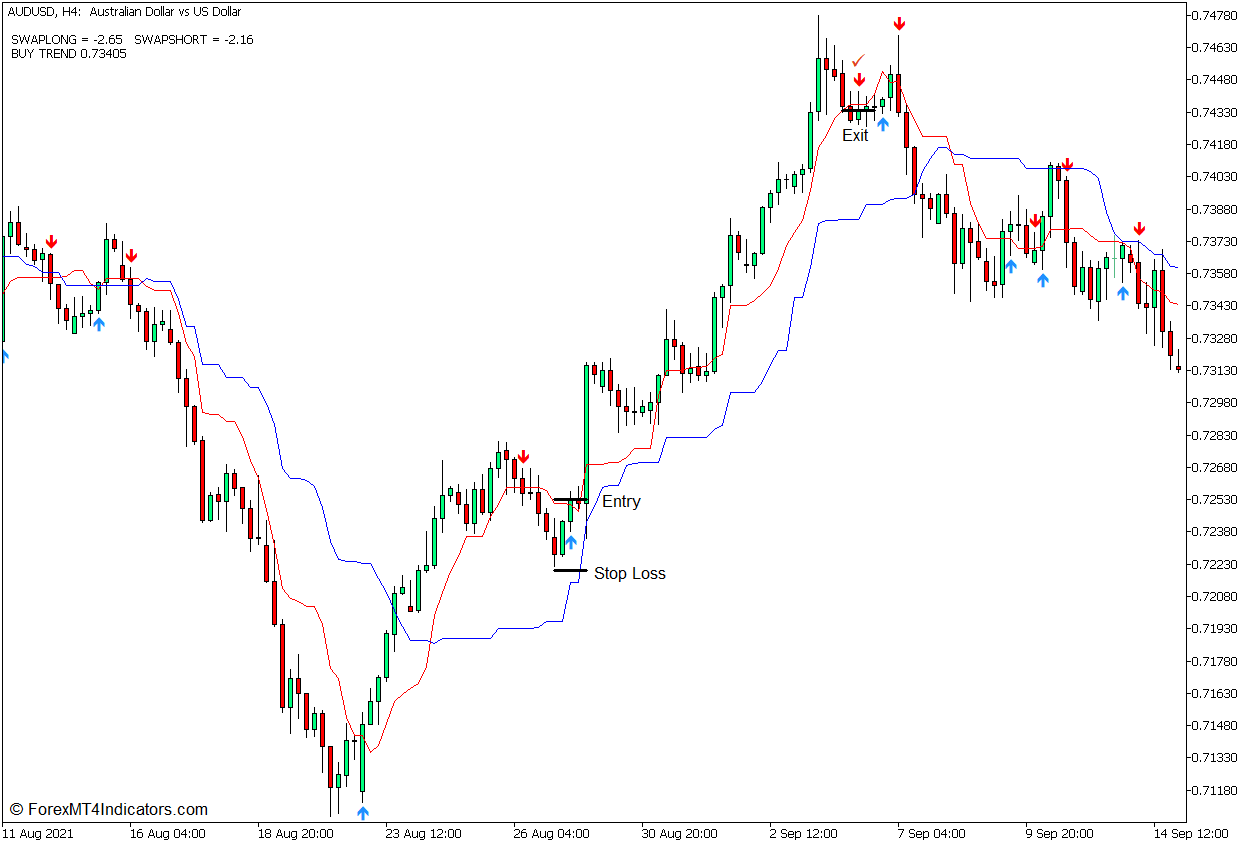
Buy Trade Setup
Entry
- The Tenkan-sen line should cross above the Kijun-sen line.
- Price action should pull back towards the area between the two lines.
- Open a buy order as soon as the T3 MA Alert indicator plots a dodger blue arrow pointing up.
Stop Loss
- Set the stop loss on the fractal below the entry candle.
Exit
- Close the trade as soon as the T3 MA Alert indicator plots a red arrow pointing down.
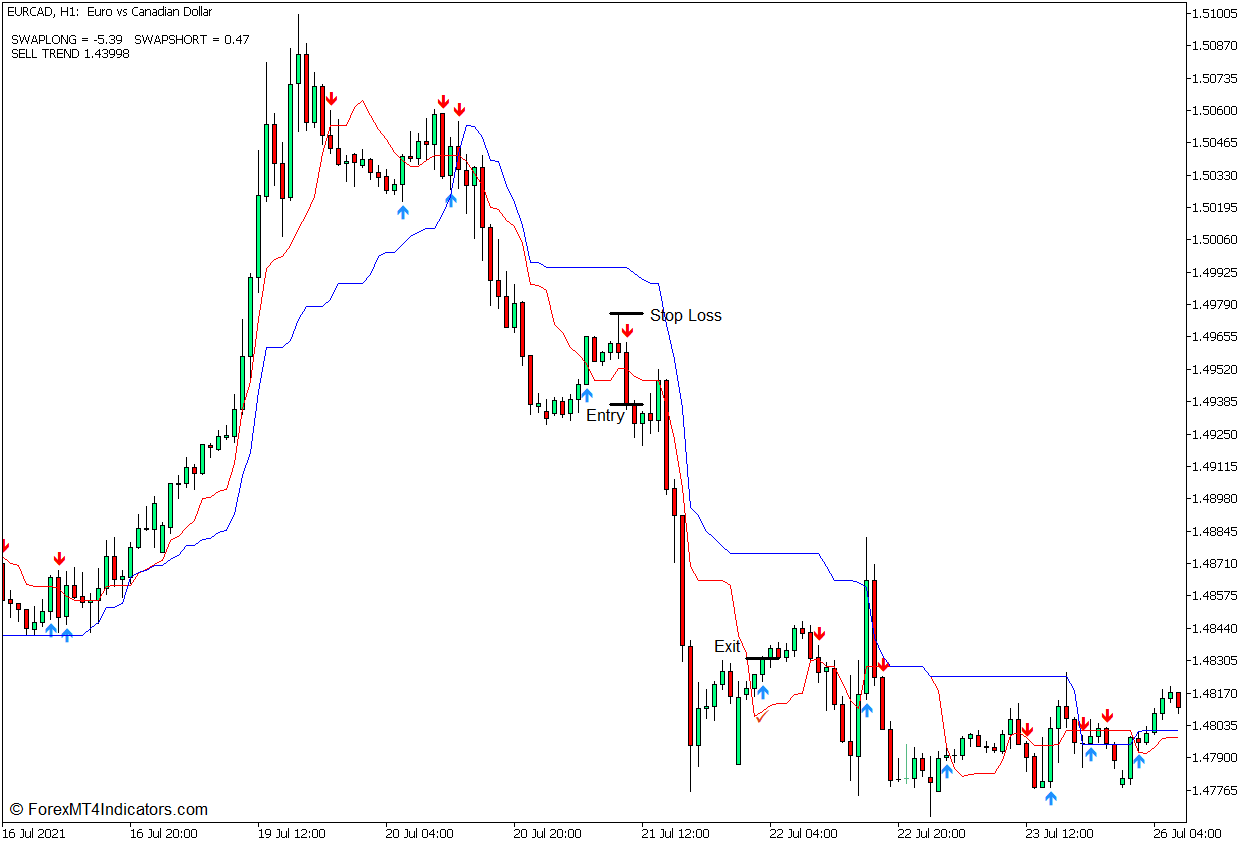
Sell Trade Setup
Entry
- The Tenkan-sen line should cross below the Kijun-sen line.
- Price action should pull back towards the area between the two lines.
- Open a sell order as soon as the T3 MA Alert indicator plots a red arrow pointing down.
Stop Loss
- Set the stop loss on the fractal above the entry candle.
Exit
- Close the trade as soon as the T3 MA Alert indicator plots a dodger blue arrow pointing up.
Conclusion
This trading strategy can be a very effective method for trading potential trend reversals. However, as with most trend reversal trading strategies, it should be used within the right market context. It should be used on an actual trend reversal, instead of a choppy or ranging market that is simply oscillating up and down erratically.
Recommended MT5 Brokers
XM Broker
- Free $50 To Start Trading Instantly! (Withdraw-able Profit)
- Deposit Bonus up to $5,000
- Unlimited Loyalty Program
- Award Winning Forex Broker
- Additional Exclusive Bonuses Throughout The Year

>> Sign Up for XM Broker Account here <<
FBS Broker
- Trade 100 Bonus: Free $100 to kickstart your trading journey!
- 100% Deposit Bonus: Double your deposit up to $10,000 and trade with enhanced capital.
- Leverage up to 1:3000: Maximizing potential profits with one of the highest leverage options available.
- ‘Best Customer Service Broker Asia’ Award: Recognized excellence in customer support and service.
- Seasonal Promotions: Enjoy a variety of exclusive bonuses and promotional offers all year round.

>> Sign Up for FBS Broker Account here <<
Click here below to download: