


One of the key factors for identifying a proper reversal trade setup is in finding the correct areas where the market is more likely to reverse. These areas are commonly known as support and resistance areas or zones. Seasoned traders would often consider a market reversal signal only when the reversal signal is a reaction to a support or resistance zone.
The strategy discussed below shows us how we could trade market reversals as a reaction to a support or resistance zone using just two technical indicators.
HL Cross Signal for WPR
HL Cross Signal for WPR is a customized momentum technical indicator that was developed to help traders identify trend and momentum direction, its potential reversal signals, as well as the logical stop loss and take profit levels for each signal.
This indicator is based on two underlying technical indicators, namely the William’s Percentage Range (WPR) and the Heiken Ashi Candlesticks.
William’s Percentage Range is an oscillator type of technical indicator developed by Larry Williams and George Lane. This trading tool helps traders determine whether the market is overbought or oversold based on the market’s ability to close near the edge of its identified trading range within a given period. It also helps traders identify potential market reversals coming from such overextended market prices.
The Heiken Ashi Candlesticks on the other hand is also another momentum indicator that is often used to identify market reversals. It modifies the basic price chart by converting the open and close of each price bar to an average price, which results in bars that change color only when the market’s momentum has changed.
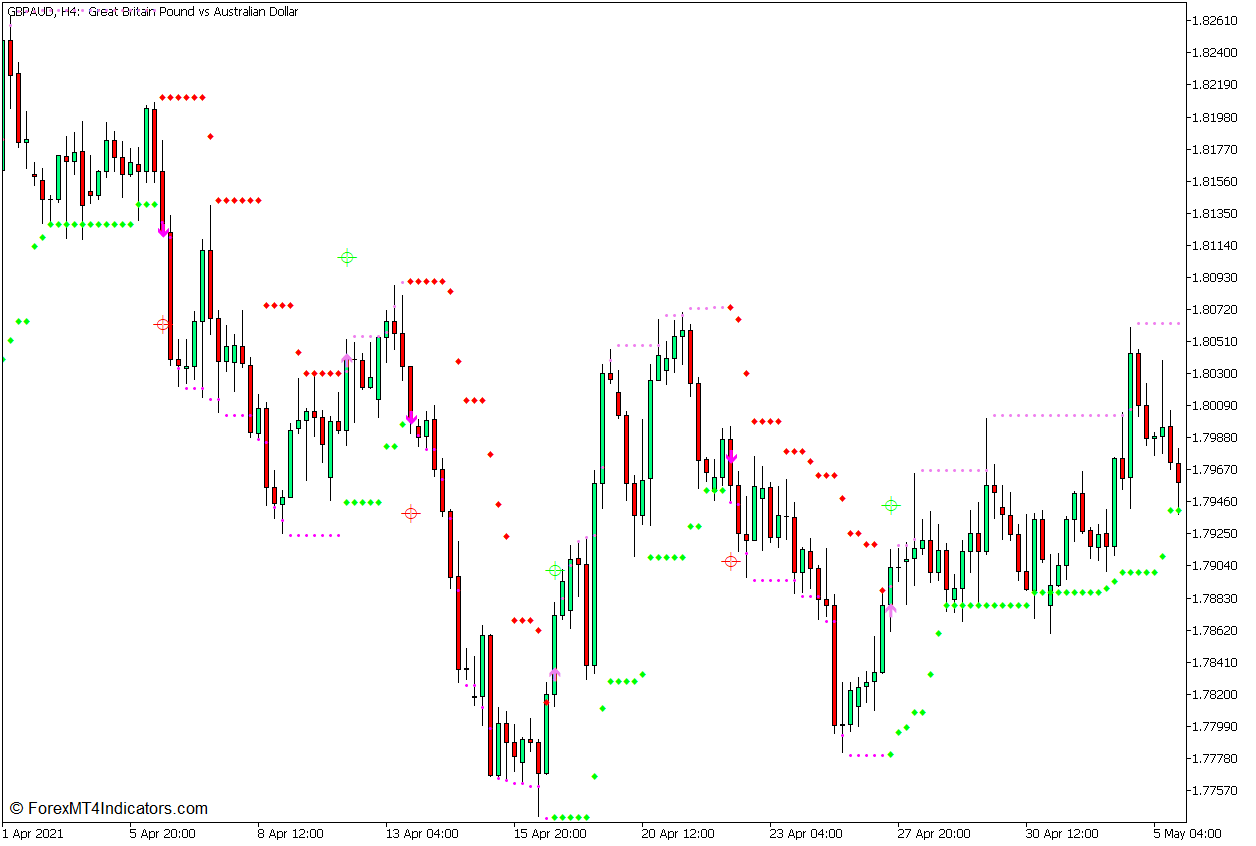
The HL Cross Signal for WPR identifies its trend and momentum direction based on the two underlying indicators discussed above. It then plots arrows pointing in the direction of the momentum whenever it detects a potential market reversal. It also plots dots against the direction of the momentum which may be used as a stop loss level, as well as dots towards the direction of the momentum which can be used to take profit target levels.
In this example, the indicator plots lime dots to indicate buy stops and red dots to indicate sell stops. It also plots magenta dots to indicate sell-take profit levels and violet dots to indicate buy-take profit levels. Users may however modify the colors depending on their preference.
Zigzag Color Indicator
The Zigzag Color indicator was developed to help traders identify price swings, and market structure, as well as the support and resistance areas of the market.
Price often moves in a sequence of price swings, creating swing highs and swing lows as it oscillates on the price chart. The Zigzag Color indicator’s main function is to identify the said swing highs and swing lows which is very important to traders who prefer looking at market structure.
The Zigzag Color indicator starts its process by setting a threshold percentage level. This threshold triggers the indicator to detect valid swing highs and swing lows based on price moving against a prior market swing that exceeds the threshold percentage. For example, if the threshold is set at 5% and the market’s last price movement is an upward market swing, the indicator would detect the swing high if the price would move downwards against the prior market swing by more than 5%.
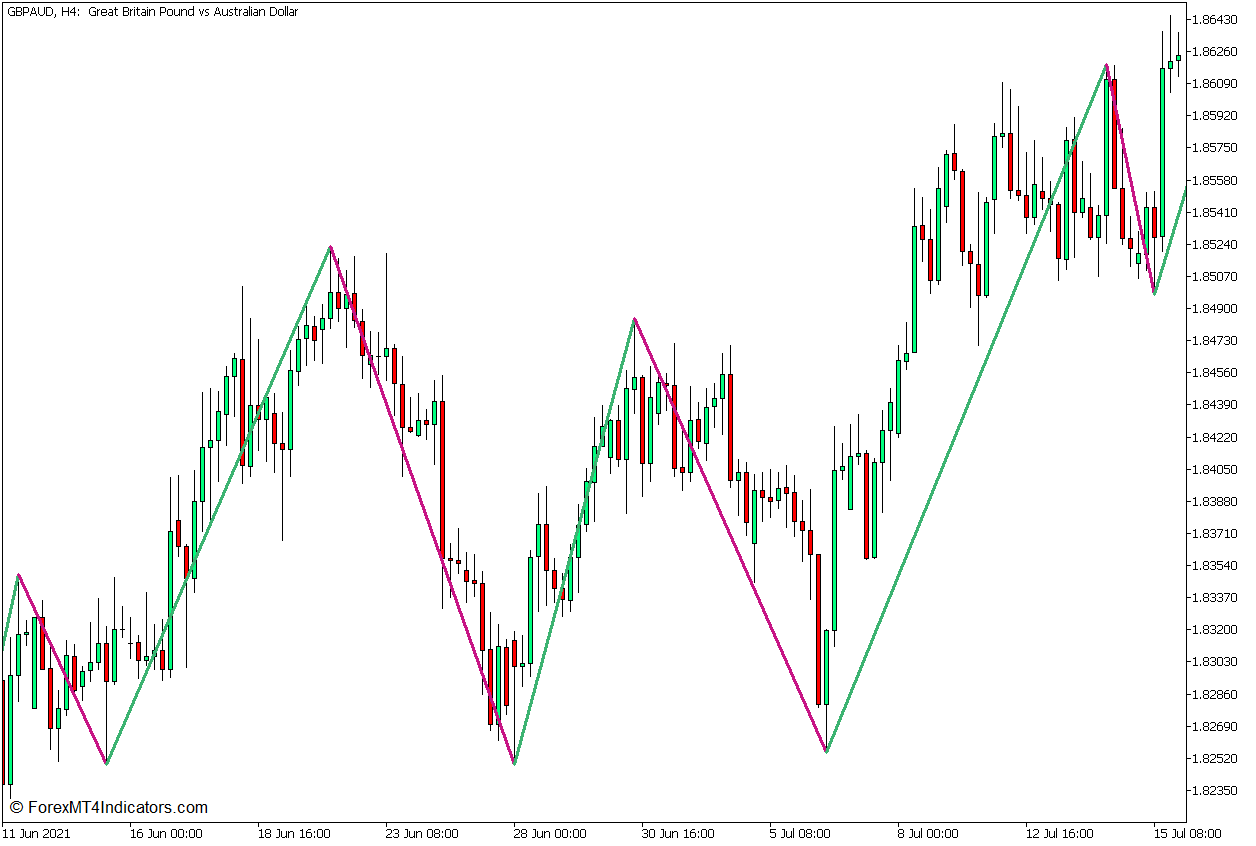
The indicator then marks the swing high point and connects it to the prior swing low level. This process is repeated again and again connecting swing highs and swing lows. This results in a price chart with a zigzag line that connects the price swings, thus it is called the Zigzag Color indicator.
This version also changes the color of the line based on the direction of the price swing. It plots a medium violet red line whenever the price swing is downwards and a medium sea green line whenever the price swing is upwards.
Trading Strategy Concept
This trading strategy is a reversal trading strategy that trades on market reactions around support and resistance areas. It uses the two technical indicators discussed above to help traders identify the key support and resistance areas, and time the market entries based on a market reversal signal.
The support and resistance areas are horizontal support and resistance zones which are based on swing highs and swing lows. The Zigzag Color indicator is used to identify the valid swing highs and swing lows. The congestion area of the swing highs and swing lows are then used as the basis for the support and resistance zones.
As price enters the support and resistance zone, we could then start to observe whether the market would continue and break the support and resistance zone or reverse from it. The HL Cross Signal for the WPR indicator is used to objectively identify the market reversals from the zone. Trades are opened whenever the HL Cross Signal for WPR indicates that the market has reversed.
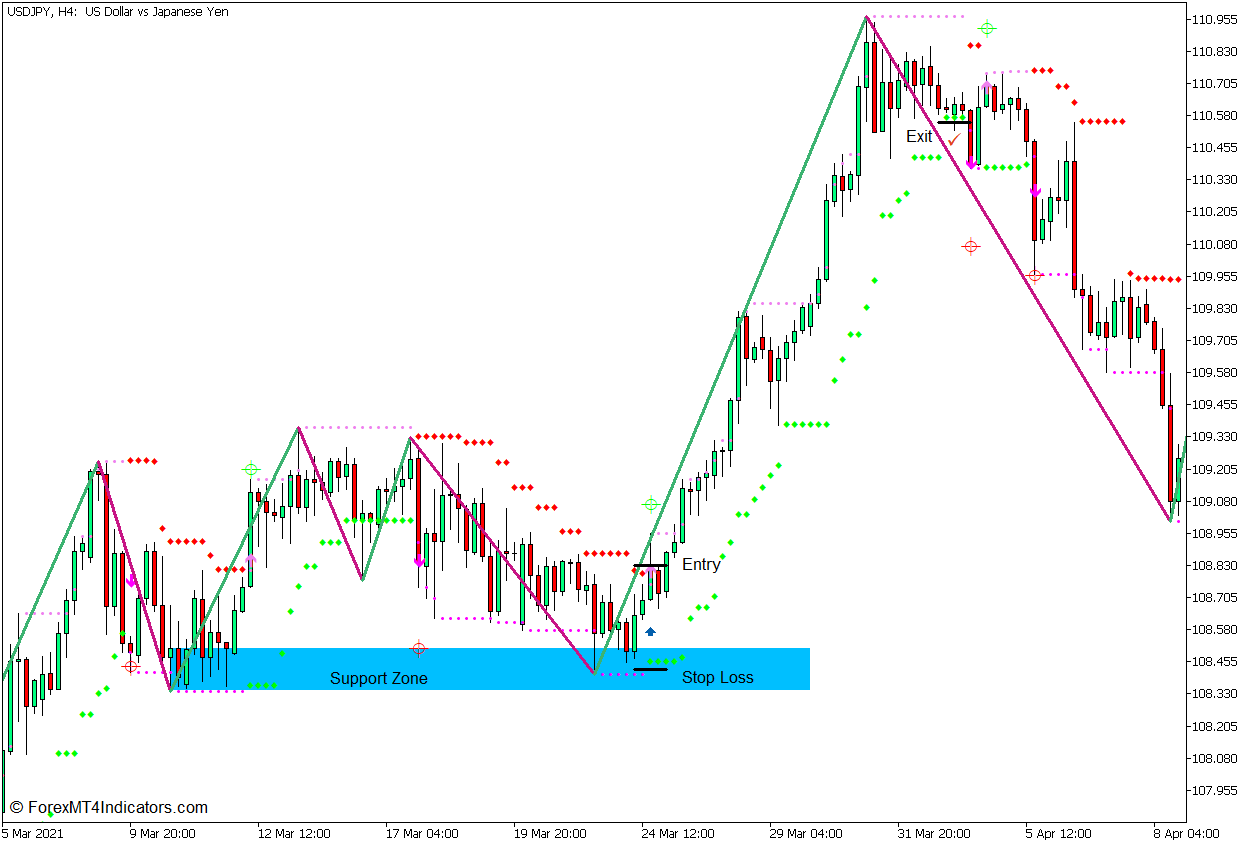
Buy Trade Setup
Entry
- Identify a Support Zone based on the swing low indicated by the Zigzag Color indicator.
- Wait for the price to enter the Support Zone.
- Open a buy order as soon as the HL Cross Signal for the WPR indicator plots an arrow pointing up.
Stop Loss
- Set the stop loss below the lime dots.
Exit
- Trail the stop loss below the lime dots until stopped out in profit.
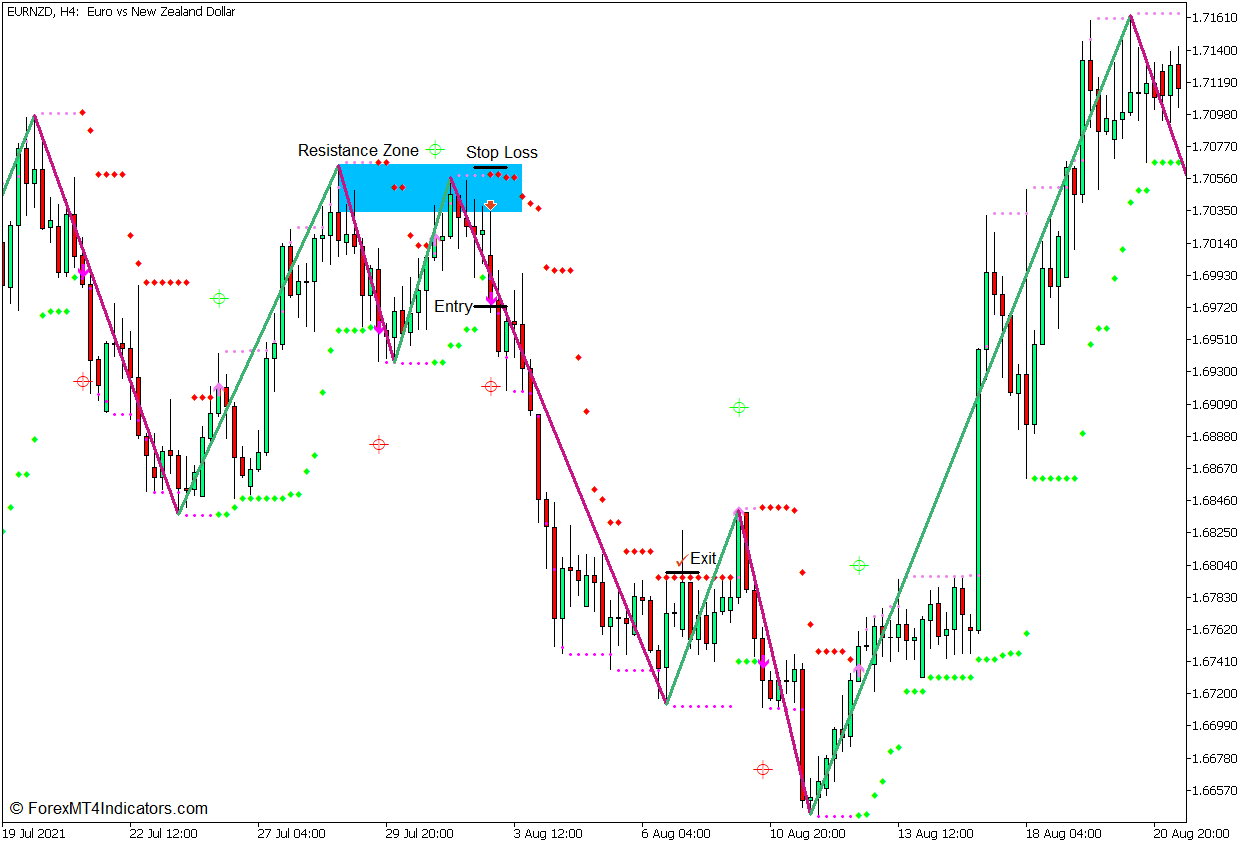
Sell Trade Setup
Entry
- Identify a Resistance Zone based on the swing high indicated by the Zigzag Color indicator.
- Wait for the price to enter the Resistance Zone.
- Open a sell order as soon as the HL Cross Signal for the WPR indicator plots an arrow pointing down.
Stop Loss
- Set the stop loss above the red dots.
Exit
- Trail the stop loss above the red dots until stopped out in profit.
Conclusion
This trading strategy is a high probability trading strategy given that the market reversal signals are merely a confirmation of an assumption that the market would reverse from a support or resistance zone. However, there are some scenarios wherein the market reversal signal would come in late and the market has already moved a considerable distance. In such cases, it is best to let go of the trade opportunity. Still, this strategy may provide excellent trading opportunities if used correctly.
Recommended MT5 Brokers
XM Broker
- Free $50 To Start Trading Instantly! (Withdraw-able Profit)
- Deposit Bonus up to $5,000
- Unlimited Loyalty Program
- Award Winning Forex Broker
- Additional Exclusive Bonuses Throughout The Year

>> Sign Up for XM Broker Account here <<
FBS Broker
- Trade 100 Bonus: Free $100 to kickstart your trading journey!
- 100% Deposit Bonus: Double your deposit up to $10,000 and trade with enhanced capital.
- Leverage up to 1:3000: Maximizing potential profits with one of the highest leverage options available.
- ‘Best Customer Service Broker Asia’ Award: Recognized excellence in customer support and service.
- Seasonal Promotions: Enjoy a variety of exclusive bonuses and promotional offers all year round.

>> Sign Up for FBS Broker Account here <<
Click here below to download: