


Price spikes and unusually strong market runs are market scenarios that can provide excellent trading opportunities for the discerning trader. However, most traders see it as a very strong momentum and would often trade it incorrectly by chasing price. Others wisely try to avoid trading such market scenarios knowing that chasing price is never a good idea.
However, some profit from the market by trading the reversals that come after such price spikes. This is because prices do tend to be overbought or oversold after such a price spike. This in turn causes the market to correct itself by trying to rebalance price.
This trading strategy shows us how we can trade a market reversal setup right after a strong price spike using the Fractal MFI Indicator and the Heiken Ashi Candlesticks.
Heiken Ashi Indicator
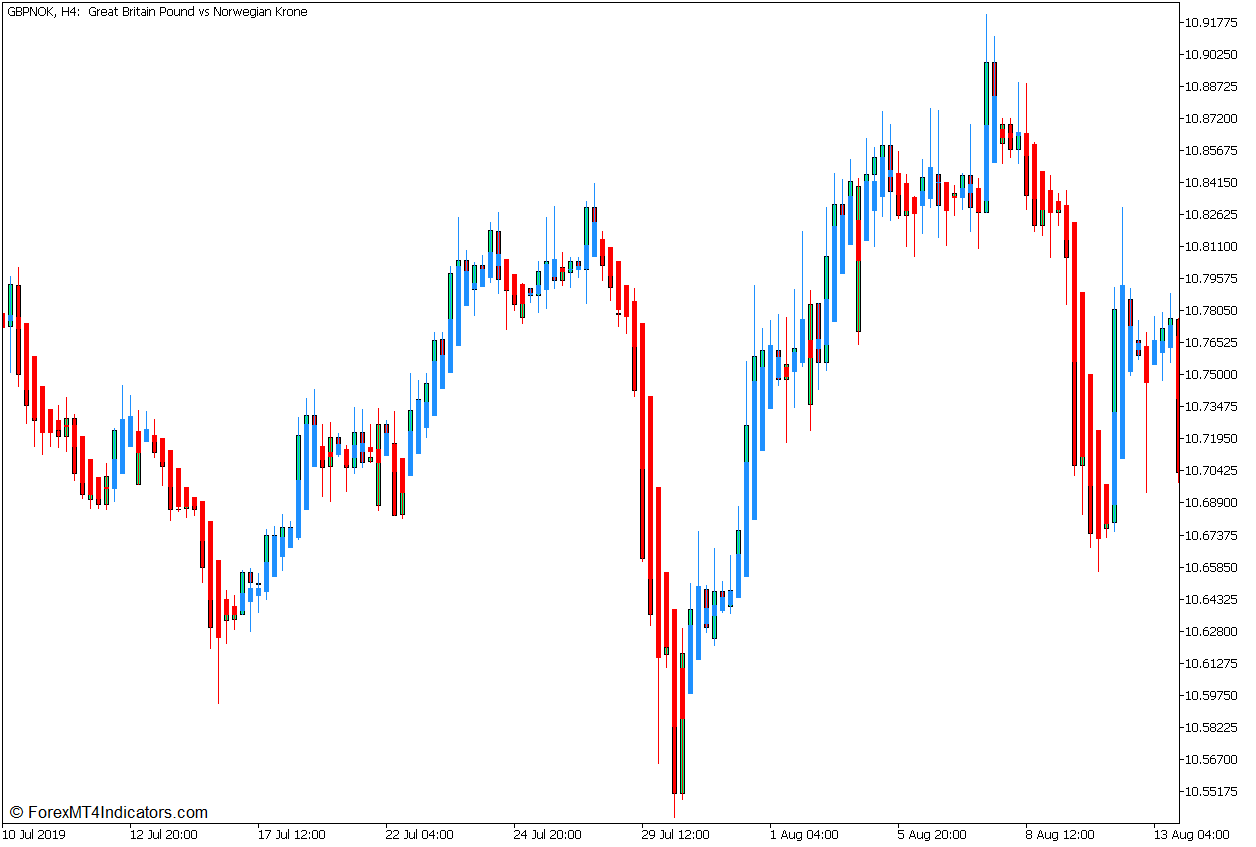
The word Heiken Ashi means “average bars” when translated from Japanese, and the Heiken Ashi Indicator is aptly named as such.
The Heiken Ashi Indicator or Heiken Ashi Candlesticks is a technical indicator that modifies how the basic price candle is formed to help traders easily identify the direction of the trend. The open and close levels of each price candle is modified based on average price movements so that the price candle would reverse and change color only when the indicator detects a momentum reversal.
This indicator modifies the opening of the candle so that it becomes the average of the actual Open and Close Price of the previous price candle.
Open = (Open of Previous Bar + Close of Previous Bar) / 2
It also modifies the Close of the candle making it the average of the actual Open, High, Low, and Close of the current price candle.
Close = (Open + High + Low + Close) / 4
The Highs and Lows of its bars typically remain the same.
High = Max [High, Open, Close]
Low = Min [Low, Open, Close]
These modifications result in a price chart wherein the candles only change color whenever the average of each candle has shifted directions. This then allows traders to easily decipher the direction of the market momentum and detect possible momentum reversals.
Traders may use the Heiken Ashi Indicator in conjunction with an actual Japanese Candlestick Chart. This would allow traders to easily identify the market structure, as well as the characteristics of price action.
Many traders use the Heiken Ashi Candlesticks as a momentum reversal entry signal based on the changing of the color of its bars. This is often used within the context of confluences between trade signals.
Fractal Money Flow Index (MFI) Indicator
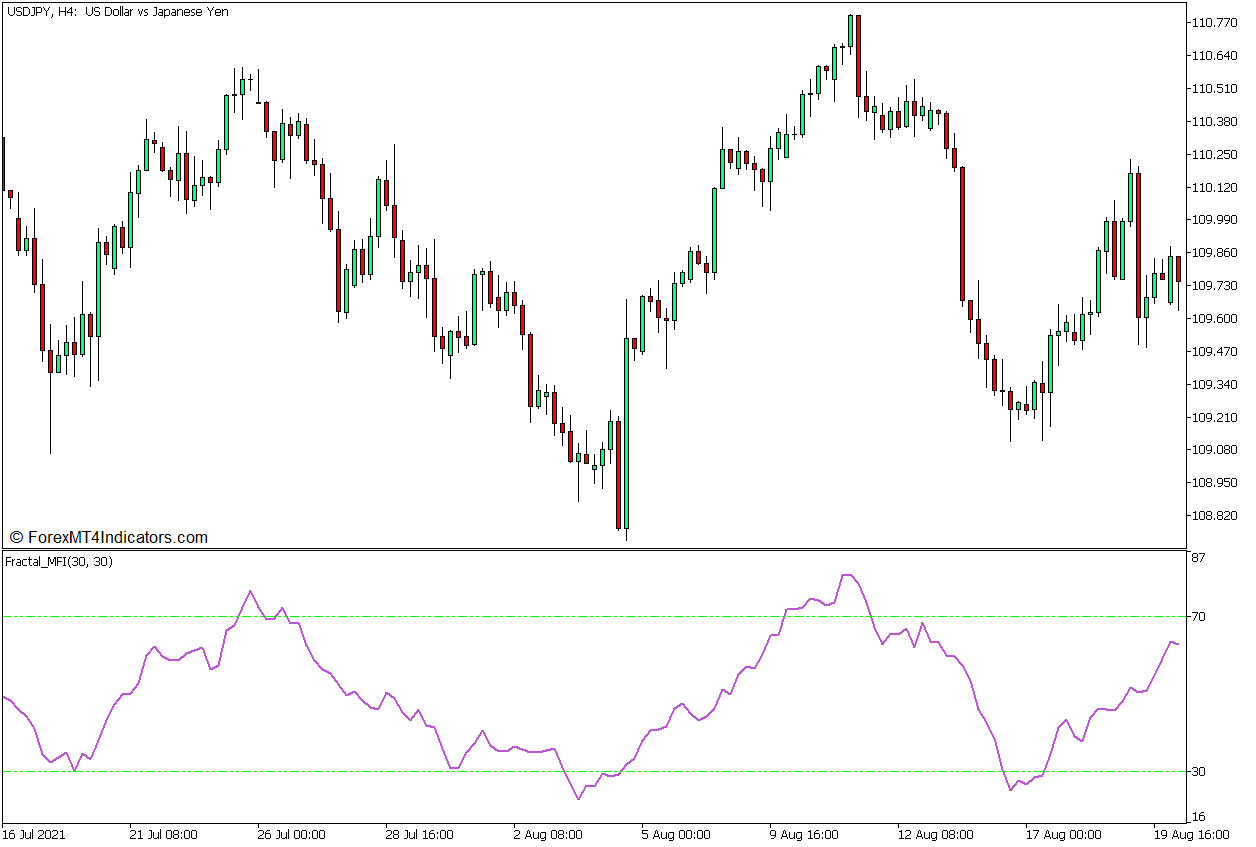
The Fractal MFI Indicator or Fractal Money Flow Index Indicator is a momentum technical indicator that uses price and volume data to create an oscillator. This oscillator line can be used to objectively identify oversold and overbought markets, which can be high probability mean reversal opportunities and effectively observe the direction of the market momentum.
The Fractal MFI Indicator has some similarities with the Relative Strength Index (RSI) indicator because it also plots an oscillator line that oscillates within a fixed range of 0 to 100. Their difference lies in the fact that the Fractal MFI Indicator uses volume and price when calculating momentum.
The Money Flow Index (MFI) calculation begins by calculating the Money Flow Ratio. It is a ratio between the Positive Money Flow and Negative Money Flow over a given period.
Money Flow Ratio = n-Period Positive Money Flow / n-Period Negative Money Flow.
It also calculates for the Raw Money Flow, which is the product of the Typical Price and Volume.
Typical Price = (High + Low + Close) / 3
Raw Money Flow = Typical Price x Volume
Using these variables, it then calculates the Money Flow Index.
Money Flow Index = 100 – [100 / (1 + Money Flow Ratio)]
The Fractal MFI Indicator has markers at levels 30 and 70, which serve as thresholds for its normal range. Fractal MFI values dropping below 30 indicate an oversold market, while values breaching above 70 indicate an overbought market. Both market scenarios are prime conditions for a potential mean reversal especially when in confluence with price action.
Trading Strategy Concept
This trading strategy is a Reversal Trading Strategy which trades based on a confluence of an oversold or overbought market condition and a momentum reversal signal coming from such market conditions.
The Fractal MFI Indicator is used to identify the oversold or overbought market conditions. This can be objectively identified whenever the Fractal MFI line drops below 30 or breaches above 70.
As soon as these conditions are met, we could then observe the momentum reversal signal indicating that the price might start to reverse in the opposite direction to rebalance an oversold or overbought price level.
The Heiken Ashi Candlesticks is the tool that we will use to objectively identify the momentum reversals. These momentum reversal signals are based on the changing of the color of the bars that it plots.
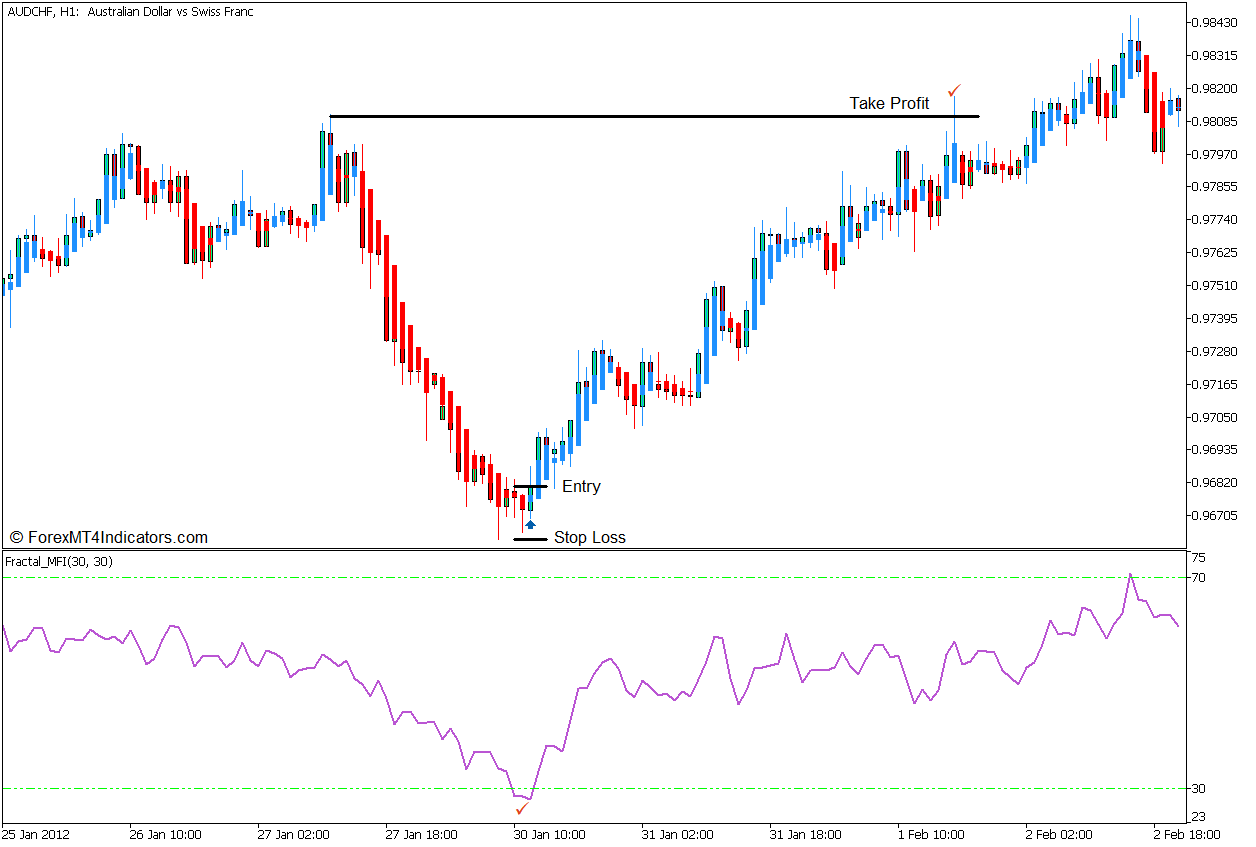
Buy Trade Setup
Entry
- The Fractal MFI line should drop below 30 indicating an oversold market.
- Open a buy order as soon as the Heiken Ashi Candlesticks change to dodger blue indicating a bullish momentum reversal.
Stop Loss
- Set the stop loss on the fractal below the entry candle.
Exit
- Set the take profit on the next logical swing high which price could potentially reach.
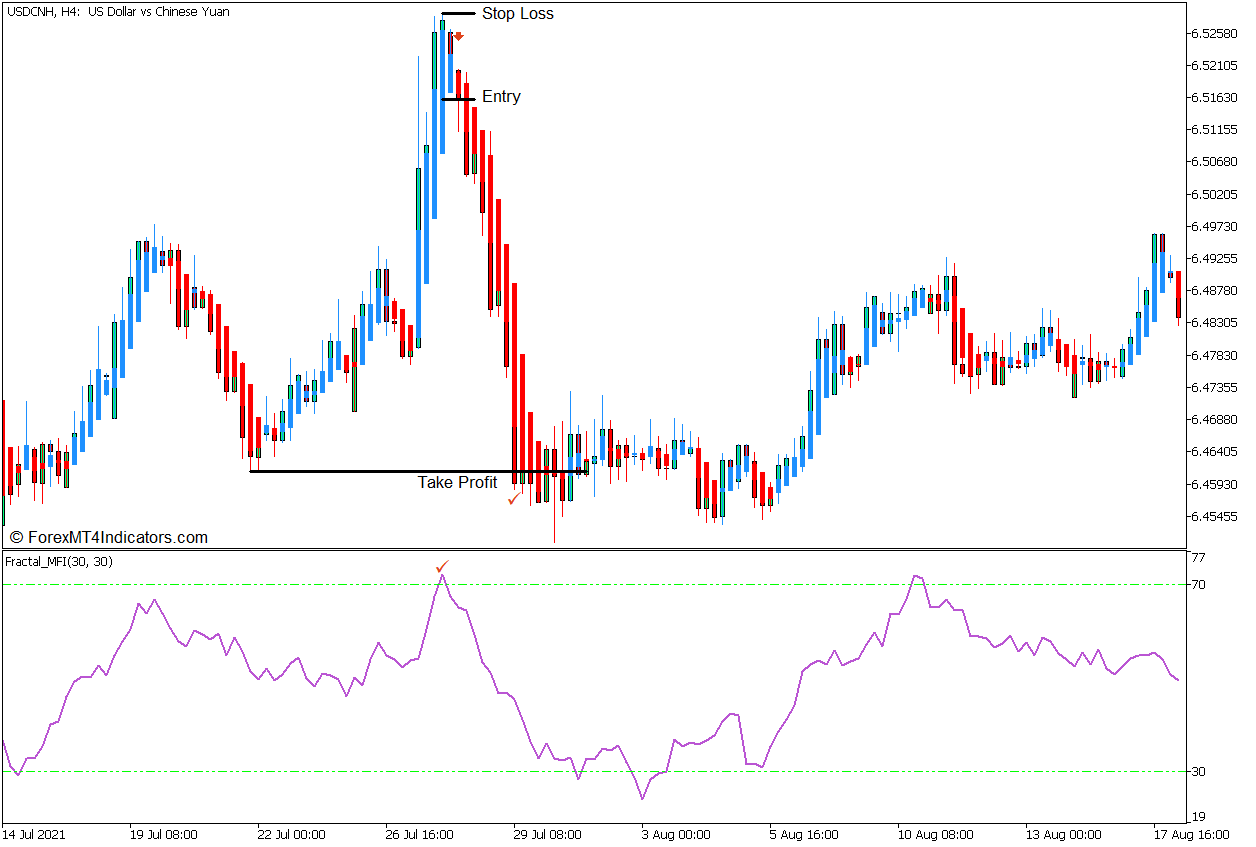
Sell Trade Setup
Entry
- The Fractal MFI line should breach above 70 indicating an overbought market.
- Open a sell order as soon as the Heiken Ashi Candlesticks change to red indicating a bearish momentum reversal.
Stop Loss
- Set the stop loss on the fractal above the entry candle.
Exit
- Set the take profit on the next logical swing low which price could potentially reach for.
Conclusion
This trading strategy is a reversal trading strategy that works best as a means to trade on the reversal that occurs right after a strong market spike. These market conditions are best identified by observing price action. The technical indicators used in this strategy are just tools that help make identifying such market conditions easier. The indicators may provide oversold or overbought signals, but it would still be best to confirm the trade scenario based on what you see on the price chart. Traders who could use these signals in tandem with price action have a good chance of profiting from the market during such market reversals.
Recommended MT5 Brokers
XM Broker
- Free $50 To Start Trading Instantly! (Withdraw-able Profit)
- Deposit Bonus up to $5,000
- Unlimited Loyalty Program
- Award Winning Forex Broker
- Additional Exclusive Bonuses Throughout The Year

>> Sign Up for XM Broker Account here <<
FBS Broker
- Trade 100 Bonus: Free $100 to kickstart your trading journey!
- 100% Deposit Bonus: Double your deposit up to $10,000 and trade with enhanced capital.
- Leverage up to 1:3000: Maximizing potential profits with one of the highest leverage options available.
- ‘Best Customer Service Broker Asia’ Award: Recognized excellence in customer support and service.
- Seasonal Promotions: Enjoy a variety of exclusive bonuses and promotional offers all year round.

>> Sign Up for FBS Broker Account here <<
Click here below to download: