


Reversal trading strategies are the type of strategy that do not usually have a very high win rate. However, where it shines is in its ability to produce very high yields about the risk you place on a trade. This is because reversal trading strategies assume that the prior trend or momentum has ended and that the market would instantly reverse in the opposite direction forming a new trend or momentum.
If you were correct on this assumption, then you would have entered a trade that would immediately move in the direction you traded with the least amount of risk and as much profit as the market would run for.
That is if you were correct on this assumption. However, this is not always the case. Anticipating and predicting reversals is very difficult because you are trading against a prior established trend or momentum and you are stepping in front of it hoping that it would reverse. As such, it is a very high-risk type of trade setup.
There are ways to significantly increase your chances of getting a reversal trade right. One is to look for reversal trades on major support or resistance levels. Another is to trade based on a confirmed reversal signal.
You could also anticipate trades only when the market is either overbought or oversold as it does tend to reverse strongly on such conditions. You could also trade on a confluence of these signals, which would significantly increase the probability of a winning trade.
This reversal trading strategy trades on extremely overbought or oversold markets with confirmed reversal signals using the Stochastic RSI Indicator and the Patterns on the Chart Indicator.
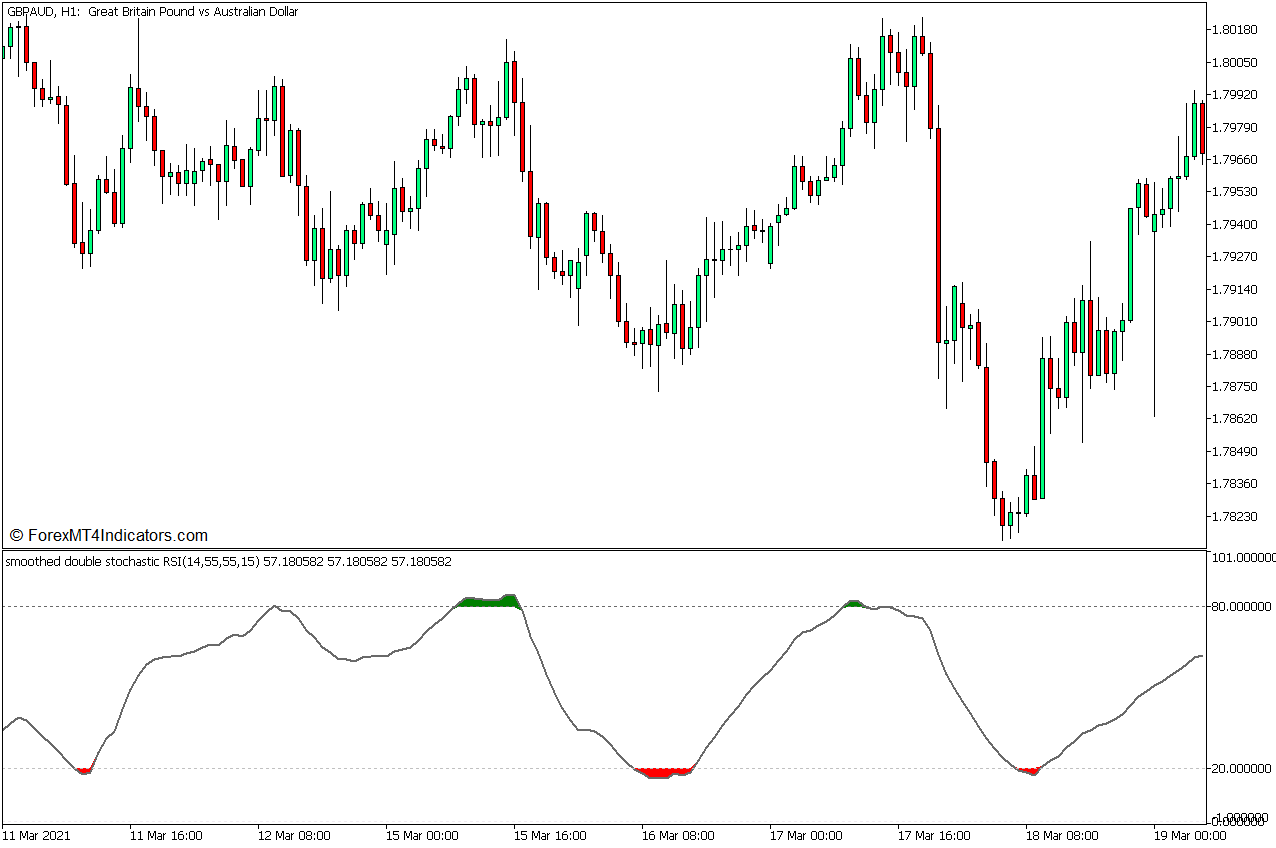
Stochastic RSI
The Stochastic RSI Indicator is a custom indicator that incorporates the Stochastic Oscillator in the computation of the Relative Strength Index (RSI).
The classic RSI computes momentum based on upward price change and downward price change using the close of the price bar as its basis. This formula creates an oscillator which is very responsive to price changes yet could also be very erratic if the market is choppy.
The Stochastic RSI indicator has an algorithm that uses a formula that is closely related to the Stochastic Oscillator applied to the RSI line. It is in fact a double-smoothed stochastic applied on the RSI. The result is an oscillator that plots a very smooth line that oscillates within the range of zero to 100.
The Stochastic RSI range has markers at levels 20 and 80 similar to the classic Stochastic Oscillator. The levels above 80 are indicative of an overbought market, while levels below 20 are indicative of an oversold market. The indicator also conveniently colors the area between the line and the markers to help identify oversold and overbought markets. A red color indicates an oversold market while a green color indicates an overbought market, both of which are prime conditions for a potential mean reversal.
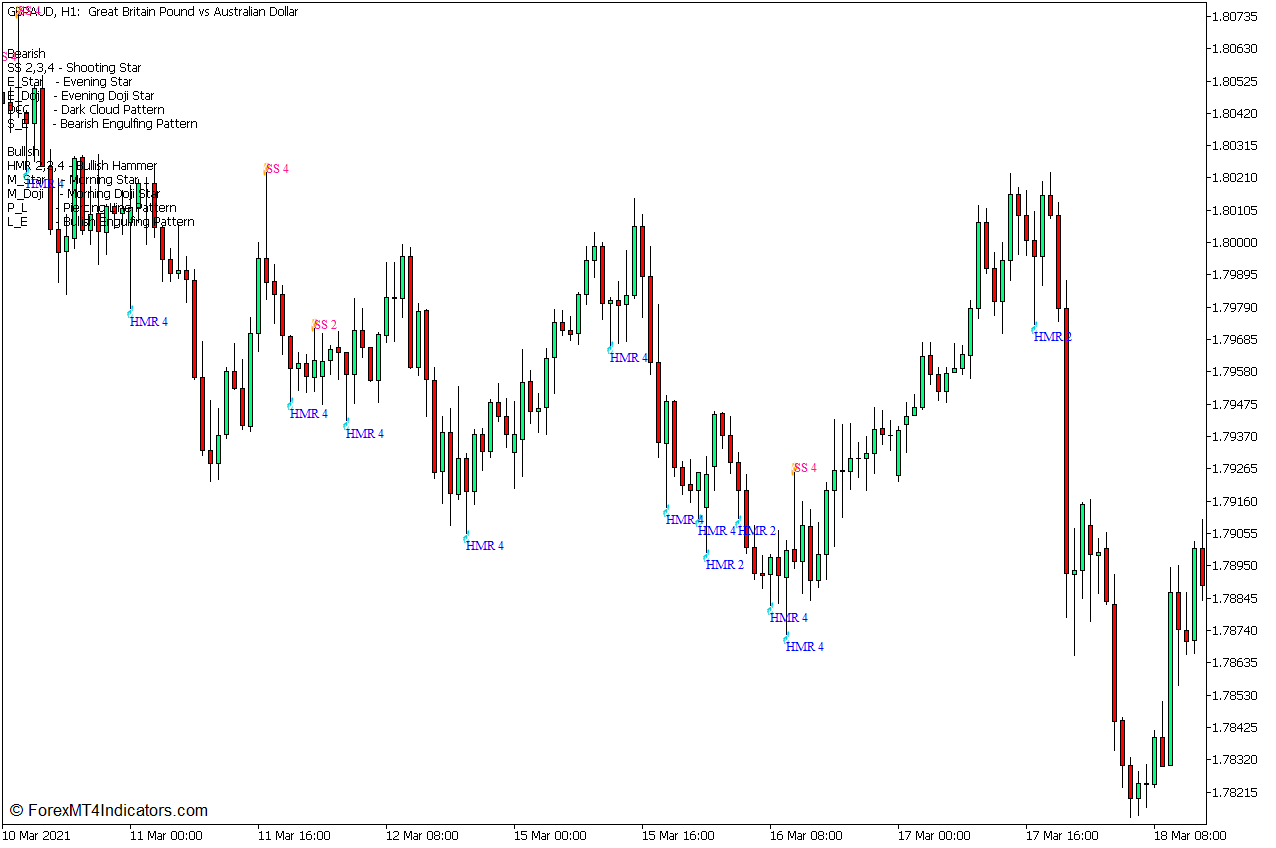
Patterns on Chart – Hammer and Shooting Star
The Patterns on Chart indicator is a custom technical indicator that automatically identifies and indicates reversal candlestick patterns available on the price chart.
It uses a set of algorithms that objectively identifies reversal candlestick patterns based on the characteristic descriptions unique to each pattern.
The indicator labels each pattern identified with a short-hand name placed beside it. It also displays the corresponding full name of the pattern on the upper left corner of the chart for easy reference.
This template uses a Patterns on Chart setup which identifies only Shooting Star and Hammer patterns for a cleaner price chart.
Trading Strategy Concept
This trading strategy is a reversal trading strategy that trades on the confluence of an oversold or overbought market and a reversal candlestick pattern.
The oversold and overbought markets are identified based on the Stochastic RSI indicator, based on the appearance of the green or red color as the line oscillates outside the 20 to 80 range. These conditions give us an indication that the price may reverse.
The actual reversal signal is then based on the appearance of candlestick patterns, particularly the Shooting Star and Hammer patterns. These patterns are identified and confirmed using the Patterns on Chart indicator.
The trade target is then set at a major support or resistance level in the direction of the trade.
Buy Trade Setup
Entry
- The Stochastic RSI line should drop below 20 while the red color appears indicating an oversold market.
- The Patterns on the Chart indicator should identify a hammer pattern while the market is still oversold.
- Open a buy order on the confluence of these bullish reversal indications.
Stop Loss
- Set the stop loss on the support below the entry candle.
Exit
- Set the take profit target on a major resistance above the entry candle and allow the price to reach the target.
Sell Trade Setup
Entry
- The Stochastic RSI line should breach above 80 while the green color appears indicating an overbought market.
- The Patterns on the Chart indicator should identify a shooting star pattern while the market is still overbought.
- Open a sell order on the confluence of these bearish reversal indications.
Stop Loss
- Set the stop loss on the resistance above the entry candle.
Exit
- Set the take profit target on a major support below the entry candle and allow the price to reach the target.
Conclusion
This trading strategy is a type of trading strategy that relies on high-risk reward ratios. It is not always correct but when it is, traders could earn yields which are several multiples compared to the risk they placed on their stop loss.
There would also be times when the market would reverse even before reaching the next support or resistance level. As such, active trade management would also help which would allow traders to lock in profits as the price moves in the direction of the trade.
When used correctly, this trading strategy should allow for high-yielding trades which could make traders profitable over the long term.
Recommended MT5 Brokers
XM Broker
- Free $50 To Start Trading Instantly! (Withdraw-able Profit)
- Deposit Bonus up to $5,000
- Unlimited Loyalty Program
- Award Winning Forex Broker
- Additional Exclusive Bonuses Throughout The Year

>> Sign Up for XM Broker Account here <<
FBS Broker
- Trade 100 Bonus: Free $100 to kickstart your trading journey!
- 100% Deposit Bonus: Double your deposit up to $10,000 and trade with enhanced capital.
- Leverage up to 1:3000: Maximizing potential profits with one of the highest leverage options available.
- ‘Best Customer Service Broker Asia’ Award: Recognized excellence in customer support and service.
- Seasonal Promotions: Enjoy a variety of exclusive bonuses and promotional offers all year round.

>> Sign Up for FBS Broker Account here <<
Click here below to download: