


One reason why a crossover signal can sometimes result in a trend is because some signals form because of a strong momentum breakout or reversal at the start of the trend. It would be natural for the market to trend at times whenever the trend is initiated by a strong momentum breakout.
In this strategy we will not be trading the crossover of two moving average lines. Instead, we will be trading a crossover of a strong momentum candle over a moving average line. This would allow us to trade at the start of the actual momentum-based signal.
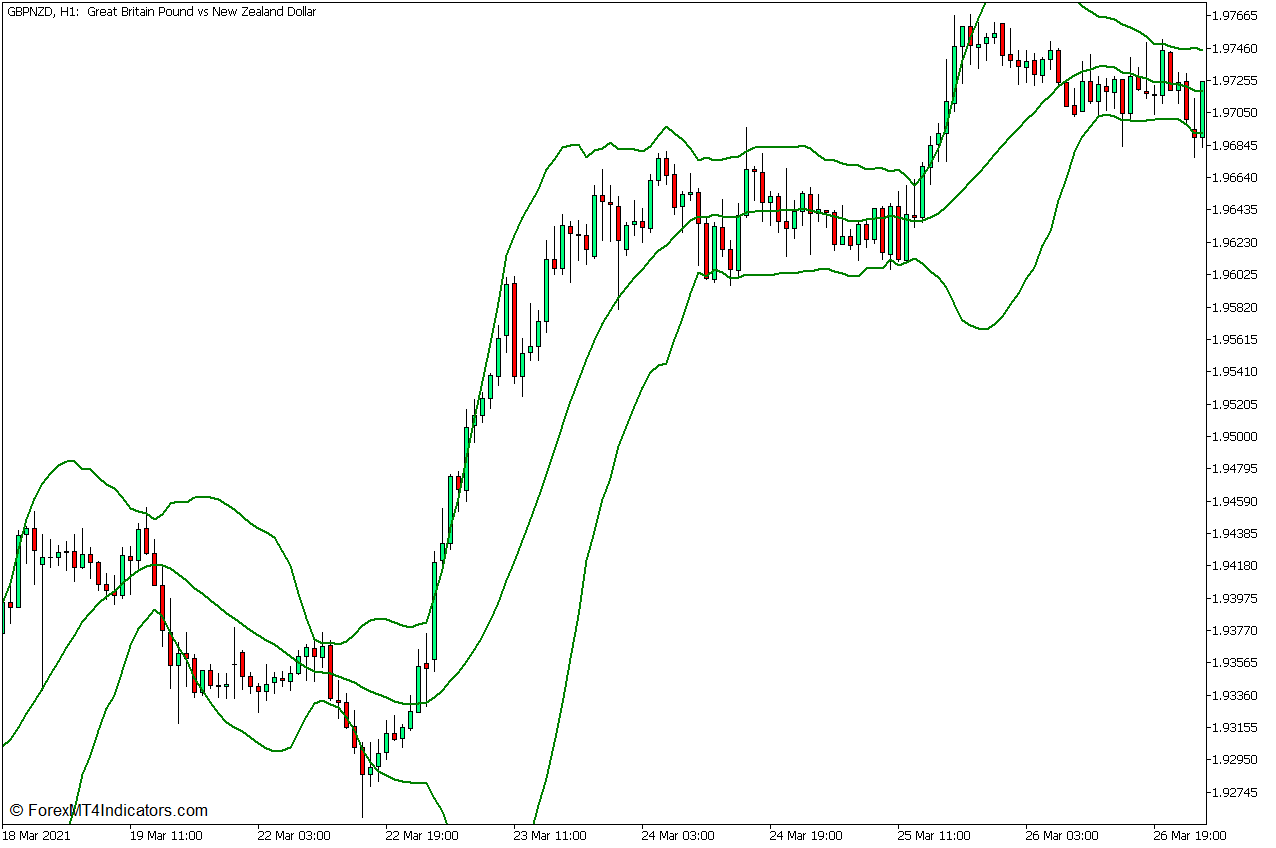
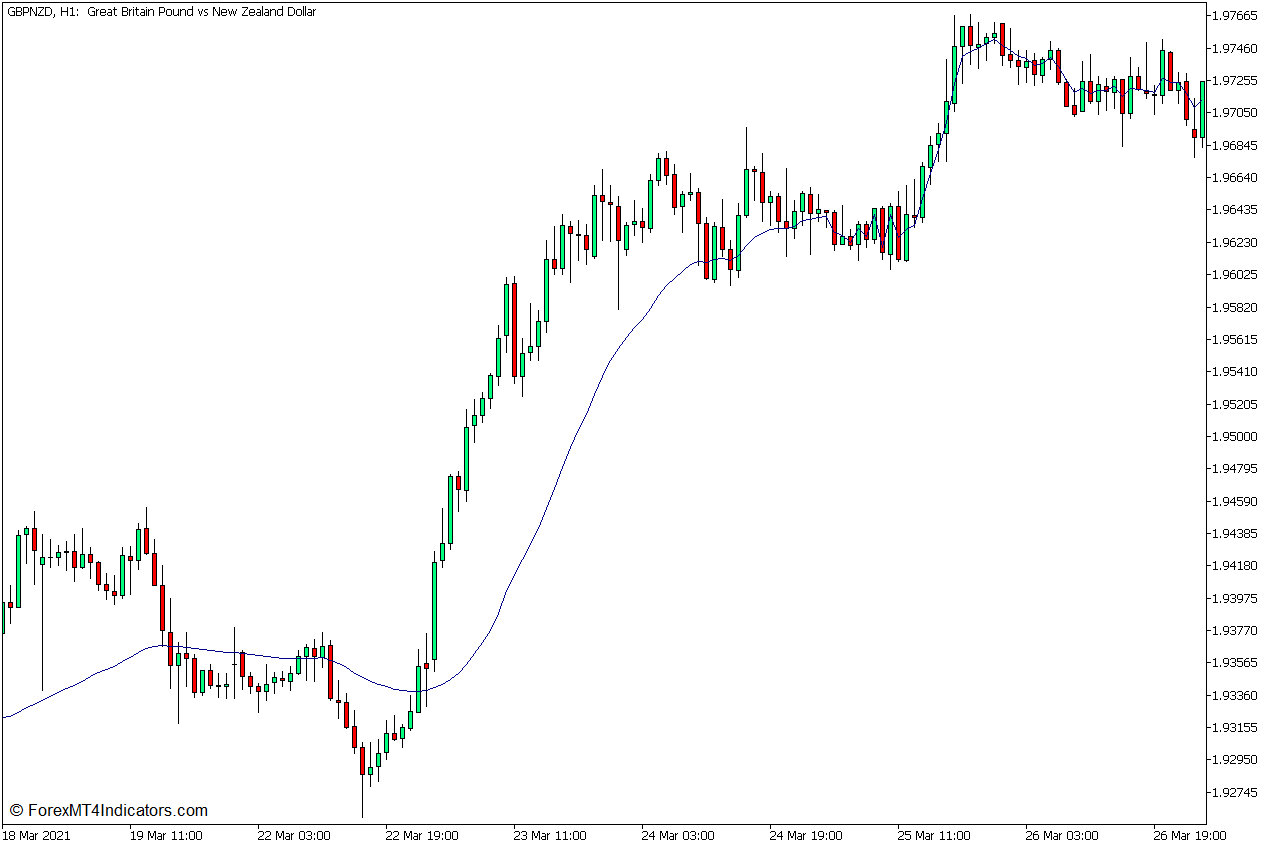
We will also be using a modified moving average line, which is the Fractal Adaptive Moving Average indicator, as it tends to be a significant mid-term moving average line which when broken can sometimes result in a strong breakout. We will also add another layer of momentum breakout confirmation using the Bollinger Bands indicator.
Bollinger Bands
The Bollinger Bands is one of the most versatile technical indicators. It can be used as an overbought or oversold indicator, a trend direction indicator, a volatility indicator, as well as a momentum breakout indicator.
The Bollinger Bands is composed of three lines. The middle line is a Simple Moving Average (SMA) line which is usually preset at 20 bars. The outer lines are standard deviations based on the volatility of price movements shifted above and below the middle line. These three lines create a channel of band-like structure that forms the Bollinger Bands.
Since the middle line of the Bollinger Bands is a moving average line, the Bollinger Bands itself can be used as a trend direction indicator just as most moving average lines are mostly used. Price action tends to stay on the upper half of the Bollinger Bands whenever the market is in an uptrend, and below the Bollinger Bands whenever the market is in a downtrend.
The Bollinger Bands can also be used as a volatility indicator because the outer lines are based on a standard deviation of price movements. The Bollinger Bands tend to expand whenever the market is expanding and has a high volatility. It also tends to contract whenever volatility is decreasing as in a market contraction phase.
The Bollinger Bands is also usually used as a basis for mean reversal setups coming from overbought and oversold price levels. The area above the upper line is considered overbought, while the area below the lower line is considered oversold. Price rejection signals occurring at these levels can be very strong mean reversal signals.
However, these same outer lines can also be used as a basis for a momentum breakout setup. The market tends to contract before a strong momentum breakout. As such, strong momentum candles breaking out of tight Bollinger Bands can be a good indication of a possible momentum breakout.
Fractal Adaptive Moving Average Indicator
The Fractal Adaptive Moving Average (FRAMA) indicator is a custom technical indicator which is a modification of the moving average indicator.
Most moving average lines tend to be very susceptible to price spikes which causes a lot of false signals. The Fractal Adaptive Moving Average indicator plots a line that is smoothened out making it less susceptible to false signals.
Trading Strategy Concept
This trading strategy is a momentum trading strategy that trades on the confluence of a momentum breakout and a crossover between a momentum candle and a moving average line. To do this, we will be using the Bollinger Bands Indicator and the Fractal Adaptive Moving Average Indicator.
In this strategy we will use the Bollinger Bands as a means to confirm a strong momentum breakout from a market contraction phase. This is based on the outer lines of the Bollinger Bands contracting tightly confirming a market contraction phase and a momentum candle breaking and closing outside of the Bollinger Bands indicating the start of the momentum breakout.
The FRAMA line is then used to confirm the momentum breakout. This is based on a momentum candle crossing over and closing on the opposite side of the FRAMA line.
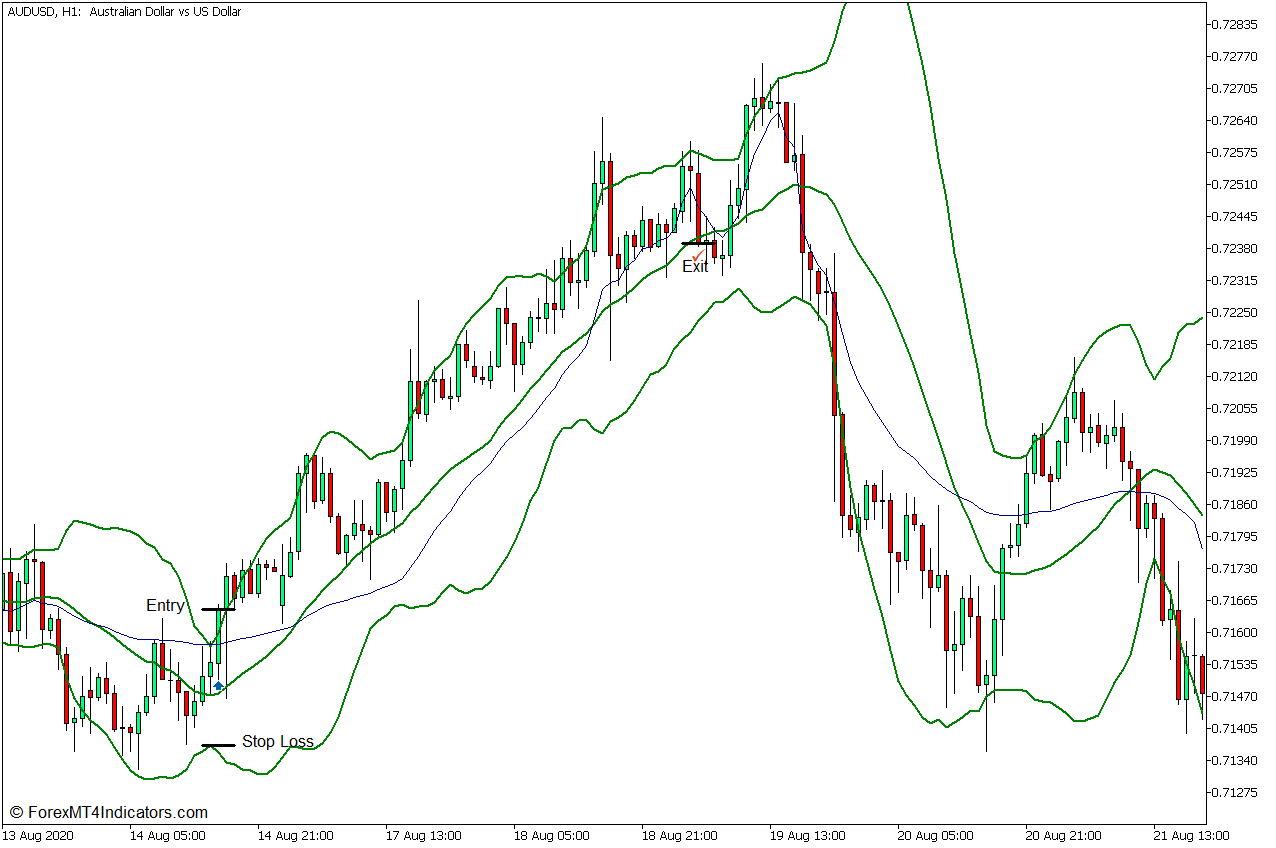
Buy Trade Setup
Entry
- The Bollinger Bands should contract indicating that the market is in a market contraction phase.
- A bullish momentum candle should break above the upper line of the Bollinger Bands with strong momentum.
- The same bullish momentum candle should also cross above the Fractal Moving Average line.
- Enter a buy order on the confluence of these signals.
Stop Loss
- Set the stop loss on the support level below the entry candle.
Exit
- Close the trade as soon as the price closes below the middle line of the Bollinger Bands.
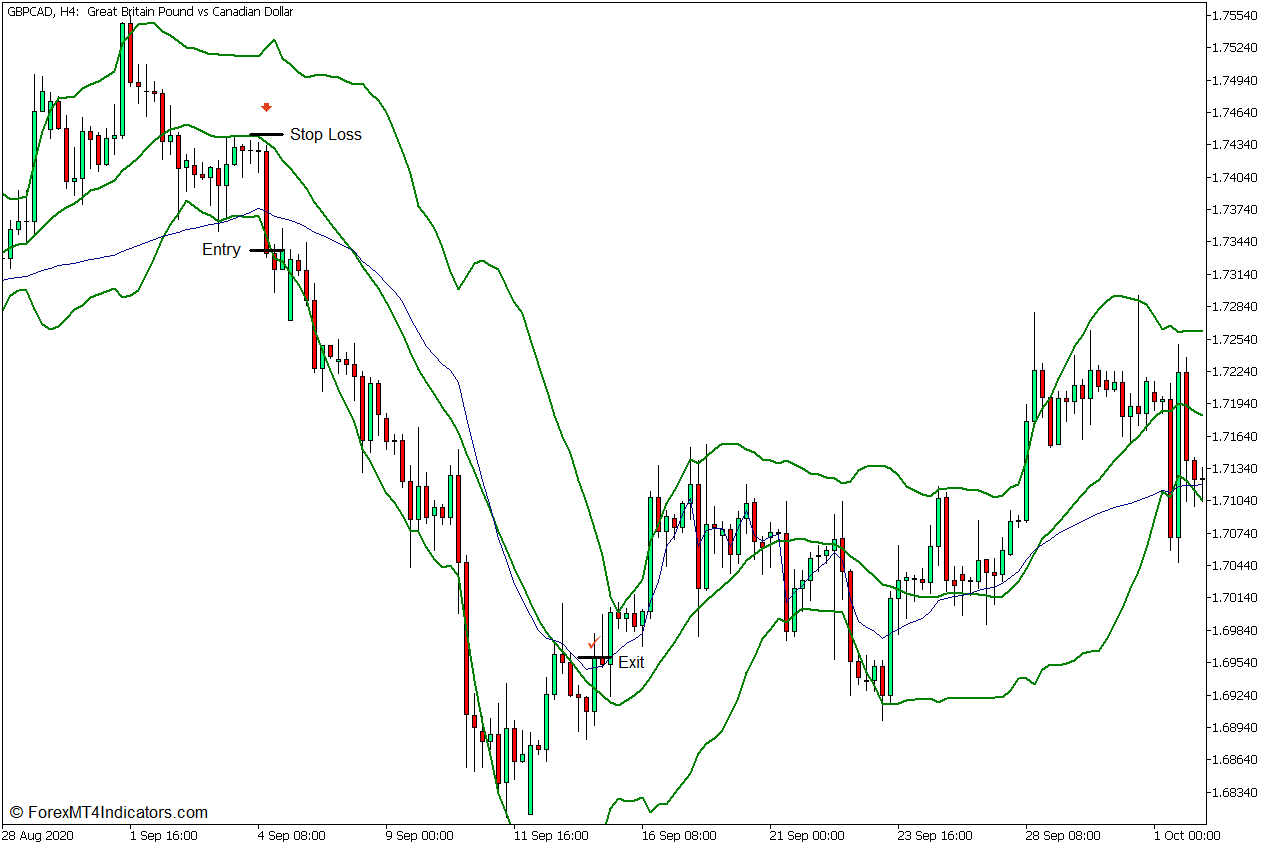
Sell Trade Setup
Entry
- The Bollinger Bands should contract indicating that the market is in a market contraction phase.
- A bearish momentum candle should break below the lower line of the Bollinger Bands with strong momentum.
- The same bearish momentum candle should also cross below the Fractal Moving Average line.
- Enter a sell order on the confluence of these signals.
Stop Loss
- Set the stop loss on the resistance level above the entry candle.
Exit
- Close the trade as soon as the price closes above the middle line of the Bollinger Bands.
Conclusion
Momentum breakouts based on the Bollinger Bands are valid momentum breakout setups used by some traders. Candles crossing over a major moving average line with strong momentum can also be indicative of a possible trend developing due to a momentum breakout. This strategy trades on the confluence of both conditions.
Although this strategy does trade on such valid confluences, there would still be some seemingly valid signals that would not develop into a trend. Traders need to observe if the market is indeed starting in a market contraction phase before the momentum breakout and if the signal identified is indeed a strong momentum breakout candle.
If used in the correct market scenario, this trade setup should result in a momentum breakout scenario, which should allow traders to earn huge gains on a trade.
Recommended MT5 Brokers
XM Broker
- Free $50 To Start Trading Instantly! (Withdraw-able Profit)
- Deposit Bonus up to $5,000
- Unlimited Loyalty Program
- Award Winning Forex Broker
- Additional Exclusive Bonuses Throughout The Year

>> Sign Up for XM Broker Account here <<
FBS Broker
- Trade 100 Bonus: Free $100 to kickstart your trading journey!
- 100% Deposit Bonus: Double your deposit up to $10,000 and trade with enhanced capital.
- Leverage up to 1:3000: Maximizing potential profits with one of the highest leverage options available.
- ‘Best Customer Service Broker Asia’ Award: Recognized excellence in customer support and service.
- Seasonal Promotions: Enjoy a variety of exclusive bonuses and promotional offers all year round.

>> Sign Up for FBS Broker Account here <<
Click here below to download: