


Runs are the types of trades that many traders would want to make. These markets provide traders the opportunity to make a lot of money in a very short period. Although it is not as popular as a trend, it shares a lot of similarity. In fact, some traders say that a run is a trend and a trend is a run, the only difference is in the timeframe. When you come to think of it, this statement is true. Strong trends that are found on the lower timeframe would be a run on the higher timeframe. We could say that runs are like trends on steroids. If traders could easily make money on trends, then market runs could do the same for them only that this time it is much faster.
In the real-world market, outside of the computer desk, trends could be related to inflation while runs could be related to hyperinflation, only that inflation and hyperinflation is a thousand times more impactful, while trends and runs could occur on a daily or weekly basis depending on the timeframe.
Runs carries a lot of momentum with it and pushes price at a much faster pace. Traders who could systematically trade possible market runs as it unfolds could profit greatly from the market.
Candle Stop Momentum Run Forex Trading Strategy is a momentum trading strategy that allows traders to systematically anticipate probable market runs based on a confluence of indicators.
Oracle Move – 100 Pips Momentum
Oracle Move, also known as 100 Pips Momentum, is a custom technical indicator used by traders to identify momentum and short-term trend direction.
It is a trend following indicator based on the crossover of two Hull Moving Averages (HMA). The blue line represents the faster moving average line, while the red line represents the slower moving average line.
Trends are based on the positioning of the two moving average lines. If the blue line is above the red line, the market is said to be bulling. If the blue line is below the red line, then the market is said to be bearish. Crossovers between the two moving average lines could be considered as a possible trend reversal signal.
Most moving average lines are either erratic and susceptible to choppy markets or are too lagging and produces entry signals too late. This configuration of moving averages manages to minimize lag drastically and smoothen out the moving average line. This creates a moving average line that is very responsive to price movements yet is less susceptible to false signals.
Candle Stop Indicator
Candle Stop indicator is a channel or envelope type of technical indicator. It behaves much like the Keltner Channel or the Donchian Channel indicators.
It plots two dashed lines overlaid on the price chart to indicate the normal range of price action. These lines are based on the historical movements of price derived from the highs and lows within a certain period a few bars behind.
This creates a channel that should envelope price during not trending or low volatility markets. However, it would also indicate a probable momentum breakout whenever price breaks out strongly on either side of the channel.
Trading Strategy
This trading strategy is a simple momentum breakout strategy based on the confluence of signals coming from the Candles Stop indicator and the Oracle Move indicator.
The Oracle Move indicator would serve as an initial indication regarding where the short-term momentum is moving. Trade direction will be based on how the two moving average lines of the Oracle Move indicator are stacked.
We then wait for price to breakout of the channel and close outside of the two lines. Price should breakout in the direction indicated by the Oracle Move indicator.
The breakout candle should be a momentum candle. It should also break the previous swing low, swing high or congestion range, indicating that a momentum breakout scenario is in play.
Indicators:
- CandleStop
- 100pips Momentum
Preferred Time Frames: 30-minute, 1-hour, 4-hour and daily charts
Currency Pairs: FX majors, minors and crosses
Trading Sessions: Tokyo, London and New York sessions
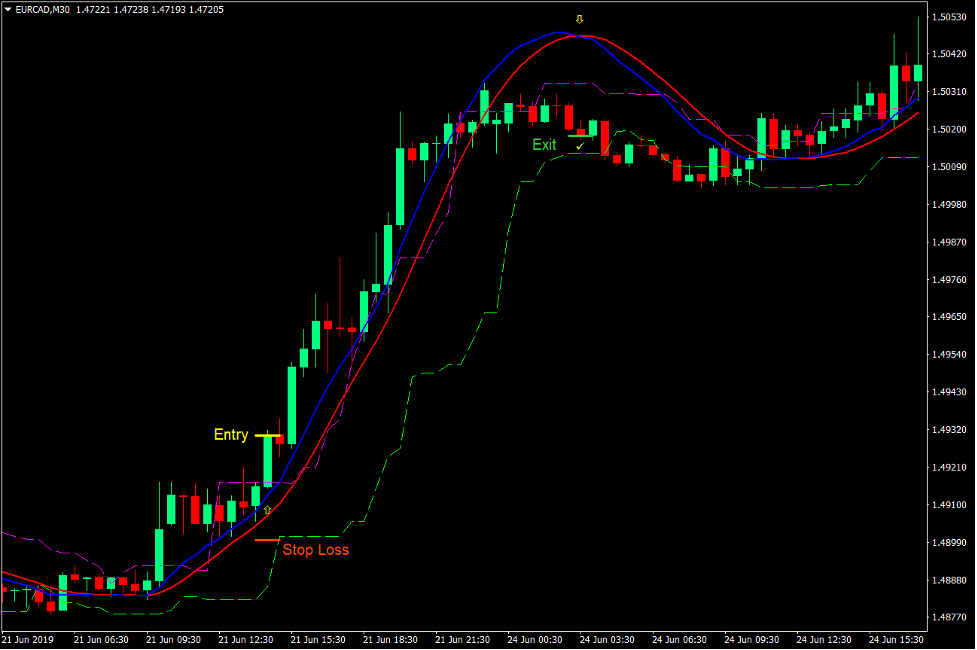
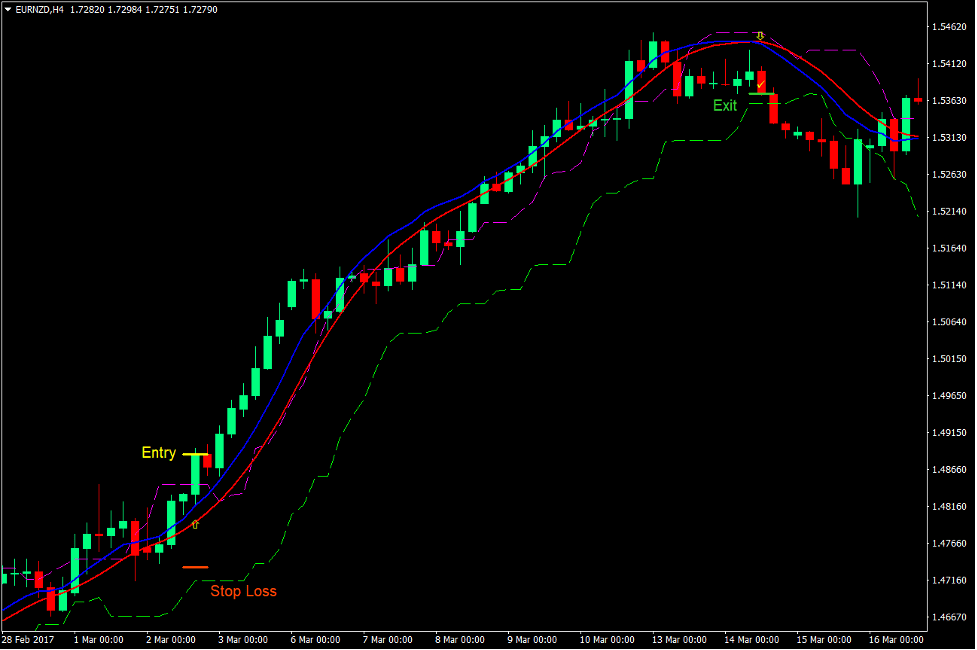
Buy Trade Setup
Entry
- The blue line of the Oracle Move indicator should be above the red line.
- A bullish momentum candle should break above the magenta line of the Candle Stop indicator.
- The breakout candle should close above the recent swing high or congestion area.
- Enter a buy order on the confirmation of the conditions above.
Stop Loss
- Set the stop loss on the fractal below the entry candle.
Exit
- Close the trade as soon as the blue line of the Oracle Move indicator crosses below the red line.
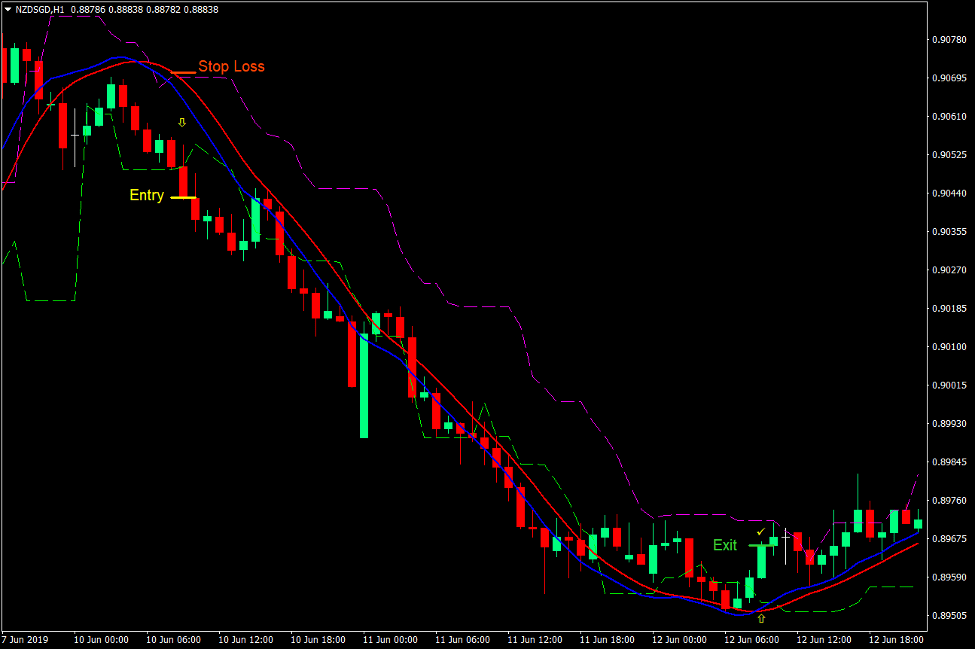
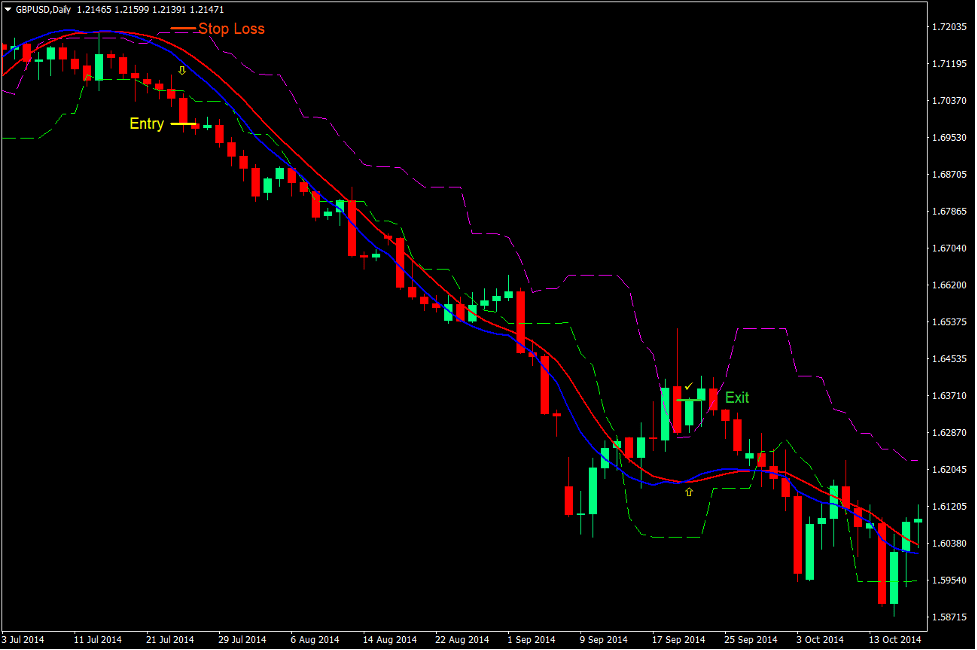
Sell Trade Setup
Entry
- The blue line of the Oracle Move indicator should be below the red line.
- A bearish momentum candle should break below the lime line of the Candle Stop indicator.
- The breakout candle should close below the recent swing low or congestion area.
- Enter a sell order on the confirmation of the conditions above.
Stop Loss
- Set the stop loss on the fractal above the entry candle.
Exit
- Close the trade as soon as the blue line of the Oracle Move indicator crosses above the red line.
Conclusion
This momentum breakout strategy is a working trading strategy. It provides trade entries that have a relatively high probability and an even higher potential reward-risk ratio.
Traditional breakout strategies work in almost the same manner. The difference is that this strategy is based on the recent highs and lows of price, which are the areas where price should breach in order to confirm a breakout.
It also allows price to run, which capitalizes on momentum breakout’s main strength, which is high reward-risk ratios due to market runs.
The key to trading this strategy successfully is in identifying viable congestion or breakout areas and momentum breakout candles. The indicators used serve just as a confirmation to the setup. It also allows traders to see potential trade setups with more clarity, which have otherwise been missed if without the indicators.
Recommended MT4 Brokers
XM Broker
- Free $50 To Start Trading Instantly! (Withdraw-able Profit)
- Deposit Bonus up to $5,000
- Unlimited Loyalty Program
- Award Winning Forex Broker
- Additional Exclusive Bonuses Throughout The Year

>> Sign Up for XM Broker Account here <<
FBS Broker
- Trade 100 Bonus: Free $100 to kickstart your trading journey!
- 100% Deposit Bonus: Double your deposit up to $10,000 and trade with enhanced capital.
- Leverage up to 1:3000: Maximizing potential profits with one of the highest leverage options available.
- ‘Best Customer Service Broker Asia’ Award: Recognized excellence in customer support and service.
- Seasonal Promotions: Enjoy a variety of exclusive bonuses and promotional offers all year round.

>> Sign Up for FBS Broker Account here <<
Click here below to download: