


Dynamic Bounce Forex Trading Strategy
One of the main ingredients to a high probability trade setup is confluence. The more hints you find pointing to the same direction, the better.
But you may ask, “What is confluence by the way?”
Confluence is simply the combination of multiple indicators, strategies, clues and hints into one trade setup or strategy. Basically, its many fingers pointing one direction. Imagine you are going somewhere and you seem lost. Then, you pass by a group of people who you think are from around the area. You ask them where the place you wanna go to is. Then, one by one they same different things. Wouldn’t that be confusing. Trading is mostly like that. You’re looking for clues, may it be price action, indicators, or fundamental news data, and as you piece them together, often times you would find contradicting directions. But there are those magical moments when everything lines up. All your indicators, price action, news data, market sentiment, etc. point towards the same direction. Those are the moments when trades have higher probabilities. It would be like the whole group pointed you towards the same direction. Then you’d be more confident of where you are going.
Fair warning though. You can have so much confluence, but the market will do whatever it wants to do. High probability trade setups could still fail.
The Case for Trader’s Dynamic Index (TDI)
The TDI is probably the single indicator that could pack so much confluence in just one indicator.
First, it has the Relative Strength Indicator (RSI) and a Signal Line, which is basically a derivative of a moving average. Given that the RSI could be representative of price movement, having the RSI and Signal lines crossover would be tantamount to a crossover strategy based on price and a moving average. This is one way TDI traders use this indicator.
Next, it has the upper and lower outer bands. This is somewhat a derivative of the Bollinger Bands only that it is on a different window layered with the RSI and Signal line. Given that this is almost the same as the Bollinger Bands, it could also be used as an indicator for overbought or oversold market conditions based on the outer bands alone.
However, the TDI doesn’t stop there. Because it is range bound just like the regular RSI, it could also be used to define further if the RSI is overbought or oversold based on whether it is above or below a certain level. The preset parameters however are the 32 and 68 level, with a midline on the 50.
Trade Concept
Given that the TDI does produce a whole range of confluences in one window, we will be using most of the signals it gives. Specifically, we will be using the RSI and Signal Line crossover and the outer bands overbought and oversold market conditions.
We will be paring this with a commonly occurring scenario on the price chart itself – the bounce off the 50 Exponential Moving Average (EMA). One of the primary characteristics of a moving average is that price tends to bounce off of it as a dynamic support or resistance. Given that the 50 EMA is one of the most commonly used moving averages that traders look into, it is no surprise that price tends to bounce off it.
Combining the confluences of the TDI and the bounce off the 50 EMA, what we will be looking for is a confluence of the RSI and Signal line crossover, bounces off the TDI outer bands, and bounces off the 50 EMA.
Timeframe: any
Currency Pair: any; use major pairs if day trading or scalping
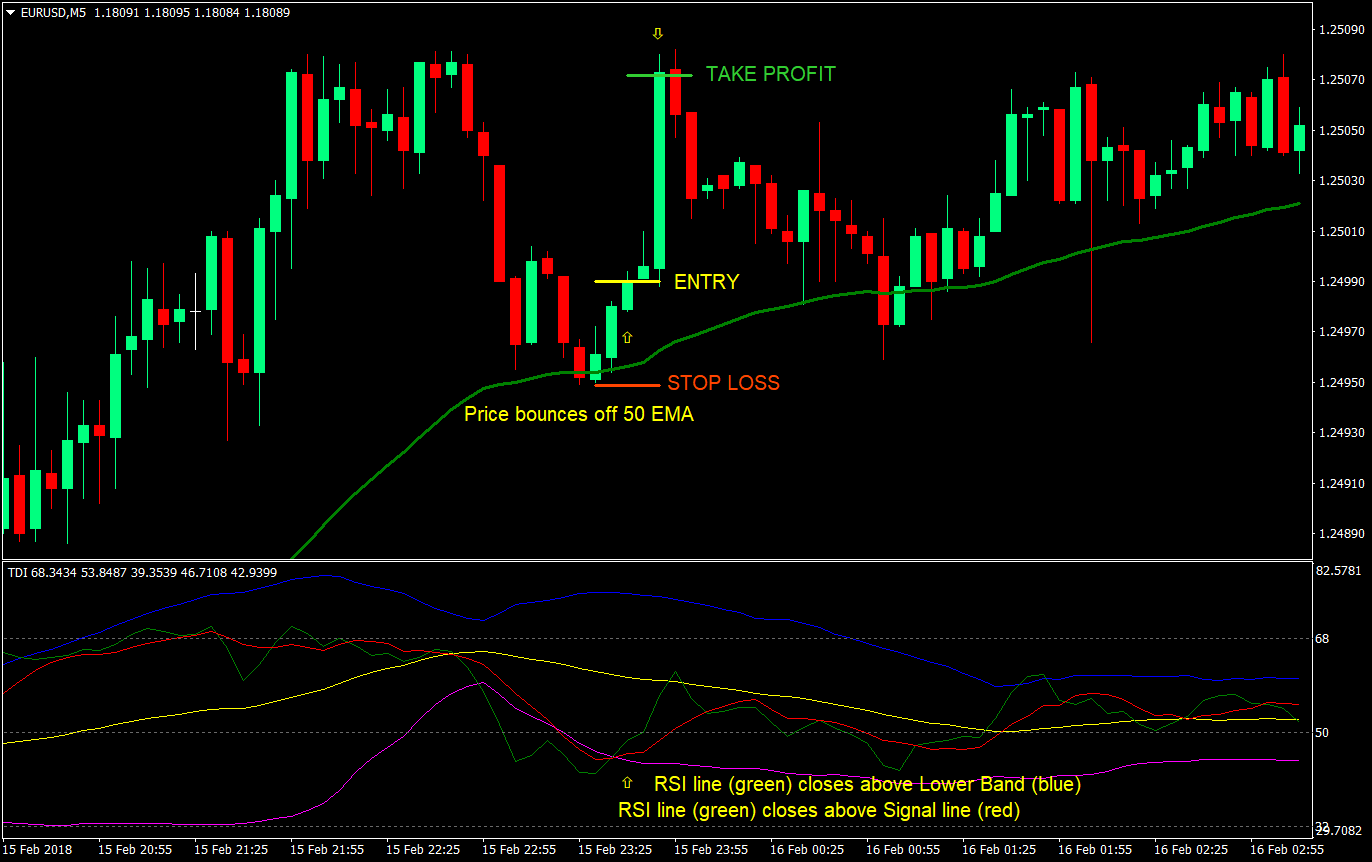
Buy Setup
Entry
- Price should come from above the 50 EMA (green) signifying a bullish trend bias
- TDI: RSI line (green) should come from below the lower outer band (blue) signifying a deep retrace
- TDI: RSI line should cross above the lower outer band signifying a bounce off an oversold condition
- TDI: RSI line should cross above the Signal line (red)
- Price candles should bounce off the 50 EMA
- Enter a buy market order at the close of the candle
Stop Loss
- Set the stop loss at the swing low below the entry price
Take Profit
- Set the take profit target at 2x the risk on the stop loss
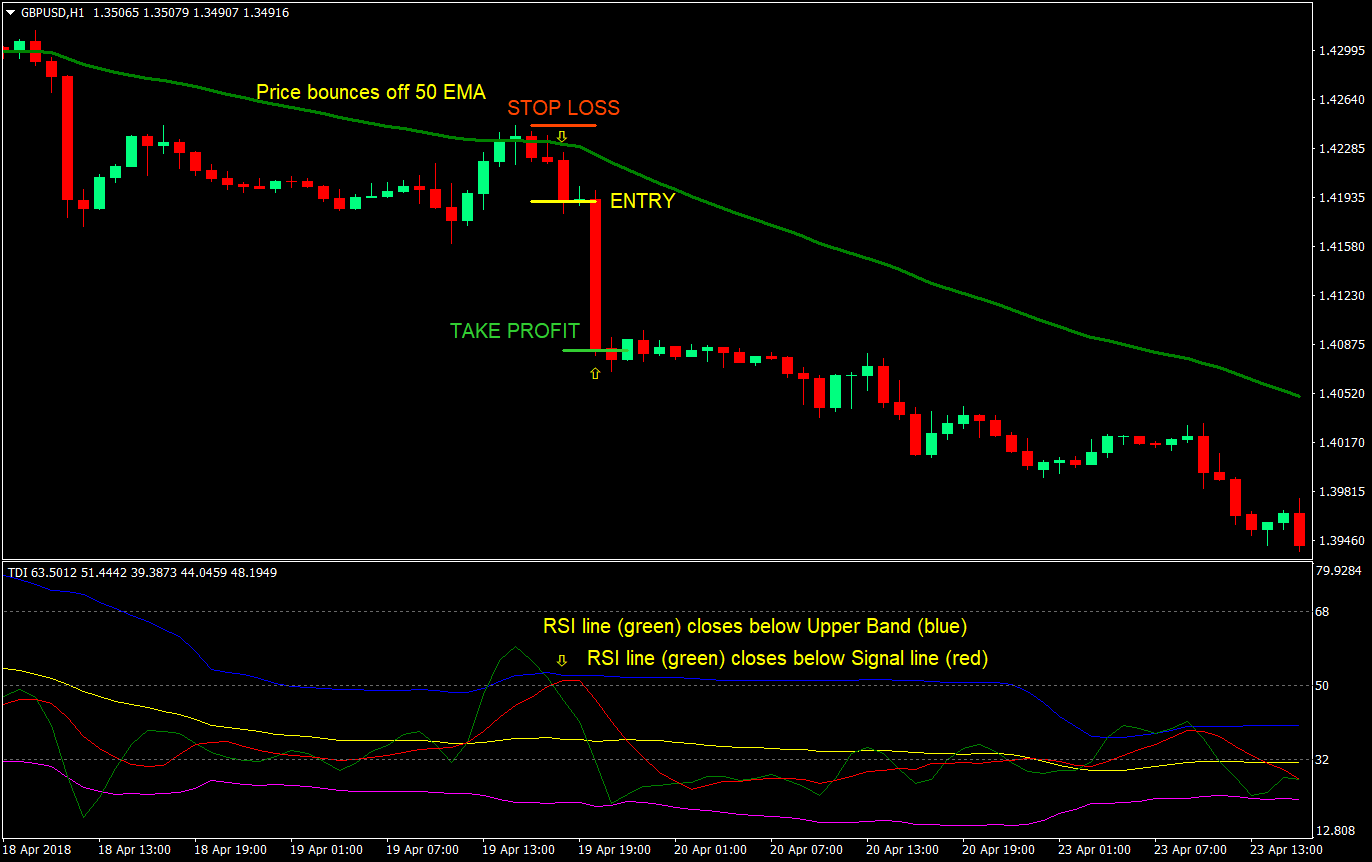
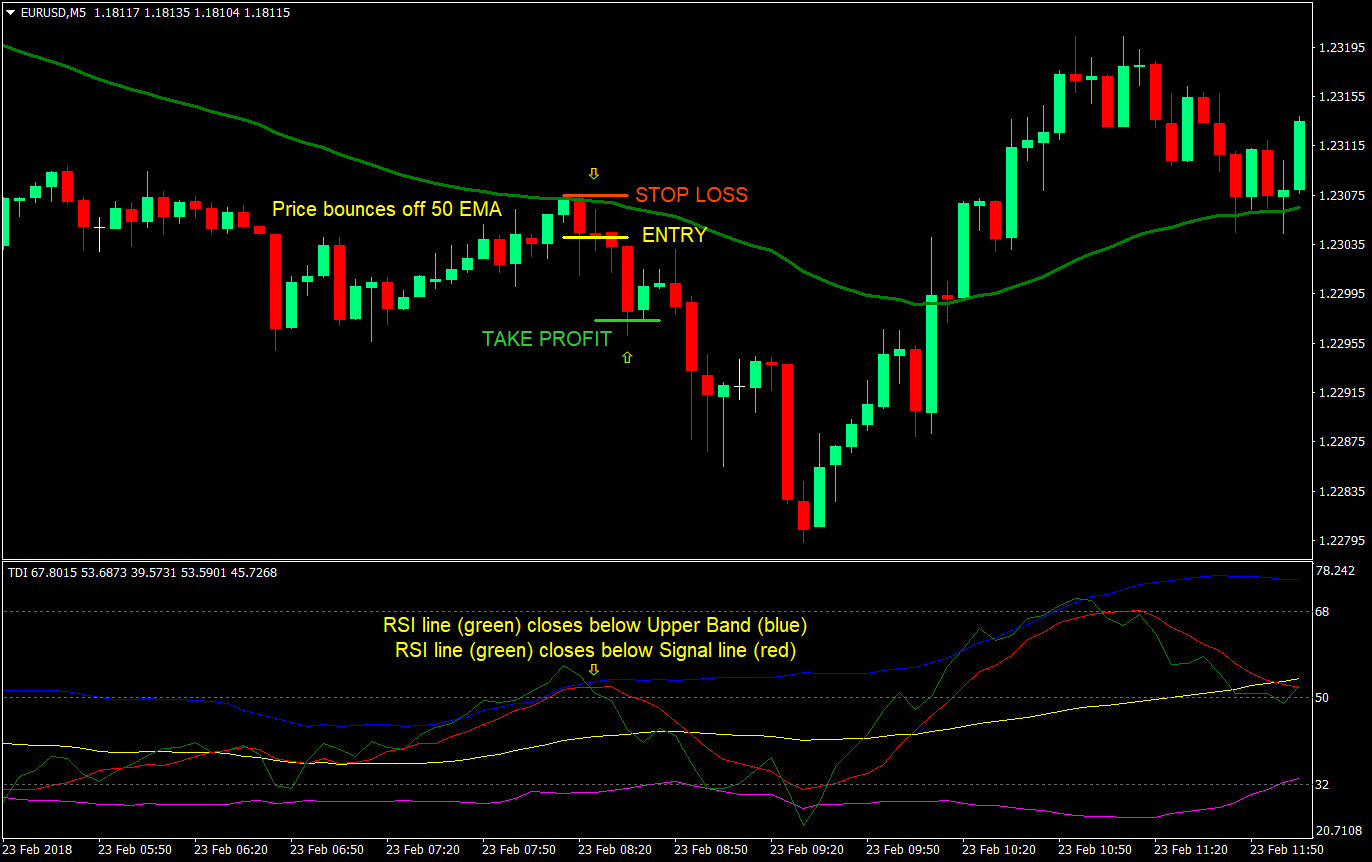
Sell Setup
Entry
- Price should come from below the 50 EMA (green) signifying a bearish trend bias
- TDI: RSI line (green) should come from above the upper outer band (blue) signifying a deep retrace
- TDI: RSI line should cross below the upper outer band signifying a bounce off an overbought condition
- TDI: RSI line should cross below the Signal line (red)
- Price candles should bounce off the 50 EMA
- Enter a sell market order at the close of the candle
Stop Loss
- Set the stop loss at the swing high above the entry price
Take Profit
- Set the take profit target at 2x the risk on the stop loss
Conclusion
The TDI alone is a great standalone indicator. Many traders have claimed being profitable using the TDI alone.
By complementing the TDI with a recurring scenario on the price chart itself, the bounce off the 50 EMA, the already powerful TDI could have even higher probability trade setups.
The caveat though is that at times, deep retraces could also mean a precursor to reversals. Although price do tend to bounce off the 50 EMA, sometimes the bounce is not too strong because price is already starting to rollover. It would be wise to look at moving the stop loss to break even at a logical point.
Another thing about strategies with high confluences is that they tend to come by less often. You would need lots of patience while waiting for these trade setups to complete.
Recommended MT4 Broker
- Free $50 To Start Trading Instantly! (Withdrawable Profit)
- Deposit Bonus up to $5,000
- Unlimited Loyalty Program
- Award Winning Forex Broker
- Additional Exclusive Bonuses Throughout The Year

>> Claim Your $50 Bonus Here <<
Click here below to download: