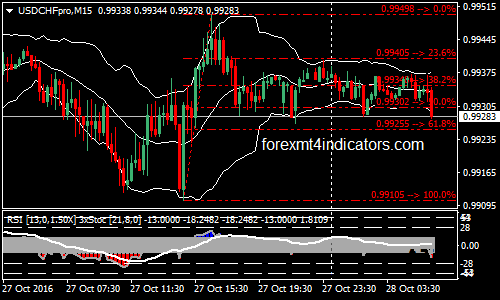
Divergence With Bollinger Bands Binary Options Strategy
Divergence is you will see the price is making higher highs but the indicator is making a lower high. This is if you are bearish. In a bullish trade, you will see the price making lower lows but the indicator is making a higher low.
This system works on a 5-minute timeframe with an expiry time of 60 minutes and 15-minutes with the expiry time of 180 minutes.
Metatrader indicators:
- ATM RSI Histo Triple Stochastic Divergence indicator;
- Fibonacci Retracement: XIT Fib indicator.
The price should be above the upper Bollinger Bands indicator in case of a bearish divergence and in the same manner the price should be below the lower Bollinger Bands indicator in case of a bullish divergence.
Bullish Divergence:
- If it is spotted on a 5-minute timeframe, it is a signal for “CALL” position.
- Call when the red bars of the indicator ATM RSI Histo Triple Stochastic Divergence retrace below the dotted black line.
- Touch points are the Fibonacci Retracement: XIT Fib indicator.
Bearish Divergence:
- If it is spotted on a 5-minute timeframe, it is a signal for “PUT” position.
- Put when the blue bars of the indicator ATM RSI Histo Triple Stochastic Divergence retrace below the dotted black line.
- Touch points are the Fibonacci Retracement: XIT Fib indicator.
This method of trading based on divergence can also be applied to Binary options strategies High / Low but this method of trading is not for beginners.
Recommended MT4 Broker
- Free $50 To Start Trading Instantly! (Withdrawable Profit)
- Deposit Bonus up to $5,000
- Unlimited Loyalty Program
- Award Winning Forex Broker
- Additional Exclusive Bonuses Throughout The Year
>> Claim Your $50 Bonus Here <<
Click here below to download:


