


The TMA Indicator is a variation of the classic moving average. Unlike the simple moving average (SMA) or exponential moving average (EMA), the TMA places more weight on recent price data while maintaining a triangular weighting scheme. This unique approach provides traders with a smoother and more responsive trend-following tool.
Purpose and Significance
The TMA serves multiple purposes:
- Trend Identification: It helps traders spot trends by filtering out short-term noise.
- Volatility Measurement: TMA adapts to market volatility, making it suitable for various timeframes.
- Entry and Exit Signals: Crossovers and deviations from the TMA signal potential buying or selling opportunities.
Brief History
The TMA gained prominence in the early 2000s as traders sought alternatives to traditional moving averages. Its popularity surged due to its ability to adapt to changing market conditions.
Understanding Moving Averages
Types of Moving Averages
- Simple Moving Average (SMA): Equal weight to all data points.
- Exponential Moving Average (EMA): Recent prices have more weight.
Role in Technical Analysis
Moving averages smooth price data, revealing underlying trends. They act as dynamic support or resistance levels.
Triangular Moving Average (TMA)
Definition and Calculation
- TMA = (SMA1 + SMA2 + SMA3) / 3
- Each SMA uses a triangular weighting scheme.
Characteristics of TMA
- Smoothness: Reduced lag compared to SMAs.
- Adaptability: Reacts swiftly to price changes.
- Centered Bands: TMA can be plotted as bands around the central line.
Interpretation Of TMA
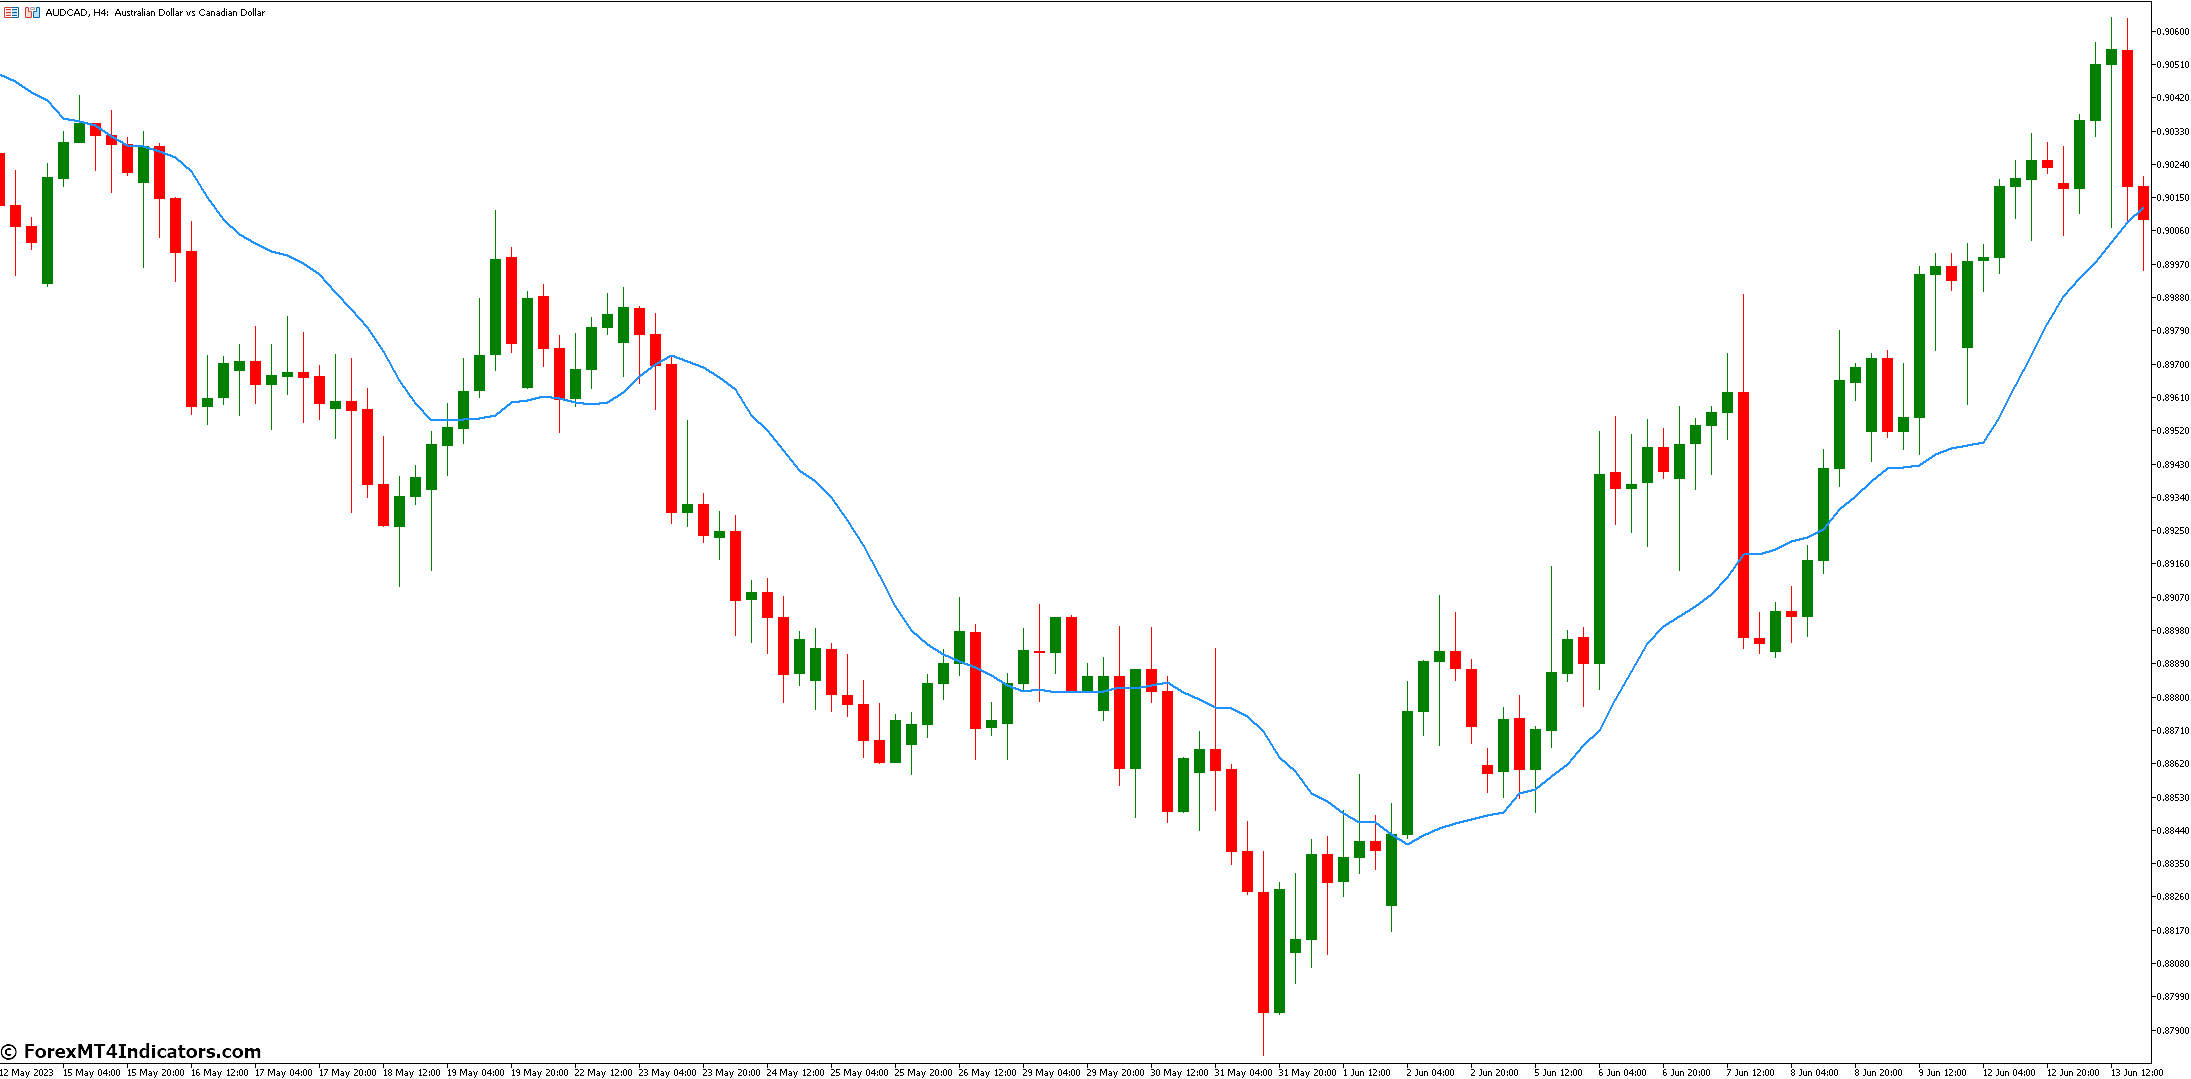
Identifying Trends
- Uptrend: Price above TMA.
- Downtrend: Price below TMA.
Bullish and Bearish Signals
- Golden Cross: Short-term TMA crosses above long-term TMA (bullish).
- Death Cross: Short-term TMA crosses below long-term TMA (bearish).
TMA as a Trend-Following Indicator
- Traders use TMA to confirm trend direction.
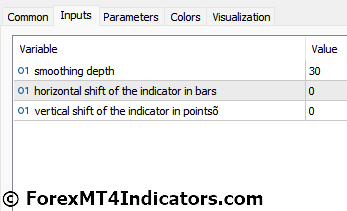
TMA Parameters
Period Length
- Common periods: 20, 50, 100.
- Shorter periods for intraday trading.
Smoothing Factors
- Adjust sensitivity by altering weights.
Customization Options
- Color, style, and visibility settings.
TMA Centered Bands
Enhancing TMA with Bands
- Upper and lower bands around TMA.
- Volatility expands or contracts the bands.
Volatility Measurement
- Bollinger Bands or Keltner Channels complement TMA.
Practical Applications
- Breakout Strategies: Trade when the price escapes TMA bands.
- Reversal Patterns: Observe TMA behavior near key levels.
TMA Best Practices
Timeframes and Pairs
- Short-Term: Use lower periods (e.g., 20) for intraday trading.
- Long-Term: Opt for higher periods (e.g., 100) for swing trading.
Avoiding False Signals
- Combine TMA with other indicators (RSI, MACD) for confirmation.
- Filter out noise by waiting for clear crossovers.
How to Trade with TMA Indicator
Buy Signal
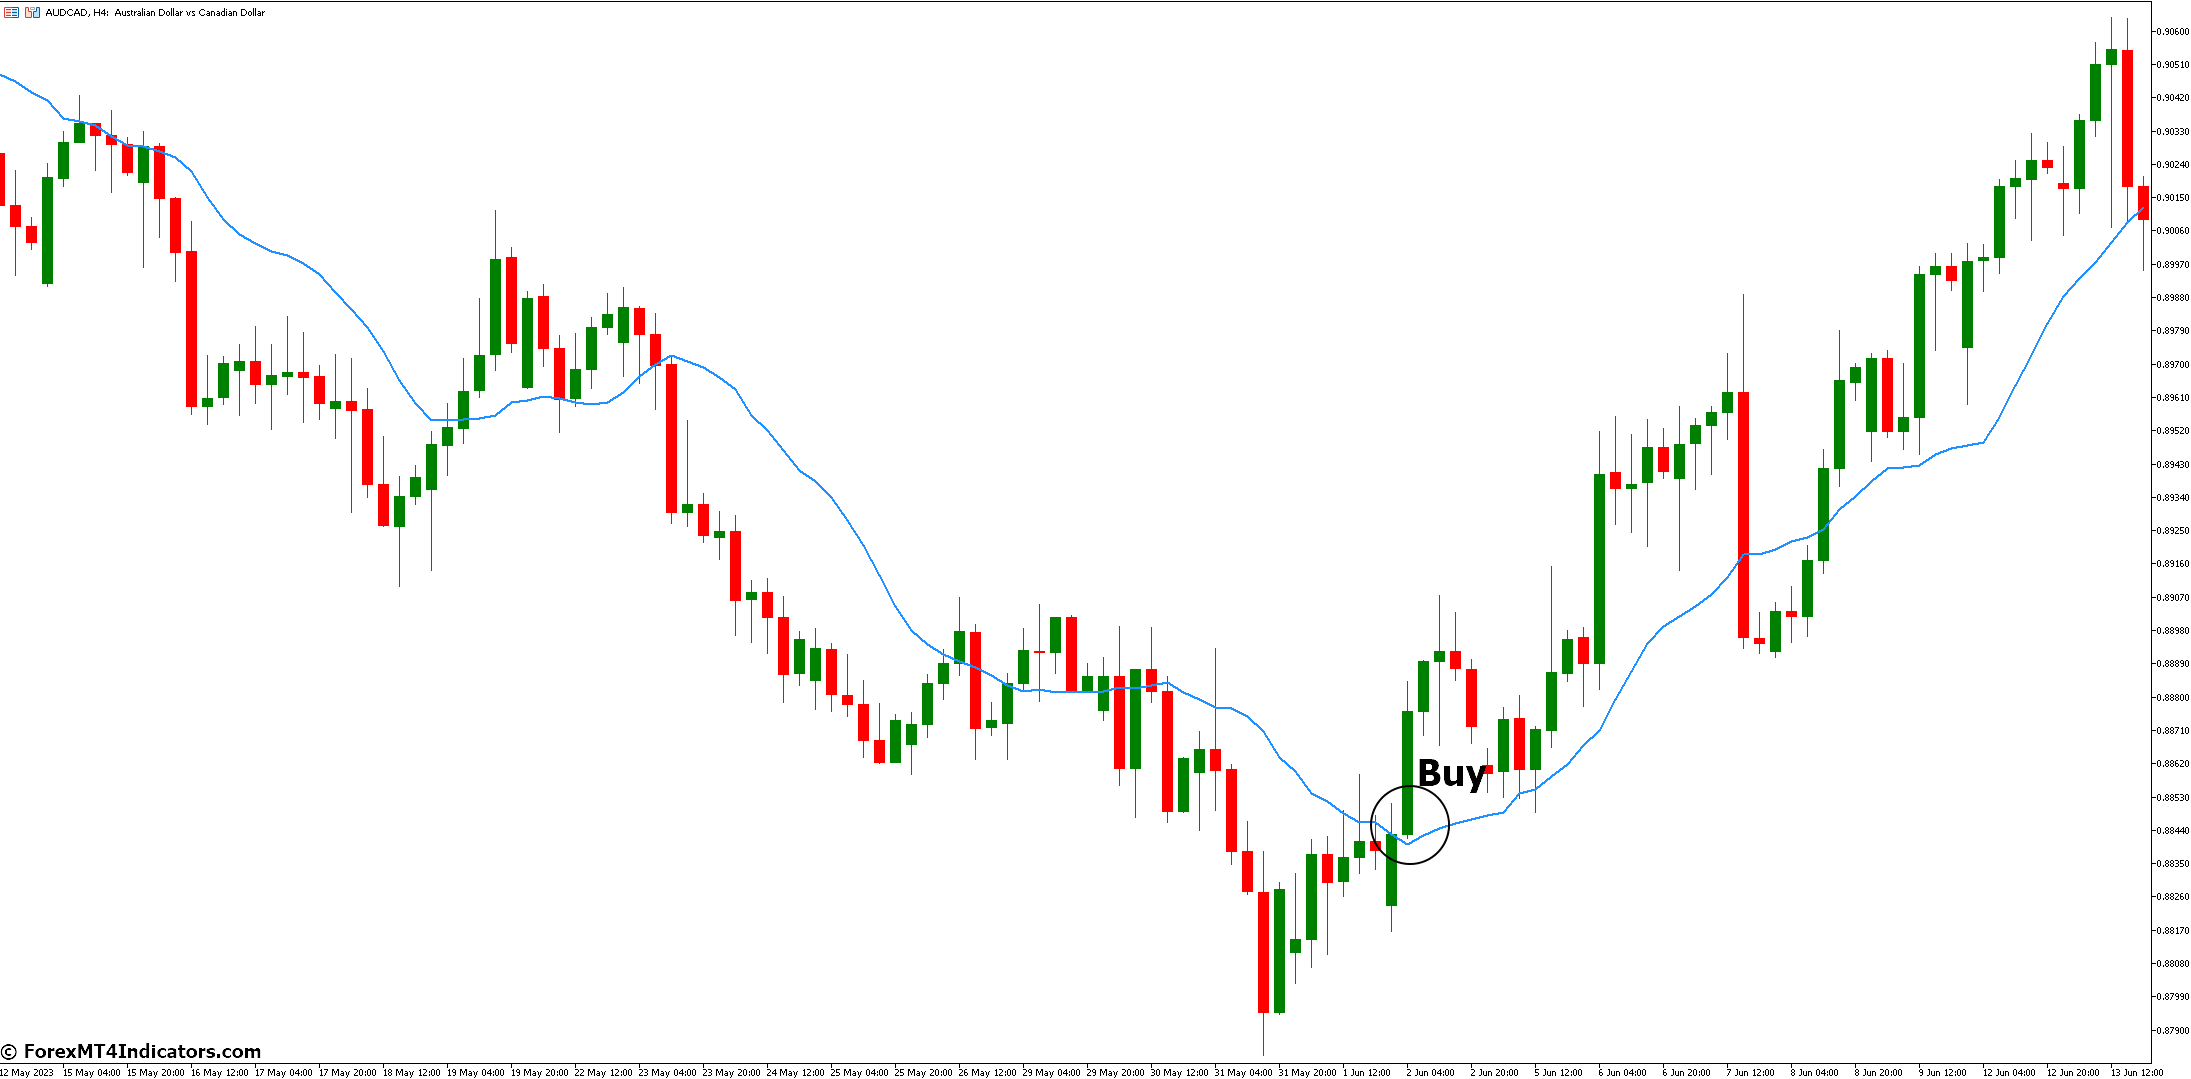
- Ensure that the TMA indicator is below the price action on the chart.
- This indicates an uptrend.
- Wait until the price completely crosses the TMA from below.
- Open a long trade when the price rises above the TMA.
- Place your stop loss just below the most recent swing low level.
- Consider taking profits when the price falls below the TMA.
Sell Signal
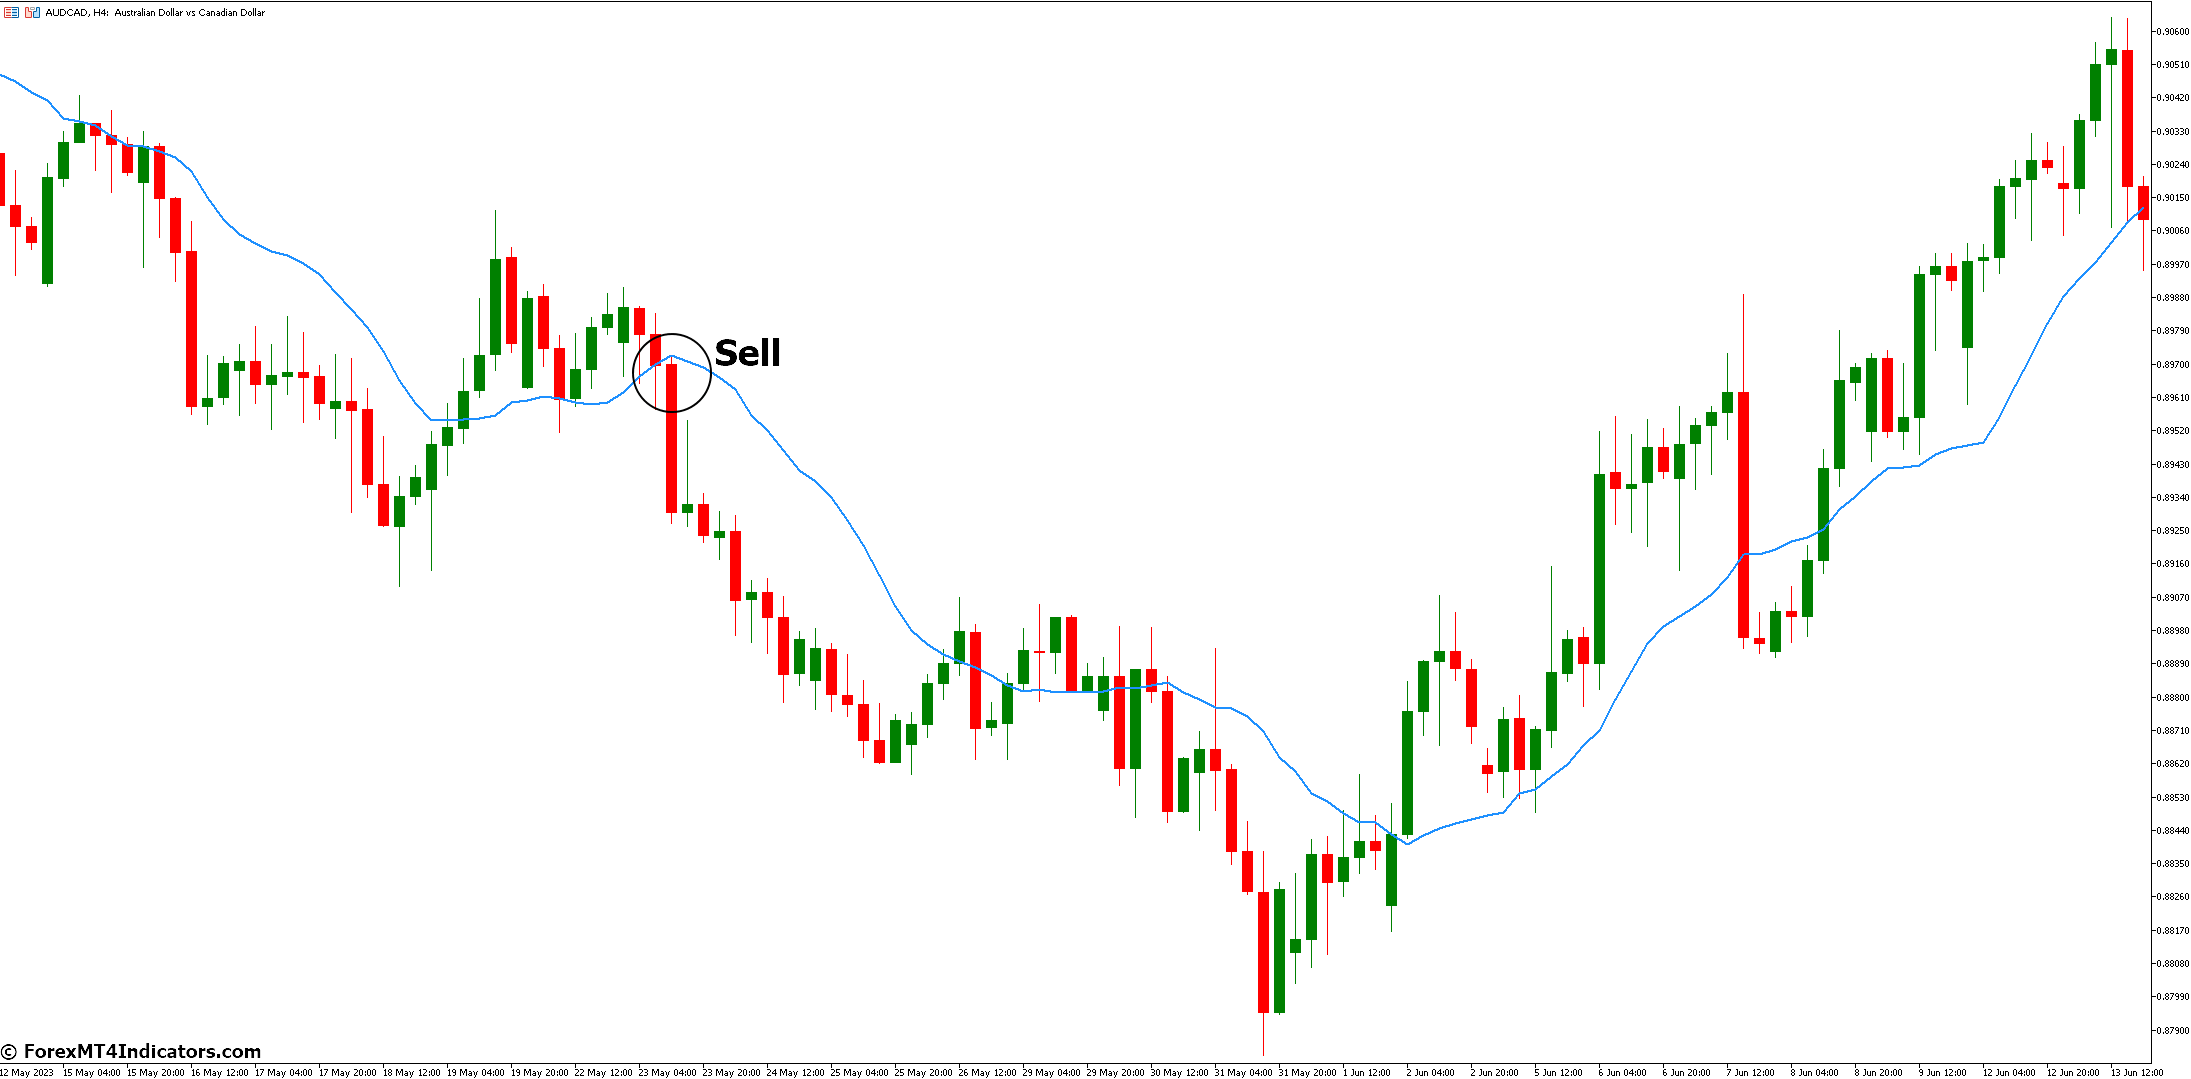
- Confirm that the TMA indicator is above the price action.
- This signals a downtrend.
- Wait until the price completely crosses the TMA from top to bottom.
- Initiate a short trade when the price drops below the TMA.
- Set your stop loss near the recent swing high level.
- Exit the trade when the price rises above the TMA.
TMA Indicator Settings
Conclusion
As you embark on your trading journey, embrace the TMA Indicator as your trusty sidekick. Its adaptability, precision, and ability to cut through market noise make it a valuable asset. Remember, successful trading isn’t about predicting the future it’s about understanding the present. TMA equips you with that understanding. So, fire up your MetaTrader 5, plot the TMA, and let the triangles guide you toward profitable trades.
Recommended MT5 Brokers
XM Broker
- Free $50 To Start Trading Instantly! (Withdraw-able Profit)
- Deposit Bonus up to $5,000
- Unlimited Loyalty Program
- Award Winning Forex Broker
- Additional Exclusive Bonuses Throughout The Year

>> Sign Up for XM Broker Account here <<
FBS Broker
- Trade 100 Bonus: Free $100 to kickstart your trading journey!
- 100% Deposit Bonus: Double your deposit up to $10,000 and trade with enhanced capital.
- Leverage up to 1:3000: Maximizing potential profits with one of the highest leverage options available.
- ‘Best Customer Service Broker Asia’ Award: Recognized excellence in customer support and service.
- Seasonal Promotions: Enjoy a variety of exclusive bonuses and promotional offers all year round.

>> Sign Up for FBS Broker Account here <<

(Free MT5 Indicators Download)
Click here below to download: