


There are many situations in the market where you would observe price to be oscillating up and down yet have a clear direction. Price could be making swing highs and swing lows, yet these swing points are constantly getting higher. This would be considered as a bullish trending market. Then, suddenly price creates a strong spike up making an irregularly high swing point. You get excited thinking that the market is about to move even higher. Suddenly, after one last smaller push, price reverses strongly and the trend reverses.
On the flip side, price could be constantly making new swing points that are constantly dropping. You identify a downtrend and have all the intention to trade only to the downside. Price drops extremely low, so you enter a trade thinking it will drop further. Then, price consolidates and then the downtrend reverses.
Looking at hindsight, you would notice a common theme, a trend reversal after a strong spike.
Traders salivate at the though being able to trade from the start of a new trend and exit as the trend ends. So much money is to be made in these types of market. However, this type of trading is quite difficult to execute. Many traders compare it to catching a knife.
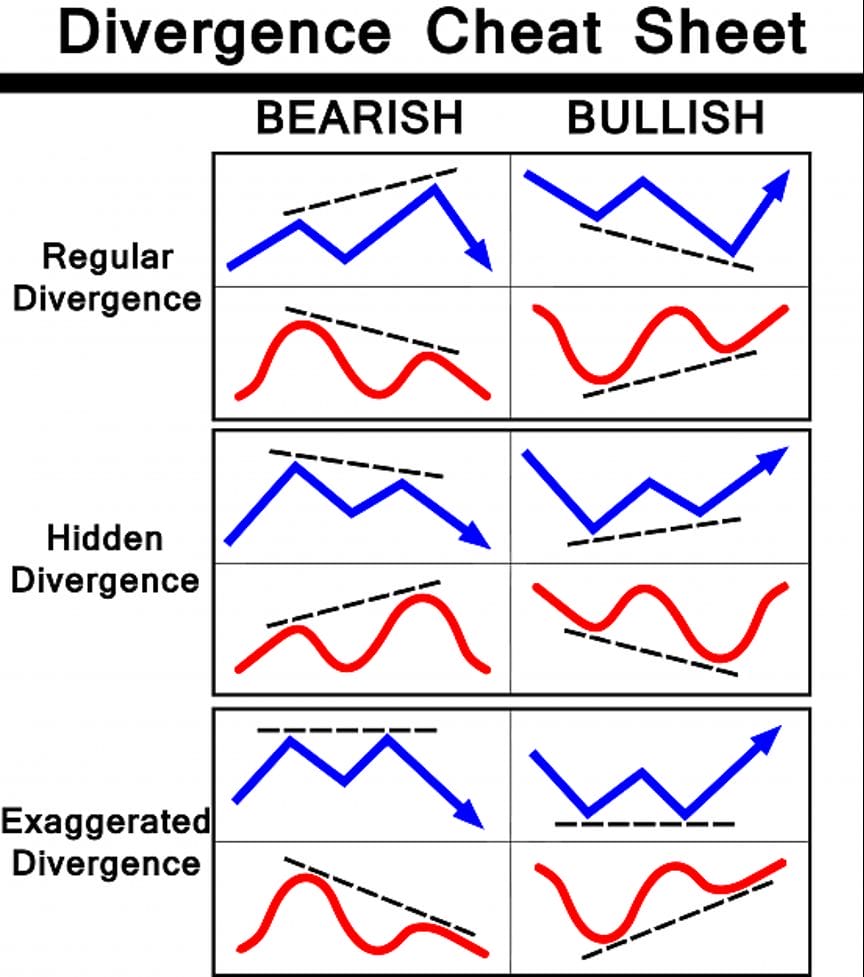
However, there are ways to anticipate these types of market. These are called regular divergences. These are conditions wherein the swing points on the price chart and the swing points on an oscillating indicator diverge in strength. Due to the limited range of an oscillating indicator, the strong spikes would often be plotted at an extreme level. Another swing point on the price chart would create a corresponding swing point on the oscillating indicator, yet it would diverge in height or depth, often lower than the previous peak or higher than the previous trough. This is characteristically a regular divergence.
You would observe how a regular divergence would look like on the chart below.
MACD OsMA
MACD refers to Moving Average Convergence and Divergence, while OsMA stands for Oscillator of Moving Averages.
MACD OsMA is an oscillating indicator which is a combination of the Moving Average Convergence and Divergence and the Oscillator of Moving Averages.
Like the regular MACD, it also has a MACD line and a signal line. It also has histogram bars representing the difference between the two lines. Trade signals are generated whenever the two lines crossover.
MACD Dot
MACD Dot is a custom indicator which is based on the classic MACD.
It creates entry signals based on the crossing over of a standard MACD. During a bullish trend reversal, this indicator would plot a blue dot below the candle. On the other hand, it plots a red dot on a candle whenever it detects a bearish reversal.
Trading Strategy
This strategy revolves around identifying divergences using the two indicators above.
Because the two indicators are based on the classic MACD, these two indicators work synergistically, allowing traders to easily identify swing points.
We should then observe both the price chart and the MACD OsMA window, looking for regular divergences.
Trades are taken as soon as we could clearly observe a regular divergence indicating a probable steep trend reversal.
Indicators:
- macd-dot (default setting)
- MACD_OsMA (default setting)
Preferred Time Frames: 1-hour, 4-hour and daily charts
Currency Pairs: major and minor pairs
Trading Sessions: Tokyo, London and New York sessions
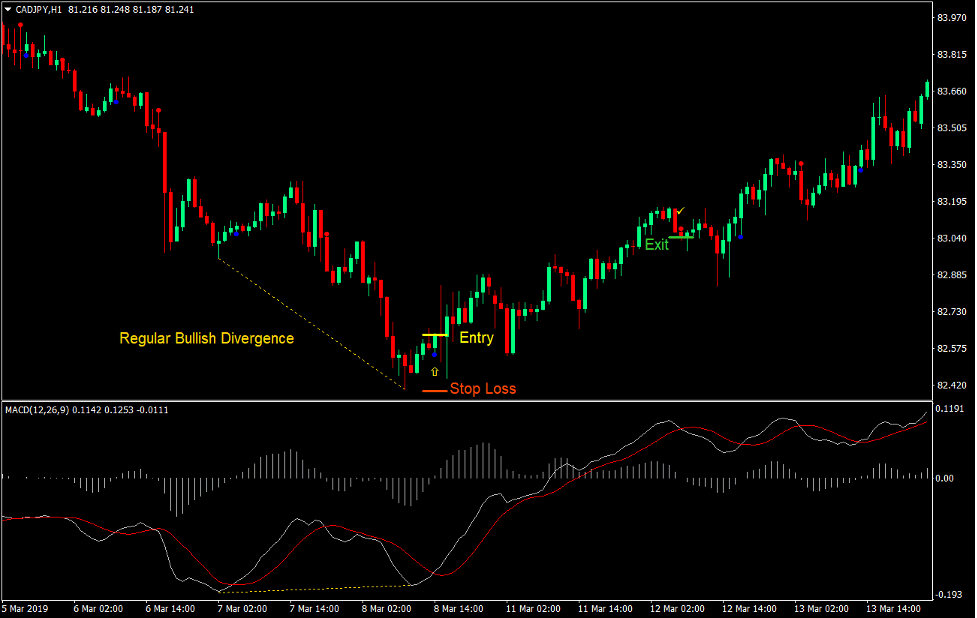
Buy Trade Setup
Entry
- Price should be consistently creating lower lows and highs indicating a downtrend.
- Price should drop steeply creating a deep swing low.
- The next swing low should be less steep than the drop.
- A bullish regular divergence should be clearly observed on the price chart.
- The MACD Dot indicator should plot a blue dot below price corresponding with the regular bullish divergence.
- Enter a buy order on the confirmation of the conditions above.
Stop Loss
- Set the stop loss on the fractal below the entry candle.
Exit
- Close the trade as soon as the MACD Dot indicator plots a red dot.
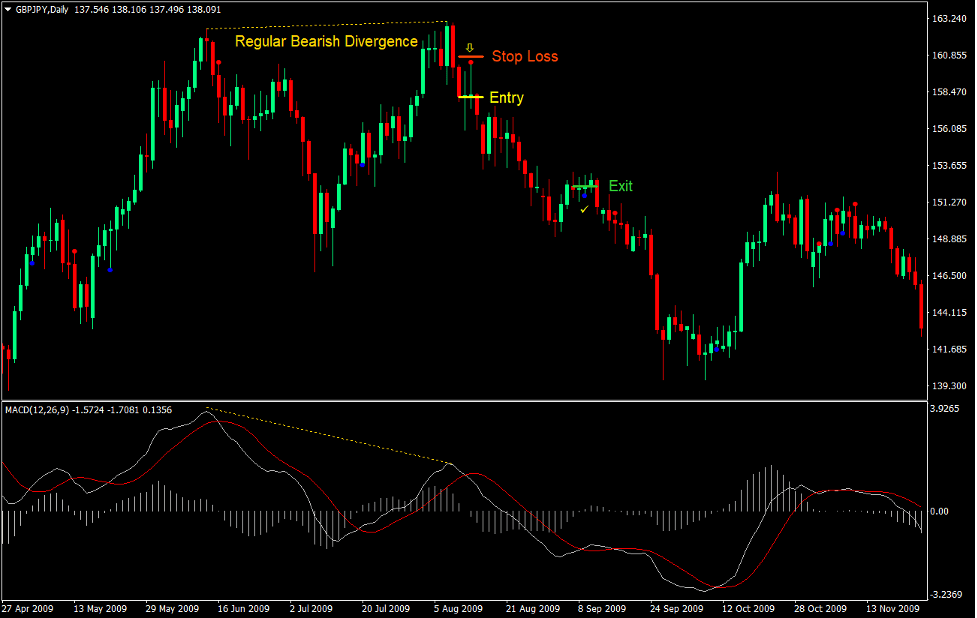
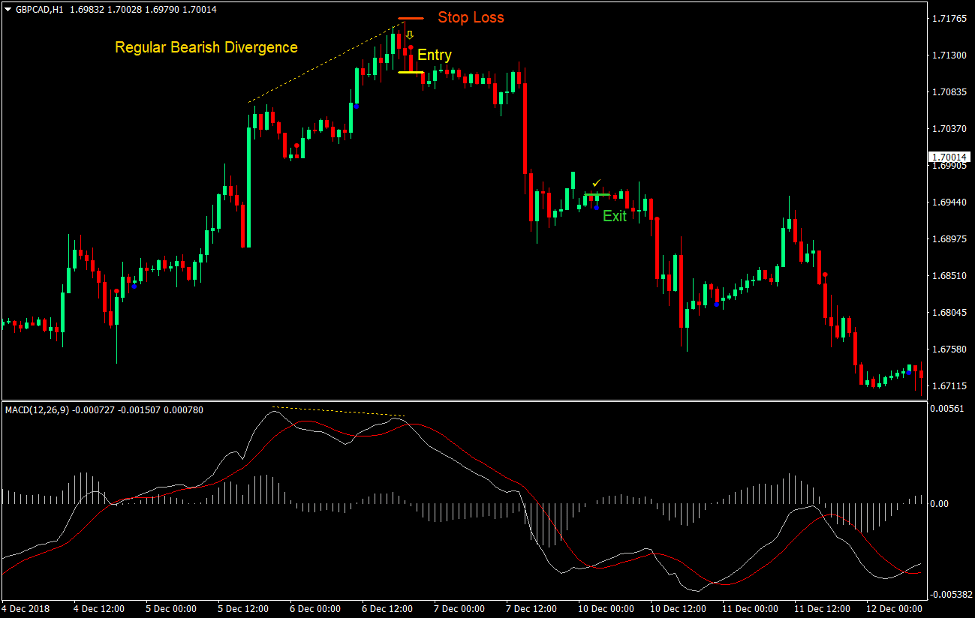
Sell Trade Setup
Entry
- Price should be consistently creating higher highs and lows indicating an uptrend.
- Price should spike aggressively creating a high swing high.
- The next swing high should be smaller than the spike.
- A bearish regular divergence should be clearly observed on the price chart.
- The MACD Dot indicator should plot a red dot above price corresponding with the regular bearish divergence.
- Enter a sell order on the confirmation of the conditions above.
Stop Loss
- Set the stop los on the fractal above the entry candle.
Exit
- Close the trade as soon as the MACD Dot indicator plots a blue dot.
Conclusion
There are very few traders who could successfully trade trend reversal coming from the peak or trough. This is a testament to the level of difficulty trend reversals have.
Traders who employ divergence trading strategies such as this have a better chance at capturing such high profit trades. Many traders who have mastered this craft could profit consistently from the market. Some even have a win rate of around 60% to 70%. Others claim they seldom have a loosing streak greater than three trades. This just shows that even a difficult trade setup such as a trend reversal could still be made accurate when used with the right strategy.
Recommended MT4 Brokers
XM Broker
- Free $50 To Start Trading Instantly! (Withdraw-able Profit)
- Deposit Bonus up to $5,000
- Unlimited Loyalty Program
- Award Winning Forex Broker
- Additional Exclusive Bonuses Throughout The Year

>> Sign Up for XM Broker Account here <<
FBS Broker
- Trade 100 Bonus: Free $100 to kickstart your trading journey!
- 100% Deposit Bonus: Double your deposit up to $10,000 and trade with enhanced capital.
- Leverage up to 1:3000: Maximizing potential profits with one of the highest leverage options available.
- ‘Best Customer Service Broker Asia’ Award: Recognized excellence in customer support and service.
- Seasonal Promotions: Enjoy a variety of exclusive bonuses and promotional offers all year round.

>> Sign Up for FBS Broker Account here <<
Click here below to download: