


Swing trading is a convenient way to trade the forex market for most people, especially those who are just starting to trade part-time.
It does not require traders to be glued on their trading stations the whole day. Instead, most swing trading strategies do not require more than a couple of hours a day. This is just to look for viable trade setups among the forex pairs that you are trading. It usually just takes a few minutes to decide whether a forex pair is worth looking at. Once you have narrowed down the number of pairs to just a few viable trade setups, then you could start analyzing which trade to take and which trades should be skipped. This process usually just takes less than an hour to accomplish, making it suitable for new traders who are trading part-time. This is perfect for those who have a full-time job or are attending school but are willing to spare an hour or two to trade.
For now, you could keep your day job while you are still mastering the craft of trading the forex markets. We have compiled five swing trading strategies that could work well for you.
Fisher Arrows Forex Swing Trading Strategy
Trading with the long-term trend is a proven way to trade the market. This is especially true with swing trading. The higher timeframes are where most institutional traders who are position traders play. These traders trade based on fundamental analysis and widely used technical indicators which they know other institutional traders are also looking at. This also includes long-term trend indicators. This is also where most swing and position traders base their trade direction on. Getting this right on the higher timeframes usually means winning half the battle.
The other half of the battle pertains to timing the entry. Now, there are many ways to time an entry. However, most of it is based on a confluence of several conditions. Usually it is about aligning the mid-term trend with the short-term trend or a momentum signal.
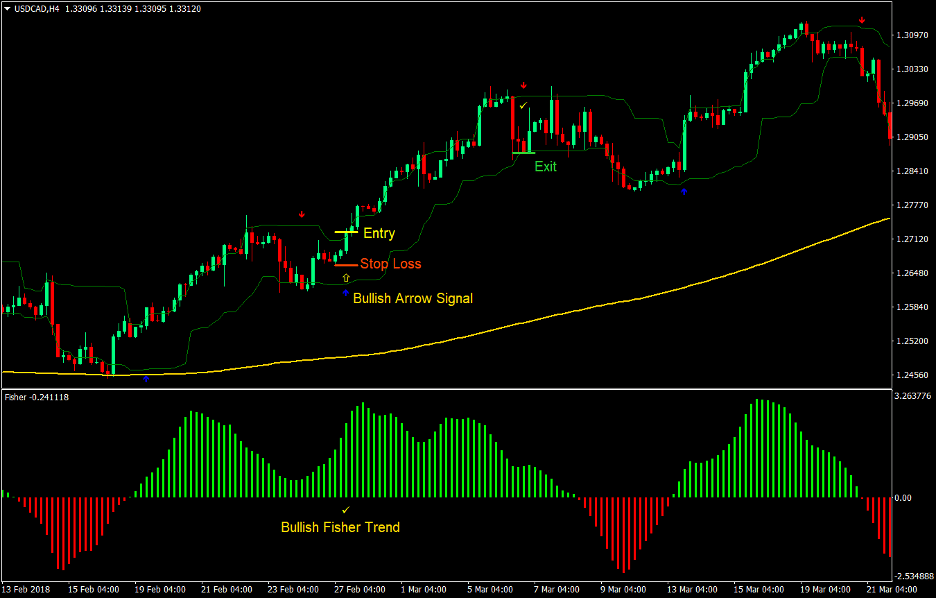
The Fisher Arrows Forex Swing Trading Strategy is a strategy which provides trade signals based on the confluence of the mid-term trend and a momentum signal, while at the same time trading in the direction of the long-term trend.
Fisher Indicator
The Fisher indicator is an oscillating indicator which helps identify trend direction. The indicator’s mathematical equation is based on a statistical normal distribution. This method allows the indicator to indicate how far price has moved from the mean as well as show the peaks and troughs within a trend.
The indicator indicates trend by displaying histogram bars. Positive bars indicate a bullish trend while negative bars indicate a bearish trend. This makes the indicator very useful as a trend filter indicator. However, crossovers from negative to positive or vice versa could also be interpreted as a trend reversal signal.
Lukas Arrows and Curves
Lukas Arrows and Curves is a custom indicator which provides trade entry signals. These signals are based on momentum price movements.
The Lukas Arrows and Curves indicator draws two lines on the price chart. One line above the other, forming a channel.
This indicator also paints arrows on the price chart indicating an entry signal whenever it detects a momentum reversal. These signals are based on the closing of price beyond the channel, which is indicative of a strong momentum candle.
Trading Strategy
This strategy aligns its trades with the long-term trend, which is based on the 200 Simple Moving Average (SMA). Trades are taken in the direction where price is in relation to the 200 SMA. Aside from this, the 200 SMA should also be sloping in the same direction.
The mid-term trend is based on the Fisher indicator. The mid-term trend should be aligned with the long-term trend based on whether the Fisher histogram bars are positive or negative.
Finally, the entry signal will be based on momentum shifts. These momentum signals will be provided by the Lukas Arrows and Curves indicator by printing arrows indicating the entry candle.
Indicators:
- 200 SMA
- lukas1_Arrows_Curves.ex4
- SSP: 14
- Fisher.ex4
- Period: 36
Timeframe: 4-hour and daily charts only
Currency Pairs: major and minor pairs
Trading Session: Tokyo, London and New York sessions
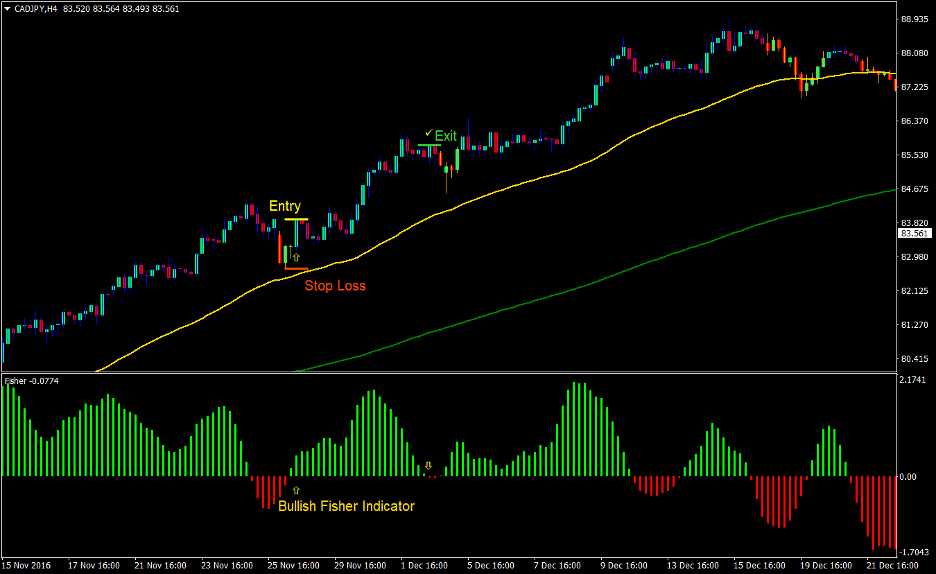
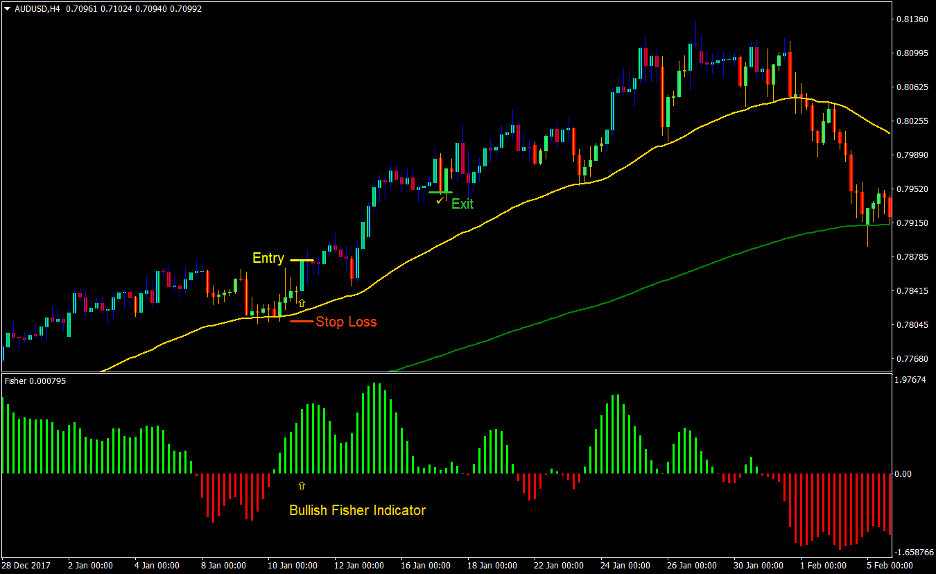
Buy Trade Setup
Entry
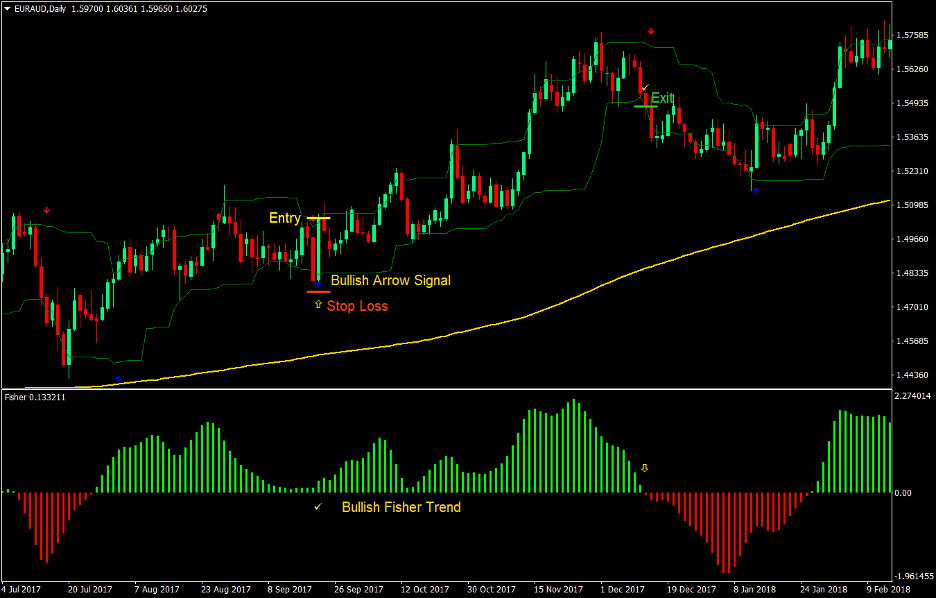
- Price should constantly be above the 200 SMA indicating a bullish trend.
- The Lukas Arrows and Curves channel should be above the 200 SMA.
- The 200 SMA should be sloping up indicating a bullish long-term trend.
- The Fisher indicator should be printing positive lime histogram bars indicating a bullish trend.
- The Lukas Arrows and Curves indicator should print an arrow pointing up indicating a bullish momentum entry signal.
- Enter a buy order on the confirmation of the conditions above.
Stop Loss
- Set the stop loss on the fractal below the entry candle.
Exit
- Close the trade as soon as an opposing signal is produced by the Lukas Arrows and Curves indicator.
- Close the trade as soon as the Fisher indicator prints negative red histogram bars.
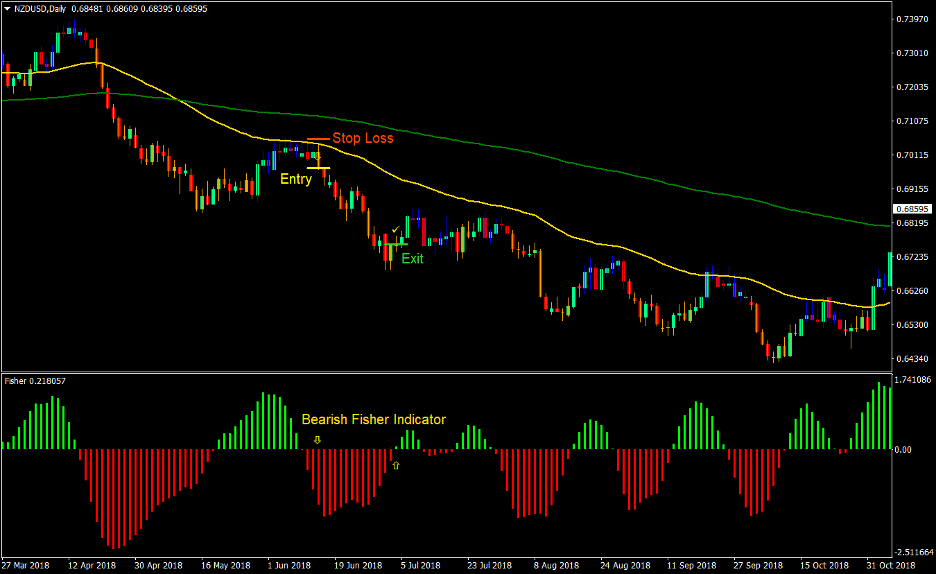
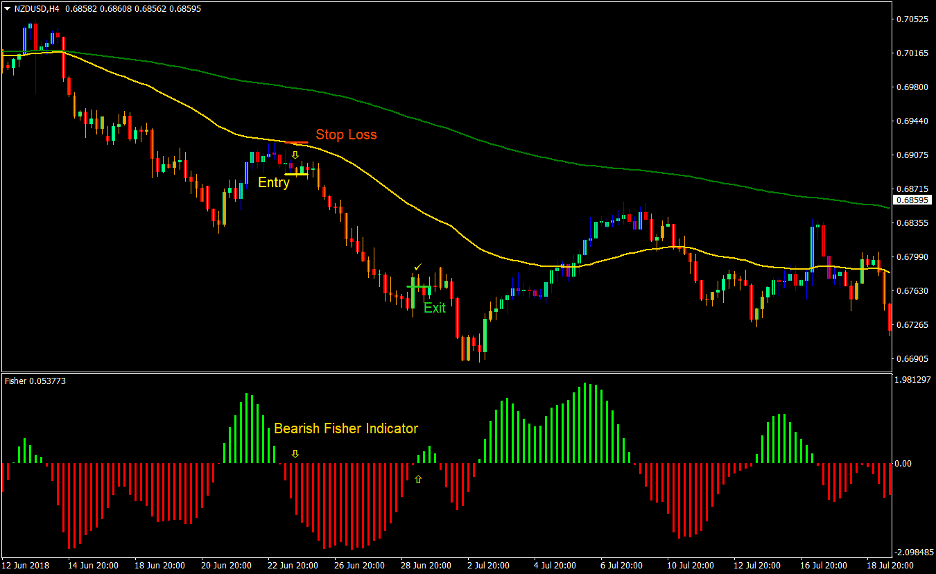
Sell Trade Setup
Entry
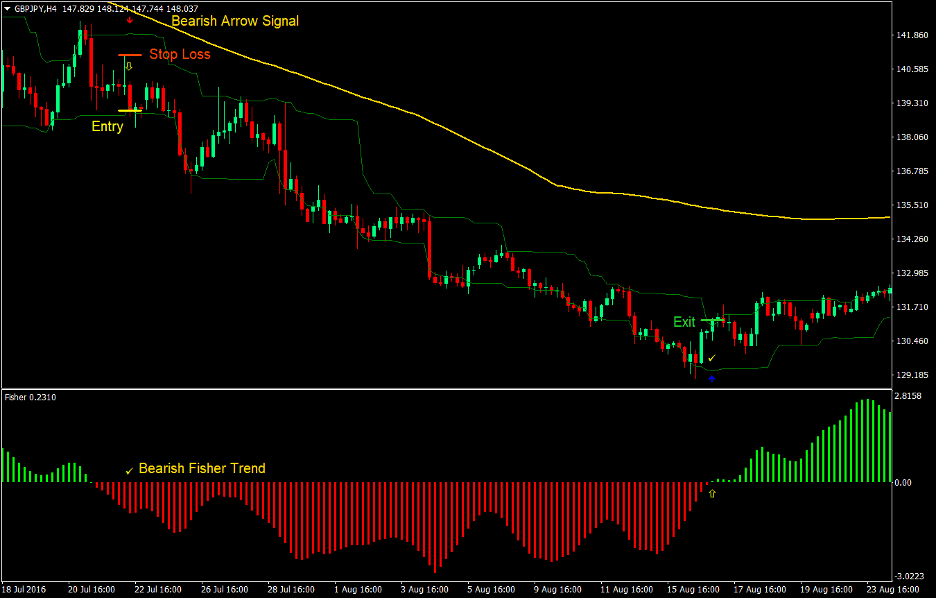
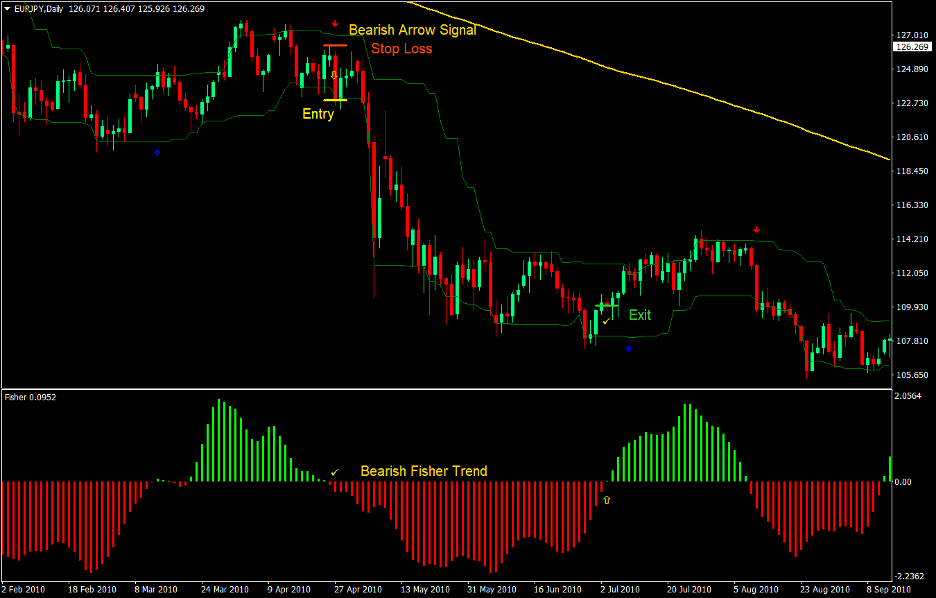
- Price should constantly be below the 200 SMA indicating a bearish trend.
- The Lukas Arrows and Curves channel should be below the 200 SMA.
- The 200 SMA should be sloping down indicating a bearish long-term trend.
- The Fisher indicator should be printing negative red histogram bars indicating a bearish trend.
- The Lukas Arrows and Curves indicator should print an arrow pointing down indicating a bearish momentum entry signal.
- Enter a sell order on the confirmation of the conditions above.
Stop Loss
- Set the stop loss on the fractal above the entry candle.
Exit
- Close the trade as soon as an opposing signal is produced by the Lukas Arrows and Curves indicator.
- Close the trade as soon as the Fisher indicator prints positive lime histogram bars.
Conclusion
This swing trading strategy is an effective swing trading strategy.
Many momentum-based trade signals are effective when traded on the 4-hour and daily charts. This is because traders would often take cues coming from the previous trading session. For example, traders who trade on the New York open would often take cues coming from the London session. This is often in line with the 4-hour and daily charts. This is what makes momentum signals quite effective on these timeframes.
There are times when price would temporarily chop around on the lower timeframes after the trade signal is taken. However, traders would often still take cues coming from a momentum signal which would often result in a trending market condition.
A sound trade management skill is also necessary on these timeframes. Swing trading allows traders to leave the trading station often. However, even on these timeframes, price movement is still unpredictable. For this reason, traders should learn to trail the stop loss effectively in order to ensure profits instead of giving it back to the market.
Advanced MACD Swing Forex Trading Strategy
You might have heard that trading charts are fractal. This means that the same patterns and behaviors occur again and again across different timeframes. To some extent this is true, but there are limitations to this. If it were totally true, then any strategy that would work on the 1-minute timeframe should also work on a daily chart. If you have observed currencies on both charts, you would know that this is not always the case.
Components within a strategy, such as price action, indicators, or filters, should match the timeframes that you are trading on. There are indicators that work well on the 1-minute chart but is totally rubbish on the 5-minute chart. There are also strategies that work on the daily charts and the 4-hour charts but does not make any sense on the 15-minute chart.
This strategy makes use of a very popular trading indicator that works well for swing trading. It is not perfect, but it does bring in some pips.
Zero Lag MACD
The Moving Average Convergence and Divergence (MACD) is a widely used technical indicator. In fact, many professional technical analysts use this indicator. This is probably why the MACD seems to be very effective on the higher timeframes.
However, even with its effectiveness, the MACD does have an Achille’s heel. It tends to lag too much.
The Zero Lag MACD is a modified version of the MACD. It is tweaked to adjust for the lag in order to provide traders a timelier indication of what the market is doing.
This indicator works much like the regular MACD. It displays a line and histogram bars. The histogram bars represent the traditional MACD line, which is the difference between two moving averages. The line represents the Signal Line, which is a moving average derived from the histogram bars.
Crossovers between the histogram bars and the signal line serve as an early indication of a probable reversal. These crossovers usually occur when the market is overextended based on the MACD indicator. Crossovers of the bars over the midline is another trend reversal signal. It may be a little more delayed compared to the histogram and signal line crossover, but it is more reliable.
ASC Trend
The ASC Trend indicator is a custom indicator which provides trade entry signals based on breakouts. It prints arrows on the price chart to signify an entry signal pointing towards the direction of the trend reversal.
This indicator is very simple yet very effective. Although it is not perfect, it tends to produce an accurate entry signal. It is even more effective when paired with a complementary indicator which could help filter out bad trades.
Trading Strategy
This strategy trades on swing points based on the Zero Lag MACD trend reversal signals.
However, instead of taking every trend reversal signal that is presented, this strategy filters out trades that goes against the flow of the long-term trend. The 200-period Simple Moving Average (SMA) will be used as the long-term trend filter. Trades will only be taken in the direction of the trend based on the 200 SMA. Trend direction is filtered based on where price is in relation to the 200 SMA and the slope of the 200 SMA.
On the Zero Lag MACD, trend reversal entries will be based on the crossing over of the histogram bars from negative to positive or vice versa. On the other hand, trade exits will be based on the reversal of the Signal Line towards the middle of the Zero Lag MACD range. This allows traders to enter on a confirmed trend reversal and exit early at the start of a probable mean reversal.
Finally, the specific entry candle will be based on the ASC Trend indicator. This would allow traders to have an accurate entry, which is confirmed by a momentum-based reversal.
Indicators:
- 200 SMA
- ZeroLag_MACD.ex4 (default setting)
- ASCTrend_BO.ex4
- RISK: 9
Timeframe: 4-hour and daily charts only
Currency Pairs: major and minor pairs
Trading Session: Tokyo, London and New York sessions
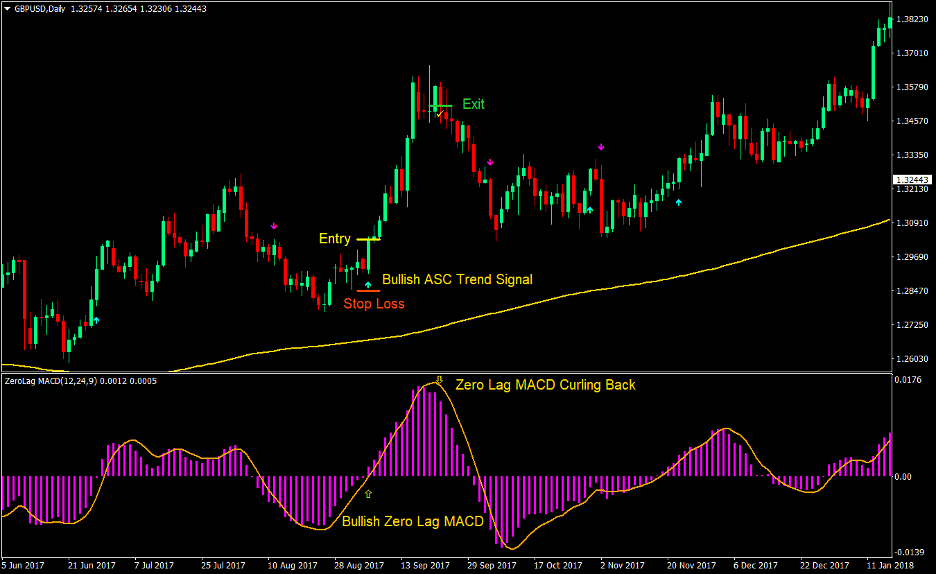
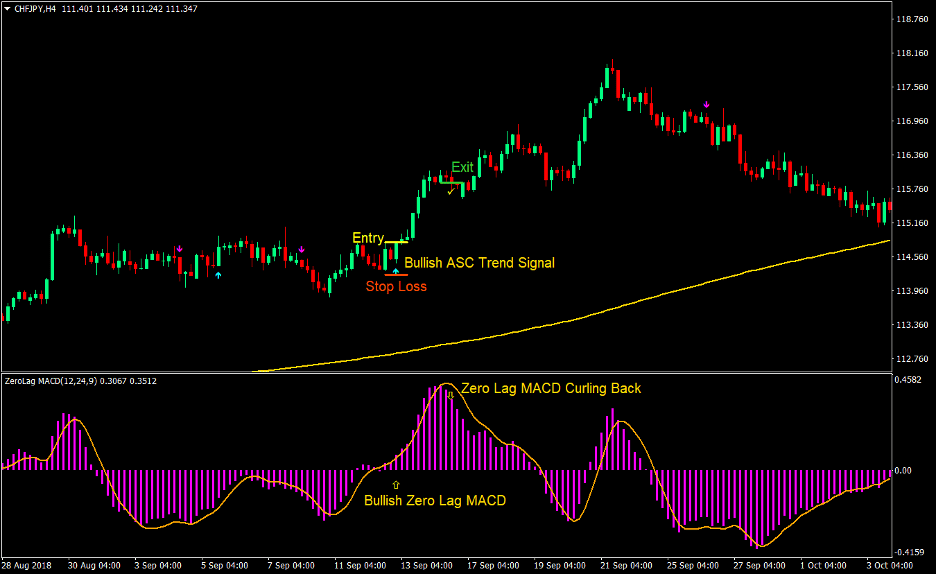
Buy Trade Setup
Entry
- Price should be above the 200 SMA line.
- The 200 SMA line should be sloping up indicating a bullish long-term trend.
- The Zero Lag MACD bars should cross above zero indicating a bullish trend reversal.
- The ASC Trend indicator should print an arrow pointing up indicating a bullish entry signal.
- These bullish trend reversal signals should be closely aligned.
- Enter a buy order on the confirmation of the conditions above.
Stop Loss
- Set the stop loss on the fractal below the entry candle.
Exit
- Close the trade as soon as the Zero Lag MACD signal line starts curling down towards the midline.
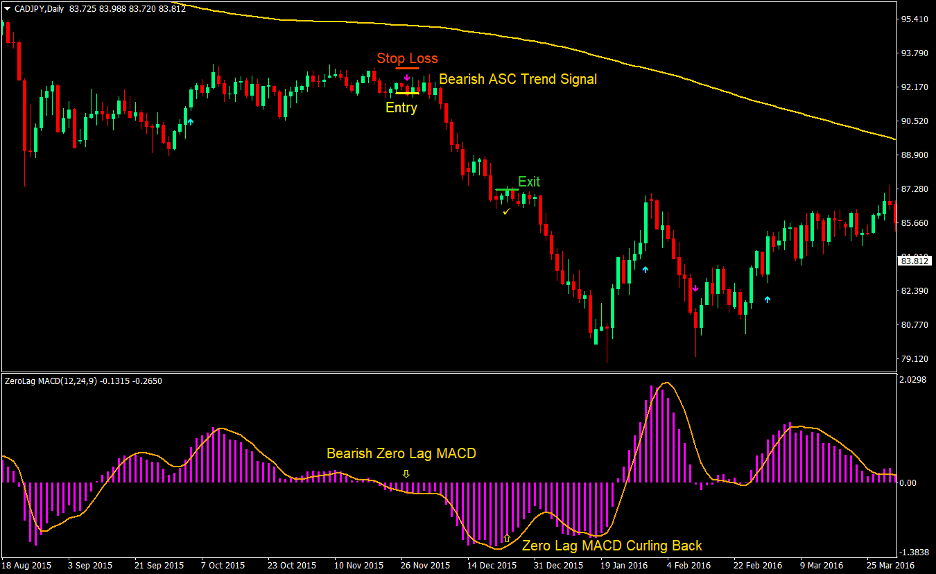
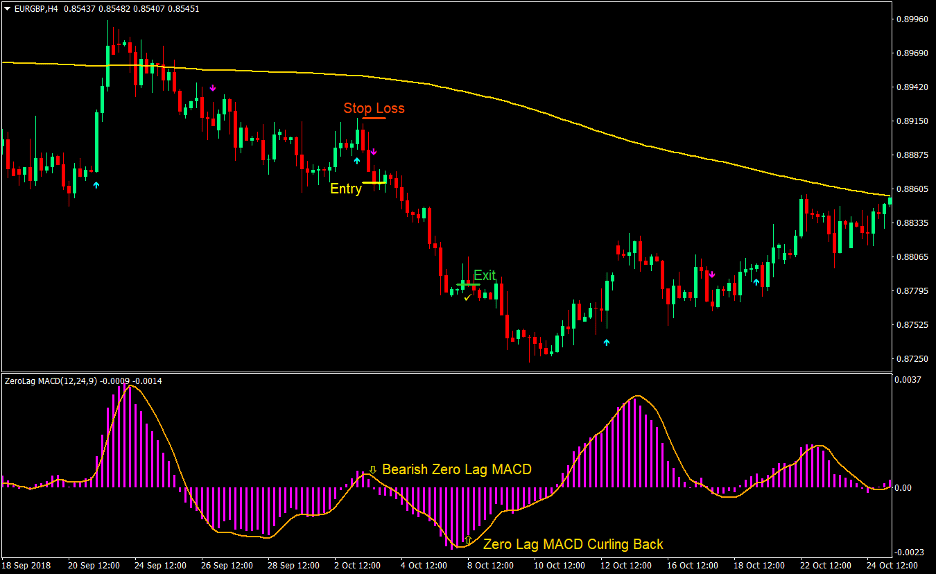
Sell Trade Setup
Entry
- Price should be below the 200 SMA line.
- The 200 SMA line should be sloping down indicating a bearish long-term trend.
- The Zero Lag MACD bars should cross below zero indicating a bearish trend reversal.
- The ASC Trend indicator should print an arrow pointing down indicating a bearish entry signal.
- These bearish trend reversal signals should be closely aligned.
- Enter a sell order on the confirmation of the conditions above.
Stop Loss
- Set the stop loss on the fractal above the entry candle.
Exit
- Close the trade as soon as the Zero Lag MACD signal line starts curling up towards the midline.
Conclusion
This trading strategy is one that works very well. It is not perfect, but it does work well. It produces high probability trade setups that would result in a good win ratio.
Although this strategy is very systematic, it would also help to have a confluence of other factors that could support the trade. It could either be breakouts of supports and resistances, confluence with a higher timeframe trend, or divergences. These confluences improve the probability of the trade setups much further.
Although there are times when price would surge resulting in huge gains, there will also be times when the gains are not that big. On these scenarios, it is best to stick to the plan instead of allowing greed to cause you to hold the trade too long.
There are also times when the exit signal from the Zero Lag MACD signal line is a bit too early and could cause traders to exit the trade even before the end of the trend. Conservative traders should exit trades whenever the signal line is showing signs of reversal. However, aggressive traders could opt to hold the trade even longer until it is clear that the market is reversing.
Heiken Ashi Smooth Trend Forex Swing Trading Strategy
Trend trading is also one of the types of strategies that could be applied when swing trading. It is not only doable, but it also has the most potential to produce huge gains in just a few trades.
Although attempting to catch trades that would result in huge trends is quite difficult, there is always a probability that the next trade you take may be that big trend that you are aiming for. Not only that, there are also ways to improve your chances of catching those huge waves.
One way of improving the probability of catching a huge trend is by using reliable indicators that keeps up with trends and trend reversals effectively. Trading on confluences of these indicators often produce trade setups that not only produces high reward-risk ratios but also an improved win ratio.
Heiken Ashi Smoothed
The Heiken Ashi Smoothed indicator is one of the most reliable trend indicators available for most traders. It reverses when the market has clearly reversed and stays with the trend until it has clearly ended.
The Heiken Ashi Smoothed indicator is a version of the Heiken Ashi candlesticks. Both indicators draw candles which change colors only when the trend has reversed. However, their similarities end there.
The regular Heiken Ashi candlesticks is more closely associated with the regular candlesticks, while the Heiken Ashi Smoothed indicator closely resembles the behavior of moving averages. In fact, the Heiken Ashi Smoothed indicator is derived from the Exponential Moving Average (EMA).
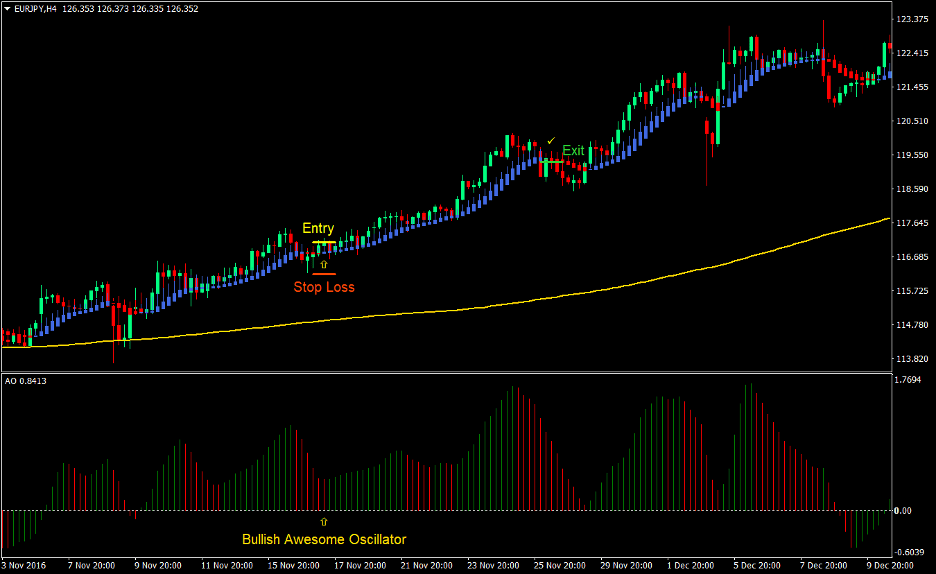
Awesome Oscillator
The Awesome Oscillator is a momentum indicator which indicates trend direction as an oscillating indicator.
This indicator displays histogram bars to indicate trend direction. The bars are based on the difference between the 5-period Simple Moving Average and the 34-period Simple Moving Average. These moving averages are based on the median of the candles instead of the close of the candle.
Positive bars indicate a bullish trend while negative bars indicate a bearish trend. Crossovers from negative to positive or vice versa are indicative of a trend reversal.
The bars also change colors depending on whether its value is bigger than the previous bar or not. Green bars indicate that the current bar has a bigger value than the previous bar, while red bars indicate that the current bar has a smaller value compared to the previous bar. In a bullish trend, green bars indicate that the trend is gaining momentum while red bars indicate that the trend is contracting. The opposite applies in a bearish trend. Red bars indicate momentum, while green bars indicate contraction.
Trading Strategy
This strategy trades on trend reversal signals based on the Heiken Ashi Smoothed indicator.
Trade signals are filtered based on the long-term trend as indicated by the 200 Simple Moving Average (SMA). This is based on the location of price in relation to the 200 SMA, as well as the direction of the slope of the 200 SMA.
Aside from the 200 SMA, trades are also filtered based on the trend direction as indicated by the Awesome Oscillator. Trade signals produced during an established trend as indicated by the Awesome Oscillator tend to have a high probability. However, there are also trade entries based on the confluence of trend reversal signals coming from the Awesome Oscillator and the Heiken Ashi Smoothed indicator that work well. This strategy however trades on existing trends as indicated by the Awesome Oscillator.
Indicators:
- 200 SMA
- Awesome Oscillator
- Heiken_Ashi_Smoothed.ex4 (default settings)
Timeframe: 4-hour and daily charts only
Currency Pairs: major and minor pairs
Trading Session: Tokyo, London and New York sessions
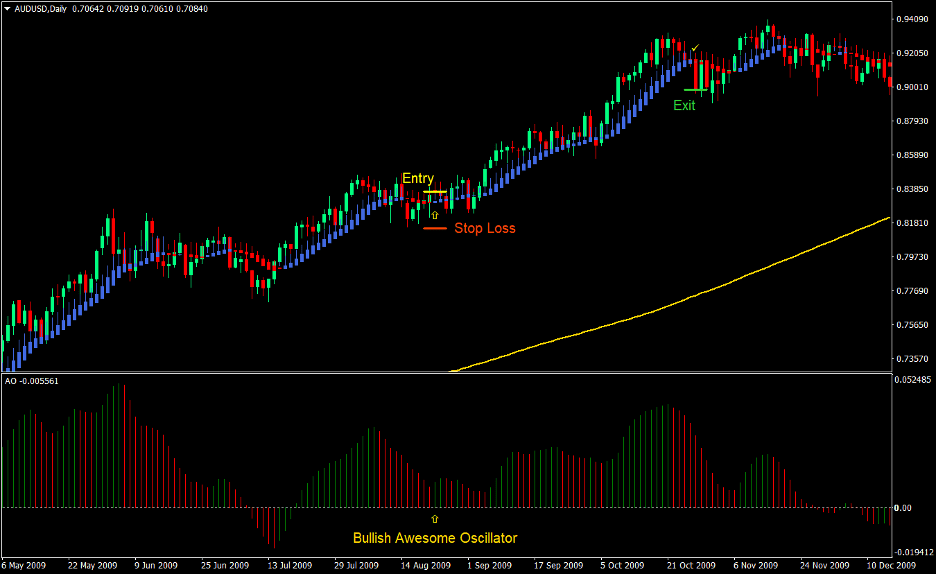
Buy Trade Setup
Entry
- Price should be above the 200 SMA.
- The 200 SMA should be sloping up indicating a bullish long-term trend.
- The Awesome Oscillator bars should be positive indicating a bullish trend direction.
- The Heiken Ashi Smoothed candles should change to blue indicating a bullish trend reversal.
- Enter a buy order upon the confirmation of the conditions above.
Stop Loss
- Set the stop loss on the fractal below the entry candle.
Exit
- Close the trade as soon as the Heiken Ashi Smoothed candles change to red.
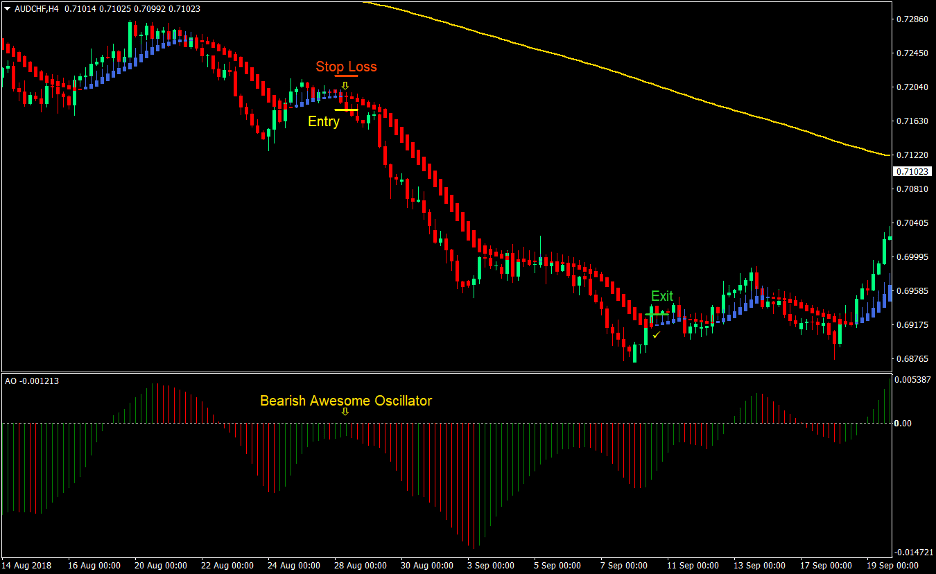
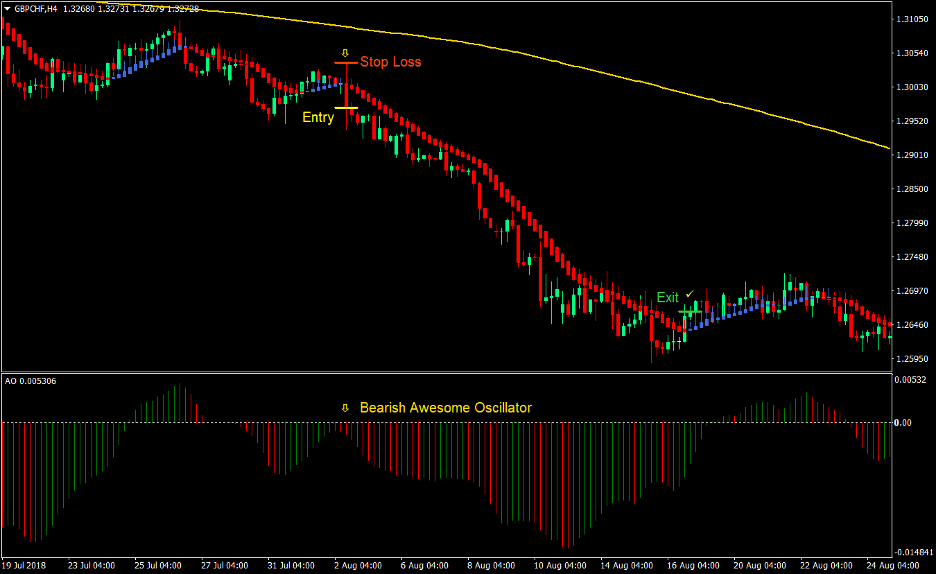
Sell Trade Setup
Entry
- Price should be below the 200 SMA.
- The 200 SMA should be sloping down indicating a bearish long-term trend.
- The Awesome Oscillator bars should be negative indicating a bearish trend direction.
- The Heiken Ashi Smoothed candles should change to red indicating a bearish trend reversal.
- Enter a sell order upon the confirmation of the conditions above.
Stop Loss
- Set the stop loss on the fractal above the entry candle.
Exit
- Close the trade as soon as the Heiken Ashi Smoothed candles change to blue.
Conclusion
This strategy is the type of strategy that could produce huge gains in just a few trades. However, there are also trades that could reverse right away resulting in small gains or losses. In the long run, this strategy should result in a decent win ratio with a high reward-risk ratio.
Trailing the stop loss to protect gains is also very useful with this strategy. This allows traders to avoid giving back profits to the market. One technique would be to trail the stop loss a few Heiken Ashi candles behind the current candle.
Manual exits based on the behavior of price action would also be very beneficial. This is probably the most efficient way to exit trades, however it takes a lot of practice and experience to master exiting trades based on price action.
Octopus Trend Forex Swing Trading Strategy
Crossover strategies are probably one of the most popular types of trading strategies among beginning traders. However, there are certain stigmas that come with crossover strategies.
Some traders may think that crossover strategies are just for “beginners”. While there are many new traders who get attracted to the simplicity of crossover strategies, many professional traders use it as well, either as a confirmation of a trend, a precision entry strategy on a lower timeframe, or whatnot.
Others believe that crossover strategies have already lost its edge. To some extent, certain crossover strategy setups might not be working as well as they used to. However, trading strategies should not be used as a “one size fits all” strategy. Each strategy work best for different market conditions. There are certain indications and hints pertaining to the type of condition that the market is in that should be considered but are beyond moving average crossovers.
The Octopus Trend Forex Swing Trading Strategy is a crossover strategy that is based on momentum. This strategy uses a reliable crossover setup and is confirmed by complementary indicators and momentum.
Octopus Indicator
The Octopus indicator is a custom momentum indicator which helps traders identify trend direction. This indicator points the direction of the trend by displaying bars. These bars change colors depending on the direction of the trend. Green bars indicate a bullish trend direction, while red bars indicate a bearish trend direction.
There are two variations of the Octopus indicator – Octopus 1 and Octopus 2. Both indicators are somewhat similar. The only difference is the parameters used within the indicators. Octopus 1 tends to be more stable, while Octopus 2 tends to be more responsive to trend changes. In a typical trend reversal scenario, it is usually the Octopus 2 indicator that would reverse first
However, there are instances where the trend reversal signals coming from the two indicators are very close. These scenarios usually occur when there is a strong momentum shift that caused the trend reversal.
Trading Strategy
This trading strategy is a basic crossover strategy using a 13-period Exponential Moving Average (EMA) and a 55-period Exponential Moving Average (EMA).
This crossover trade setup is much like the usual crossover strategies. It produces gains and losses from time to time. However, when filtered using the two Octopus indicators and a momentum candle, trade setups tend to be more reliable and would often result in profits.
For a crossover to be considered as a valid trade setup, there should be a big momentum candle that initiated the trend reversal.
To confirm the trend reversal based on momentum, the two Octopus indicators should also agree with the trend direction as indicated by the moving average crossover and the momentum candle.
Trades are then kept open until one of the two Octopus indicators would reverse. This would usually be the Octopus 2 indicator. This allows traders to enter the trade when the trend reversal is confirmed and exit the trade early when signs of another trend reversal starts to show.
Indicators:
- 13 EMA
- 55 EMA
- octopus_1.ex4 (default settings)
- octopus_2.ex4 (default settings)
Preferred Time Frames: 4-hour and daily charts
Currency Pairs: major and minor pairs
Trading Session: Tokyo, London and New York sessions
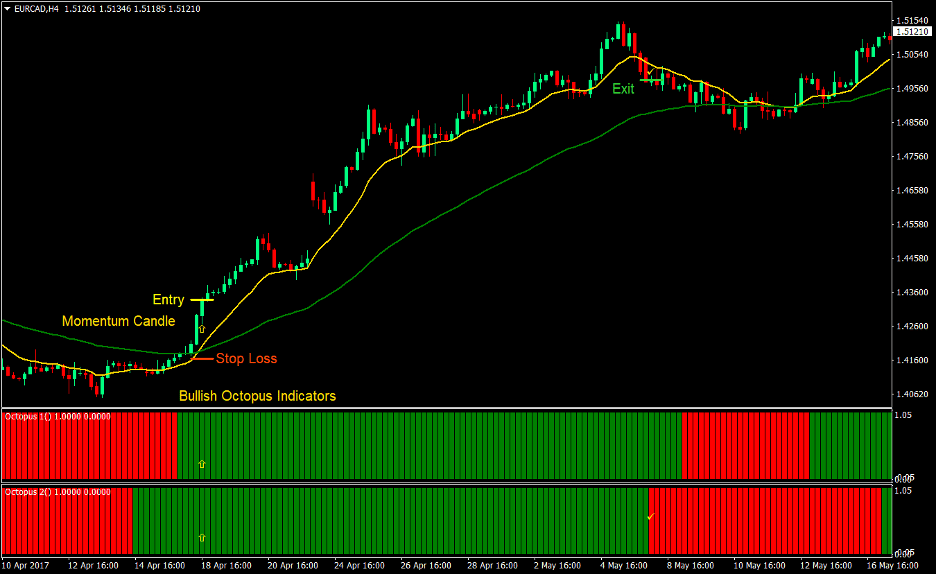
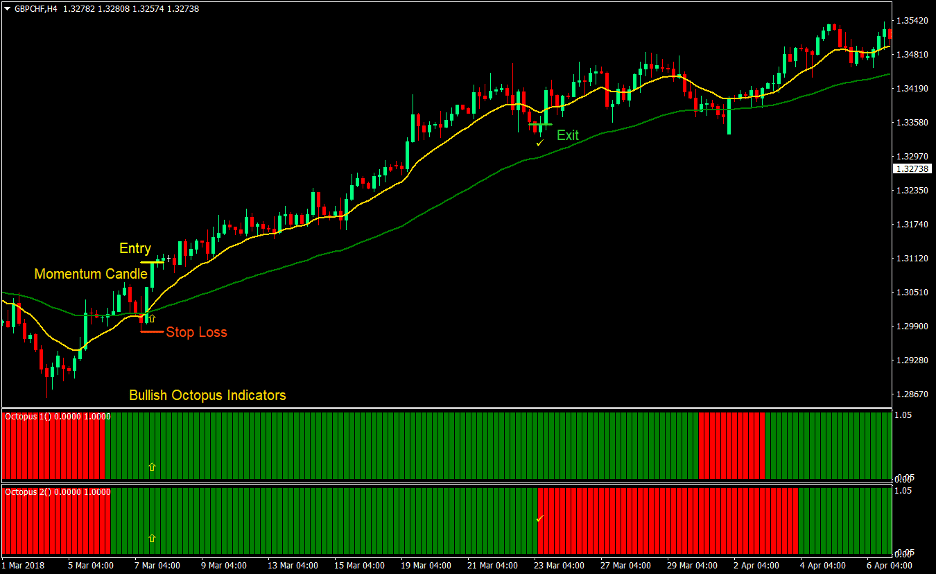
Buy Trade Setup
Entry
- Price should cross above both the 13 EMA and the 55 EMA.
- The 13 EMA should cross above the 55 EMA indicating a bullish trend reversal.
- A bullish momentum candle should be observable on the chart.
- The Octopus 1 and Octopus 2 indicators should be displaying green bars indicating a bullish trend.
- These bullish trend reversal signals should be closely aligned.
- Enter a buy order on the confirmation of the conditions above.
Stop Loss
- Set the stop loss on the fractal below the entry candle.
Exit
- Close the trade as soon as one of the Octopus indicators would start displaying a red bar.
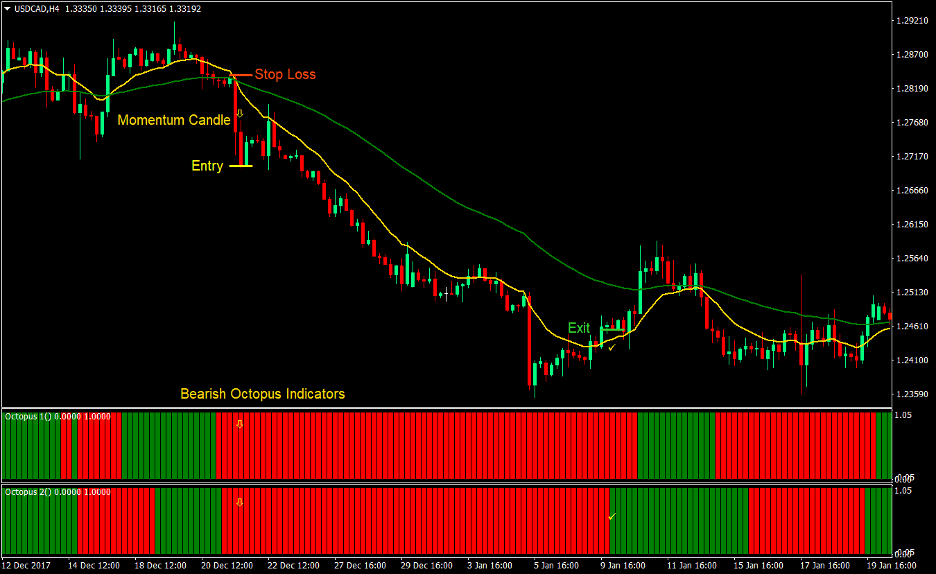
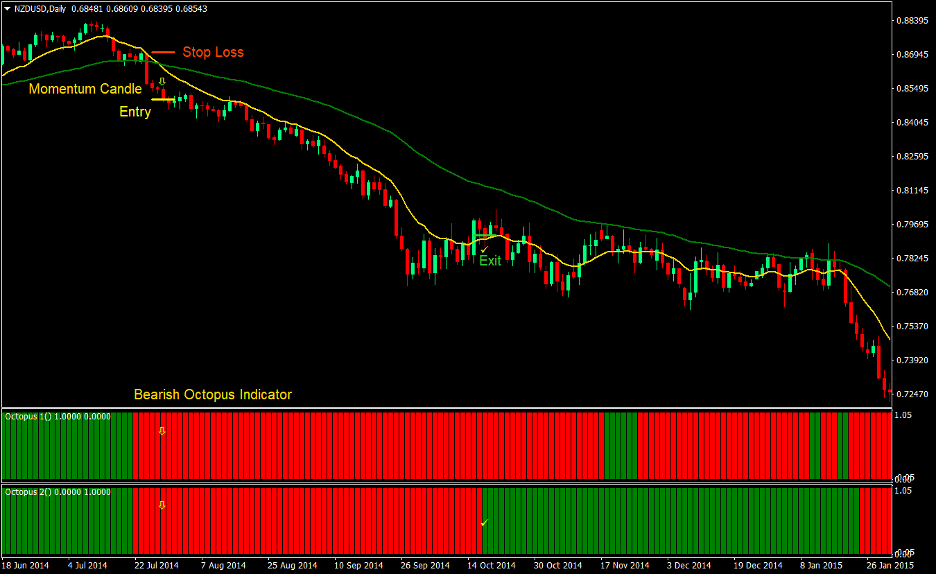
Sell Trade Setup
Entry
- Price should cross below both the 13 EMA and the 55 EMA.
- The 13 EMA should cross below the 55 EMA indicating a bearish trend reversal.
- A bearish momentum candle should be observable on the chart.
- The Octopus 1 and Octopus 2 indicators should be displaying red bars indicating a bearish trend.
- These bearish trend reversal signals should be closely aligned.
- Enter a sell order on the confirmation of the conditions above.
Stop Loss
- Set the stop loss on the fractal above the entry candle.
Exit
- Close the trade as soon as one of the Octopus indicators would start displaying a green bar.
Conclusion
This simple crossover strategy is one which could return decent profits when used right.
Crossover strategies on their own are not as reliable as it used to be. However, occasionally, it allows traders to catch a huge trend, which makes traders profitable.
This strategy however uses a couple of indicators and a momentum candle to confirm such trend reversal. This greatly improves the reliability of this crossover strategy while maintain a decent reward-risk ratio.
Traders who would want to maximize gains on trades that result in trends should keep their trades open until one of the indicators show signs of a possible reversal. However, another good option for exiting trades using this strategy is by setting a fixed take profit target based on a multiple of the risk placed on the stop loss. This provides a fixed reward-risk ratio that is positive.
This strategy would also require active trade management as trends may reverse any time without warning. This includes moving stop losses to breakeven and trailing stop losses to protect profits.
Gann Fisher Trend Forex Swing Trading Strategy
Although swing trading is inherently a longer-term strategy, short-term trend strategies also do apply in swing trading. Holding periods might not be as long as most mid-term swing trading strategies, but short-term trends on a higher timeframe do produce positive results.
Identifying trends is usually dependent on the type of indicator that is used by a trader. There are indicators that are more suitable for identifying longer-term trends and there are indicators that are better at identifying shorter-term trends. Some indicators are best used on the higher timeframes while others are best for the lower timeframes. However, there are indicators that despite the length of the trend that it is detecting, could still be used on most timeframes, whether a higher timeframe or a lower timeframe.
The Gann Fisher Trend Forex Swing Trading Strategy is a strategy that identifies shorter-term trend reversals using indicators. These short-term trends often produce trade setups that have a positive expectancy as long as it is in line with the longer-term trend.
Gann HiLo Activator Bars
The Gann HiLo Activator Bars is a momentum technical indicator which helps traders identify short-term trends.
It detects short-term trend reversals and indicates the direction of the trend by overlaying bars on the candlesticks. The bars change colors depending on the direction of the trend. In this setup, the bars are colored blue whenever the indicator detects a bullish short-term trend, and orange whenever it detects a bearish short-term trend.
Fisher Indicator
The Fisher indicator is a custom indicator which is displayed as an oscillating indicator.
This indicator detects momentum based on a statistical normal distribution. It then indicates trend direction by displaying histogram bars which oscillate around zero. Positive bars indicate a bullish trend while negative bars indicate a bearish trend. The bars also change colors depending on the direction of the trend to clearly indicate trend direction and reversals. In this setup, positive bars are colored lime while negative bars are colored red.
Trading Strategy
This trading strategy is a high probability trade strategy based on the confluence of the Fisher indicator and the Gann HiLo Activator Bars.
To trade this strategy, trade setups should be in line with the long-term and mid-term trend. The 200-period Exponential Moving Average (EMA) represents the long-term trend while the 50-period Exponential Moving Average (EMA) represents the mid-term trend. Trend direction will be based on three items. First, trend direction will be based on the location of price in relation to the moving averages. Second, trend direction will also be based on the slope of the moving averages. Third, trend direction is confirmed based on how the moving averages are stacked. As soon as the trend is confirmed based on the conditions above, trade setups could be traded in the direction of the trend.
Trades will be based on retracements towards the 50 EMA and the resumption of the short-term trend direction, in line with the longer-term trends. After the retracement, the Gann HiLo Activator Bars and the Fisher indicator should indicate a trend reversal aligning with the longer-term trends, which would serve as the entry signal.
Indicators:
- 50 EMA
- 200 EMA
- Gann HiLo activator bars (default setup)
- Fisher.ex4 (default setup)
Timeframes: 4-hour and daily charts
Currency Pairs: major and minor pairs
Trading Session: Tokyo, London and New York sessions
Buy Trade Setup
Entry
- Price should be above the 50 EMA and the 200 EMA.
- The 50 EMA and the 200 EMA should be sloping up indicating a bullish trend.
- The 50 EMA should be above the 200 EMA indicating a bullish trend.
- Price should retrace near the 50 EMA.
- The retracement should cause the Gann HiLo Activator Bars to print orange bars temporarily.
- The retracement should cause the Fisher indicator to print red bars temporarily.
- Enter a buy order as soon as the Gann HiLo Activator Bars starts printing blue bars and the Fisher indicator starts printing lime bars.
Stop Loss
- Set the stop loss on the fractal below the entry candle.
Exit
- Close the trade as soon as the Gann HiLo Activator bars starts printing orange bars.
- Close the trade as soon as the Fisher indicator starts printing red bars.
Sell Trade Setup
Entry
- Price should be below the 50 EMA and the 200 EMA.
- The 50 EMA and the 200 EMA should be sloping down indicating a bearish trend.
- The 50 EMA should be below the 200 EMA indicating a bearish trend.
- Price should retrace near the 50 EMA.
- The retracement should cause the Gann HiLo Activator Bars to print blue bars temporarily.
- The retracement should cause the Fisher indicator to print lime bars temporarily.
- Enter a sell order as soon as the Gann HiLo Activator Bars starts printing orange bars and the Fisher indicator starts printing red bars.
Stop Loss
- Set the stop loss on the fractal above the entry candle.
Exit
- Close the trade as soon as the Gann HiLo Activator bars starts printing blue bars.
- Close the trade as soon as the Fisher indicator starts printing lime bars.
Conclusion
This trading strategy produces short-term trade signals even on a higher timeframe as a swing trading strategy.
This strategy is highly reliable and should produce positive results over the long-term.
Trade setups often result in yields which are usually twice the risk on the stop loss. This produces a positive reward-risk ratio which gives the strategy a positive expectancy.
The key to trading this strategy is in identifying moderately trending markets that retrace towards the 50 EMA. Avoid trading extremely strong trends as retracements following an extremely strong trend often continue to become an actual trend reversal. Identifying the right trends would result in higher probability trades that could produce decent yields.
Final Words
These five swing trading strategies would work well depending on the market condition being traded. Most of the strategies presented are best traded on trending markets. Some work best on strong trends while others are more suitable for trends with moderate strength. Some trade at the start of a fresh trend reversal while others trade on retracements. Some strategies have longer holding periods while others trade on shorter momentum bursts.
These five trading strategies could allow you to trade in any trend reversal or trending market condition. The key to successfully using these strategies is in identifying the market condition correctly and using the right trading strategy for that market. Trade wisely.
Recommended MT4 Brokers
XM Broker
- Free $50 To Start Trading Instantly! (Withdraw-able Profit)
- Deposit Bonus up to $5,000
- Unlimited Loyalty Program
- Award Winning Forex Broker
- Additional Exclusive Bonuses Throughout The Year

>> Sign Up for XM Broker Account here <<
FBS Broker
- Trade 100 Bonus: Free $100 to kickstart your trading journey!
- 100% Deposit Bonus: Double your deposit up to $10,000 and trade with enhanced capital.
- Leverage up to 1:3000: Maximizing potential profits with one of the highest leverage options available.
- ‘Best Customer Service Broker Asia’ Award: Recognized excellence in customer support and service.
- Seasonal Promotions: Enjoy a variety of exclusive bonuses and promotional offers all year round.

>> Sign Up for FBS Broker Account here <<
Click here below to download: