


Forex Stochastic Strategy Introduction:
[toc] In this blog post, I’m going to teach you how to use stochastic indicator properly and finally, you can implement it to your trading and your trading performance is improve. That is my goal in this post. I don’t to waste a lot of your time for only reading this report so I made it into a short and well packed!
Basically, stochastic is like any other oscillator but it probably has slight difference in my opinion.
Stochastic oscillator was developed by a trader called George Lane. The stochastic has a range of 0-100 and you can also see that there is an upper mark 80% and lower mark 20%.
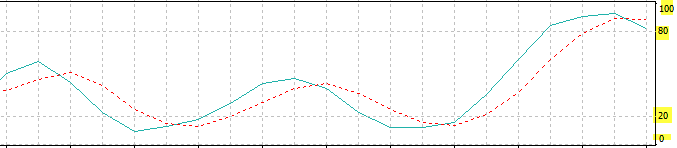
When the lines move above the 80%, this indicates that the market is in overbought condition and we’re looking for a sell signal. While when the lines move below the 20%, the market is oversold and we should be looking for buy signal.
However, this is just a basic method to use stochastic. I believe there are many other methods out there but in this report, I’m going to introduce you the powerful method ever to dominate the forex market using this indicator.
The Forex Stochastic Strategy Method:
Here is the steps outline:
-
Identify the trend – to filter bad trades
-
Use the oversold and overbought technique
Step 1: Identify the trend
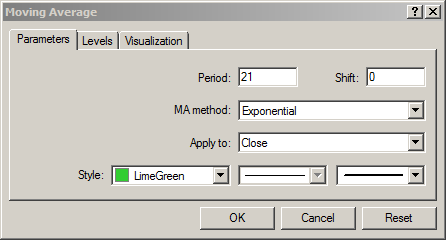
Open your chart and set exponential moving average 21 to become your trend indicator. I believe most of you understand how to use it, however, anyway I will explain how to use this indicator.
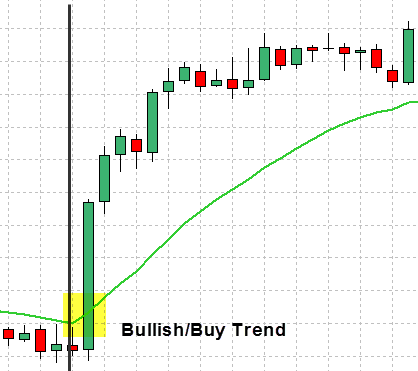
Buying/Bullish Market:
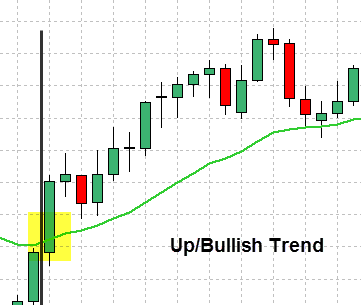
When the EMA(Exponential Moving Average) 21 is below the price, it shows that the market is trending up. Hence, we are looking for buy signal. The buy signal will come from the stochastic. We are only using the trend to filter bad trade (trade that against the trend). Get the idea? I’ll explain about the stochastic later on.
Example 1:
Example 2:
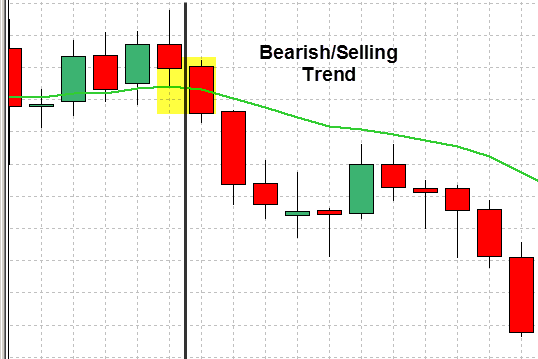
Selling Market:
When the EMA(Exponential Moving Average) 21 is above the price, it shows that the market is trending down. Hence, we are looking for sell signal.
Example 1:
Example 2:
Step 2: Stochastic – Cross Over
-
If the trend is trending up, then look for stochastic Cross Over (blue line cross above the red line), then get ready to buy.
-
If the trend is trending down, look for stochastic Cross Over (the blue cross below the red line), then get ready to sell.
Now, see how the stochastic work:
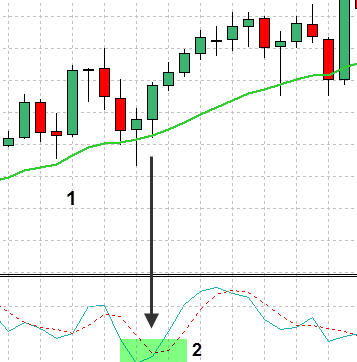
For Buy:
Example 1:
-
Shows the market is trending up
-
Stochastic Cross Over
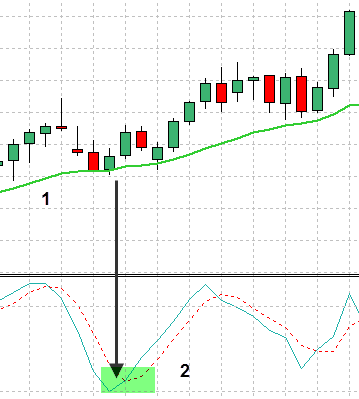
Example 2:
 1, Trend is up. 2, Stochastic Cross Over
 1, Trend is up. 2, Stochastic Cross Over
For Sell:
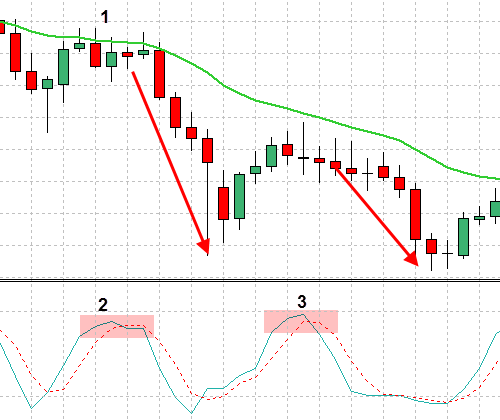
-
The market is trending down
-
Stochastic Cross Over (first sell entry)
-
Another Cross Over(second sell entry)
That’s it! Congrats for reaching up to this point.
The Forex Stochastic Strategy Bonus Method:
Here is another way to use the stochastic to identify the reversal point of the market. With this bonus method, you can detect early selling or buying signal of the market.
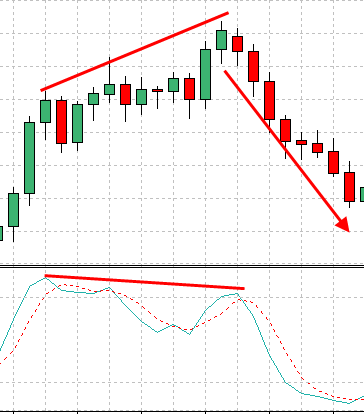
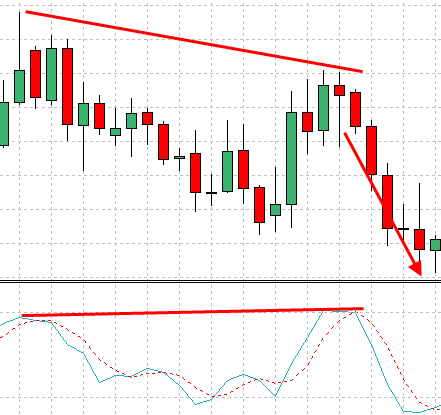
Usually, the stochastic and the price trending up on the same times and when the price is trending down, the stochastic is also trending down. What if the price is pointing up whilst the stochastic pointing down? That is abnormal and this is called divergence in forex trading.
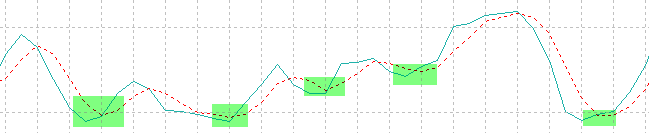
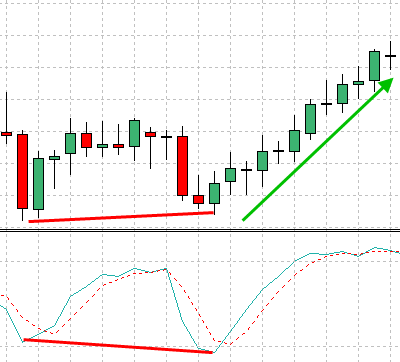
We are looking for buy when the divergence occurs on the lower side:
Example 1:
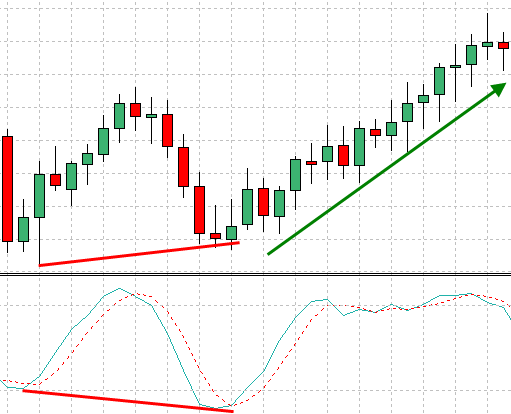
Example 2:
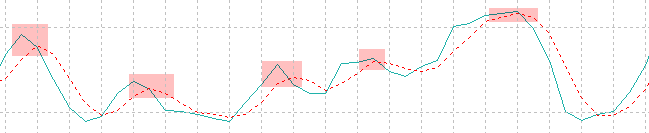
We are looking for sell when the divergence occurs on the upper side:
Example 1:
Example 2:
***I recommend you to combine with other technical analysis for further confirmation when spotting this signal.
The Forex Stochastic Strategy Method In A Nutshell:
So, here is a basic outline of what you’ll be doing with this method:
-
Identify Trend – To filter bad trades
-
Look for stochastic signal – Oversold for buy while overbought for sell.
Also, don’t forget to implement the divergence method to your trading plan. I’m really sure that if you’re implementing this tactics a lot, you’re going to understand and able to trade easier.
I hope you enjoyed reading this short, simple blog post on Forex Stochastic Strategy. I wish you the best success in trading! Do share and comment if you are enjoying this! 🙂
Best regards,
Tim Morris
admin @ ForexMT4Indicators.com
Recommended Forex Trading Broker
- Free $30 To Start Trading Instantly
- No Deposit Required
- Automatically Credited To Your Account
- No Hidden Terms

Good day,
Great indicators. Please let me know how I can download one of them.
Hi Lloyd,
For this strategy, you do not need to download any indicator.
Just follow “Step” https://www.forexmt4indicators.com/forex-stochastic-strategy/#Step_1_Identify_the_trend
And set the setting in your MT4.
As for other Stochastic Strategies, you can go to this search link below.
https://www.forexmt4indicators.com/?s=Stochastic
Regards,
Tim Morris
Very comprehensive and easy Forex strategies. Thanks for all the efforts. I love this website.
Thanks M.A.Shahid 🙂
I will be updating more forex trading strategies soon!
Learning a lot from your site. Thanks!
What are the Stochastic settings for this strategy?
Hi Jason,
The settings on the Stochastic Oscillator depend on personal preferences, trading style, and timeframe. We are using the default: 80 as the overbought threshold and 20 as the oversold threshold.
Tendré que hacer pruebas